Week 9 - Parametric study on Gate valve.
Aim and its objective:
Performing a parametric analysis on the gate valve simulation is the aim. This project's objectives are to perform a parametric analysis on the gate valve with an opening range of 10% to 80% in order to:
- Find the mass flow rates at each design point's outlet.
- Plot the graph after calculating the flow factor and coefficient for each opening.
- Discuss the results of the mass flow rate and flow coefficient.
Introduction:
A gate valve, also known as a sluice valve, is a valve that opens by lifting a barrier (gate) out of the path of the fluid. Gate valves require very little space along the pipe axis and hardly restrict the flow of fluid when the gate is fully opened. The gate faces can be parallel but are most commonly wedge-shaped (to be able to apply pressure on the sealing surface).
Parametric study:
A parametric analysis is one of the best ways to get value out of your simulation. With very little marginal work a completed model can be parameterized to simulate scenarios limited only by your computational time and resources.
- Design Objective is set to Parametric Dimensions
- Parameters nominated for use in the simulation
- parameter ranges identified
- Design criteria specified
- Various configurations generated
Procedure:
Pre-processor
- Importing geometry in SpaceClaim The following geometry was imported into SpaceClaim.
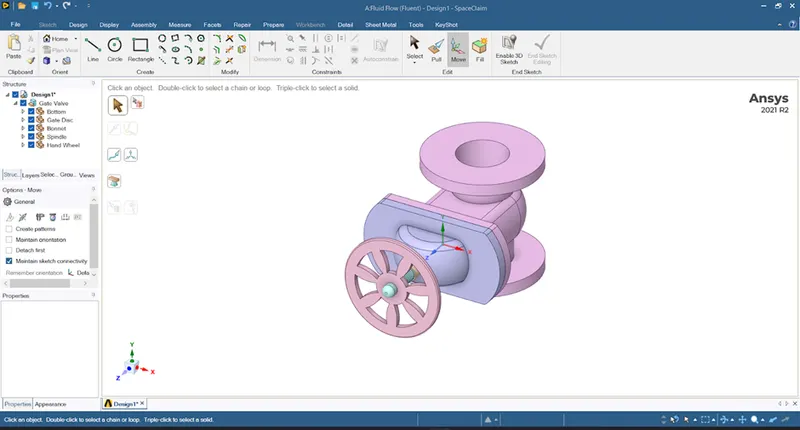
- The bonnet is placed below the handwheel and prevents the splashing of fluid from the upper region.
- Handwheel and spindle that can be used to lift or lower the gate disc.
- The gate disc is attached to the spindle at the bottom.
- The bottom is a casing that covers the gate disc and the water flows through it. Two ports serve as an inlet and outlet for the fluid.
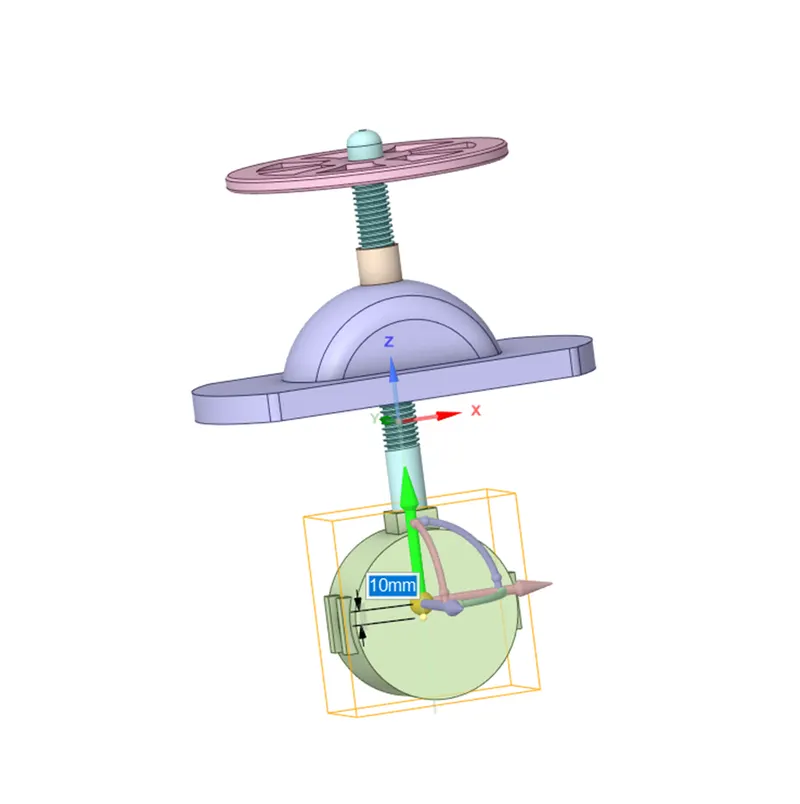
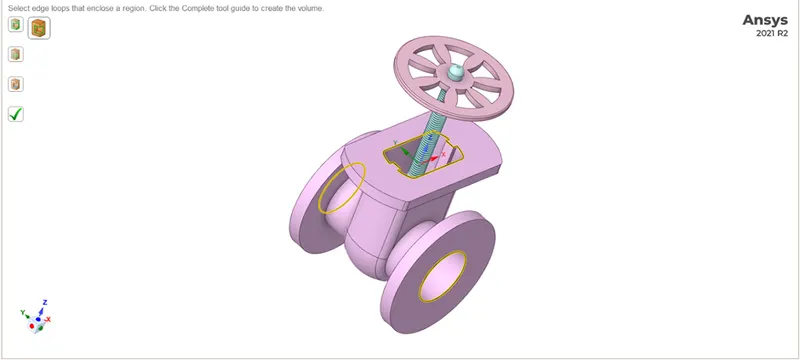
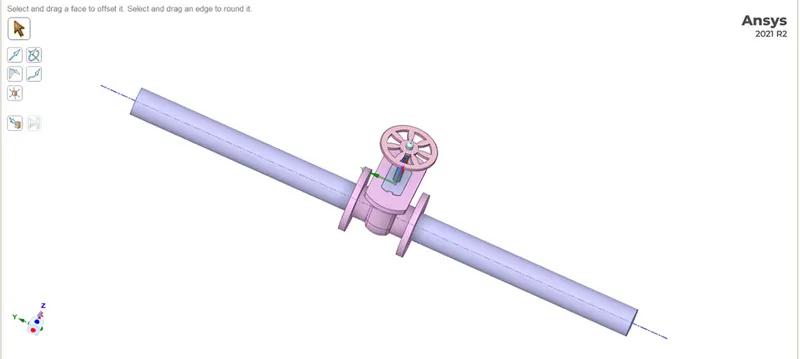
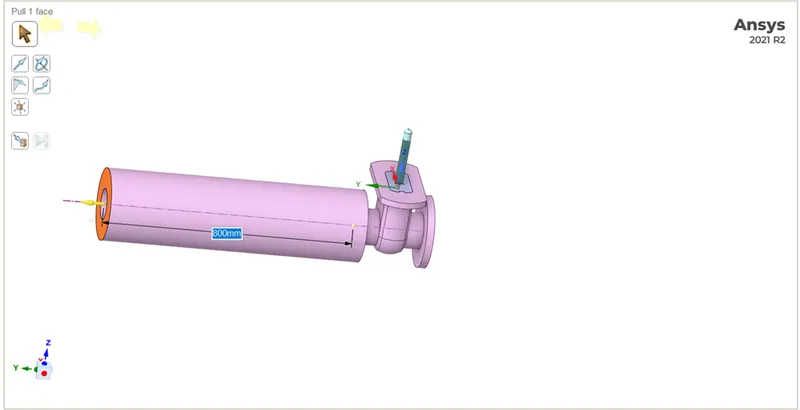
- First, we extend the geometry of the inlet and outlet ports by 800 mm each. It will look as shown below.
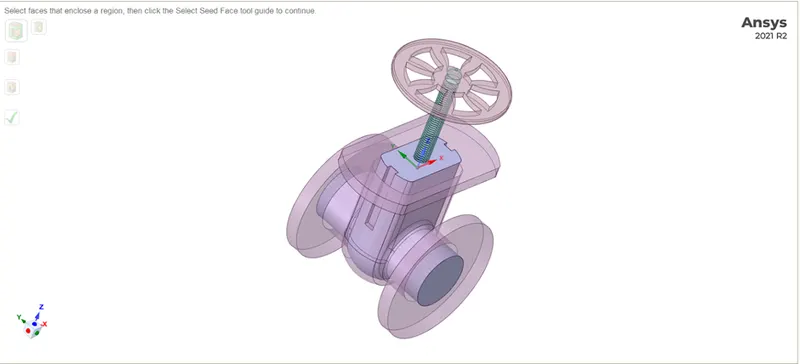
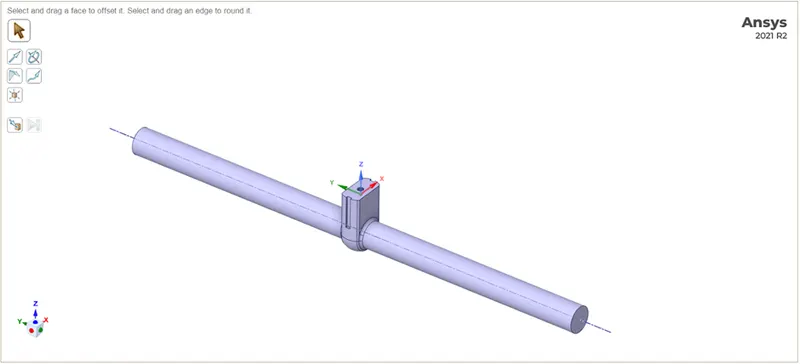
- After extension, create Fluid volume by selecting the inlet, outlet, and upper edges of the “Bottom” part. The creation of fluid volume is shown below:
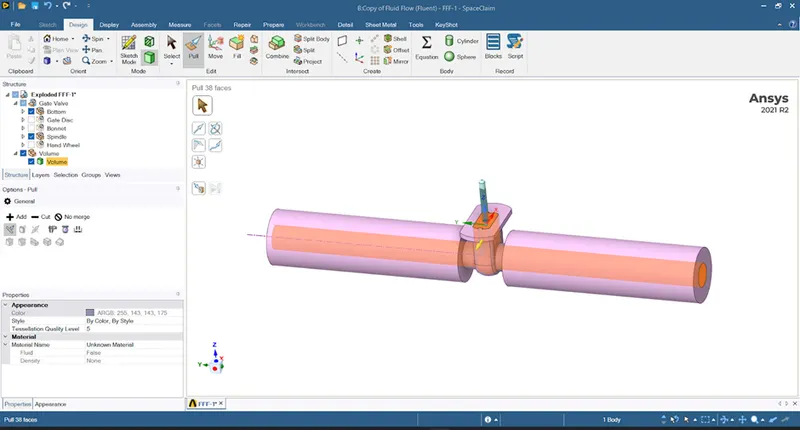
- After generating fluid volume, hide all parts and suppress them for physics. Make sure to not hide gate-disc and spindle on behalf of which fluid volume must be created to involve necessary solid boundaries.
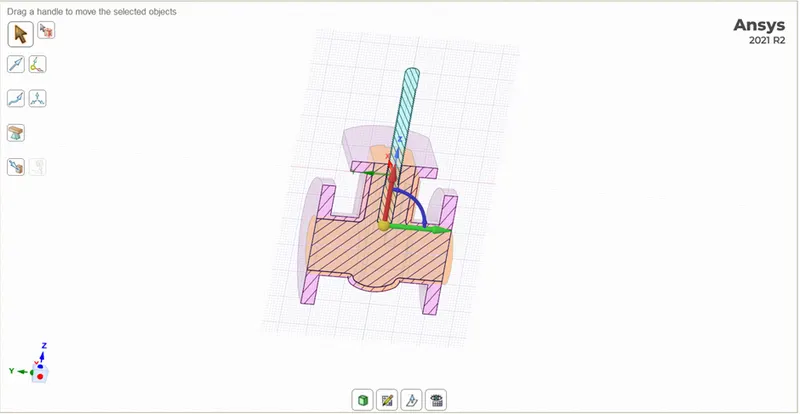
- We then lift the gate valve by 10mm by using the move option and click on the icon P alongside the dimension to parameterize the gate valve opening.
- Don't hide the bottom, gate disc, and spindle for parametrization, and set the solid part Volume inside the fluid volume to Update concerning context.
Meshing:
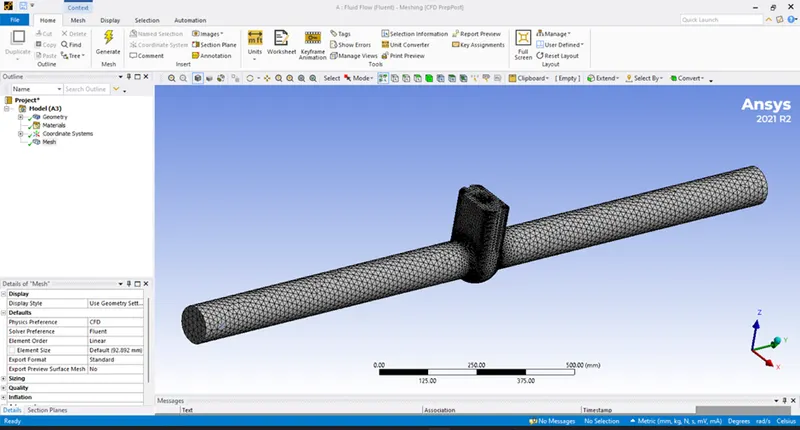
Named Selections:
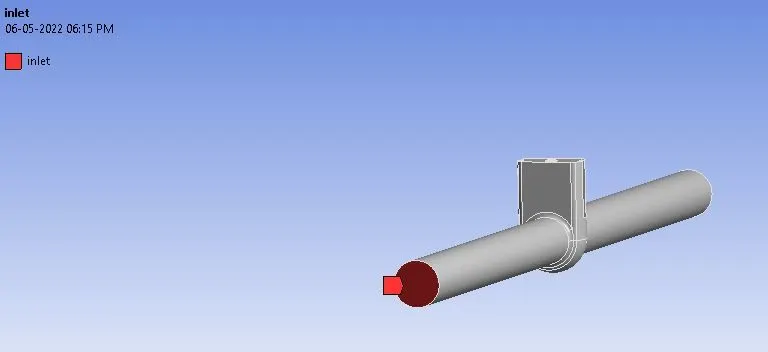
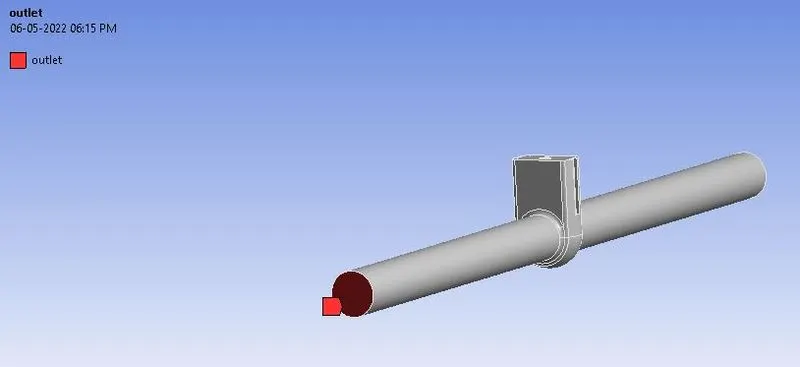
Setting Up Physics:
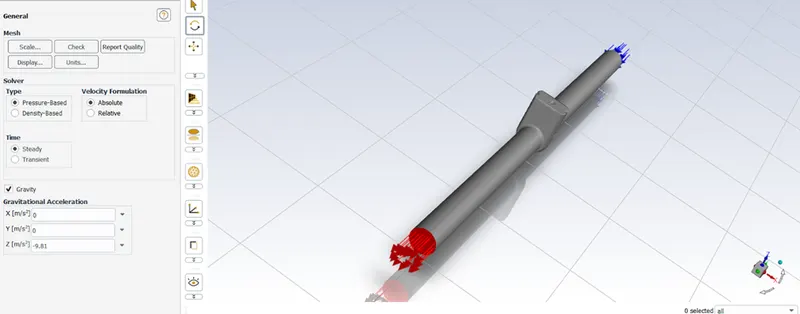
First of all the mesh is set up and the solver is defined as below:
Solver Type: Pressure-Based Solver
Gravity: -9.81 (in the negative z-direction)
Solver: Steady State
Model: k-epsilon model (realizable with scalable wall function) & Material: Water
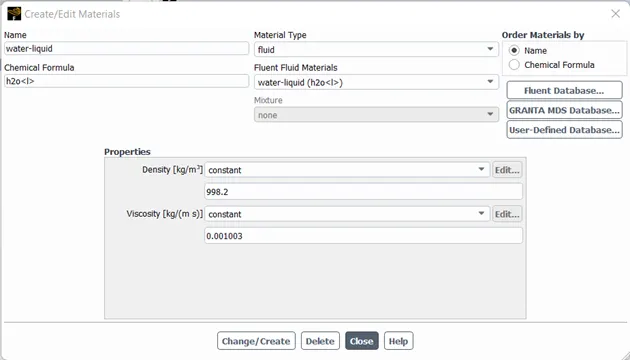
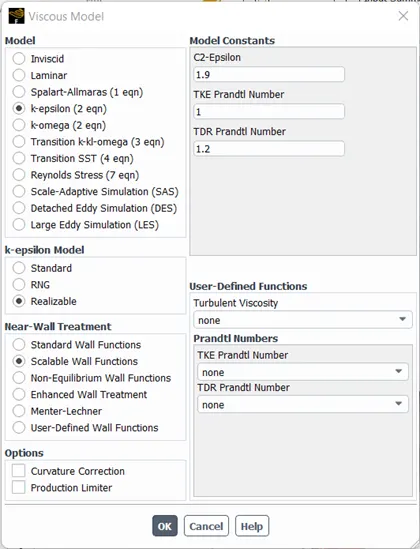
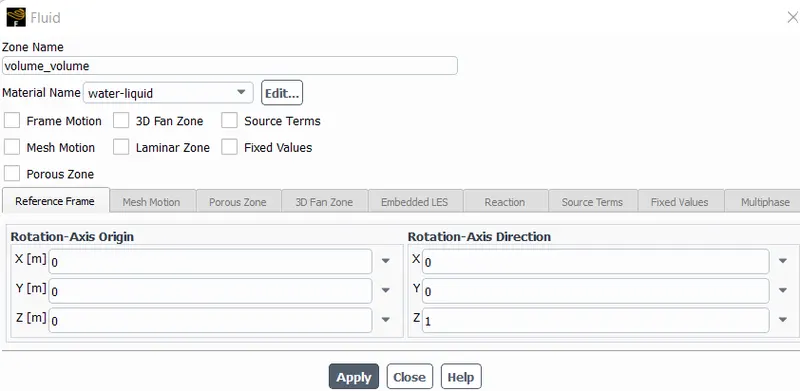
Cell Zone: Fluid(water)
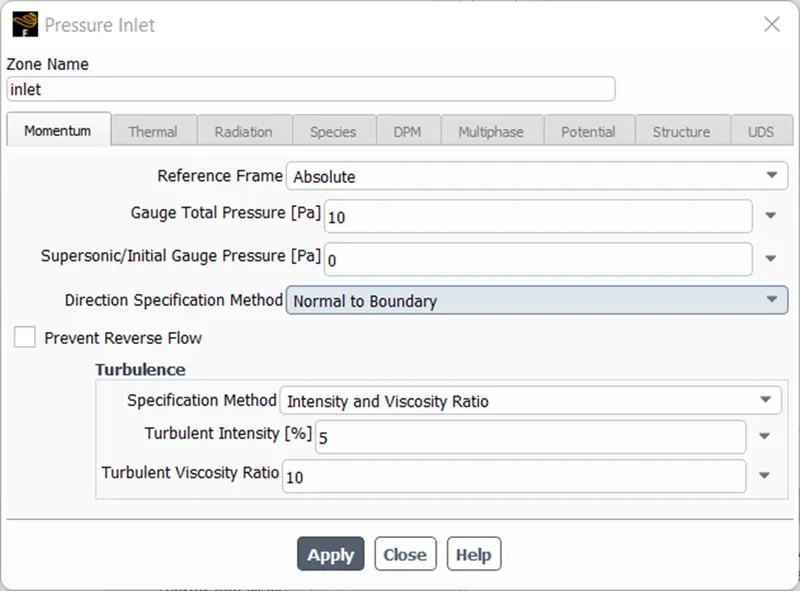
Inlet Boundary Condition: Pressure Inlet (10Pa)
Outlet Boundary Condition: Pressure Outlet
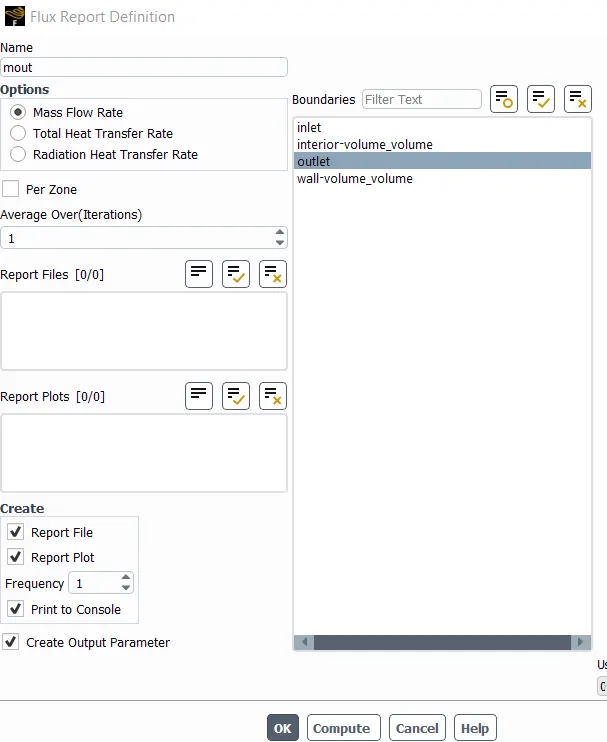
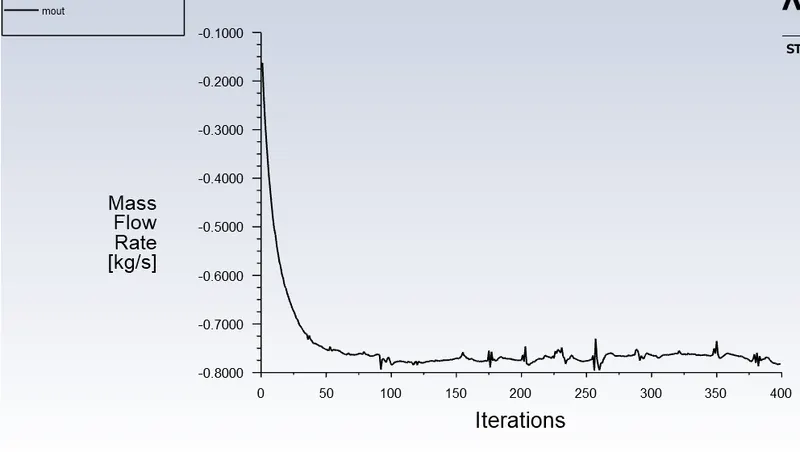
Flux parameter is included for mass flow rate at outlet.
The model will be initialized with standard initialization and the data will be computed from the inlet.
Parametric study:
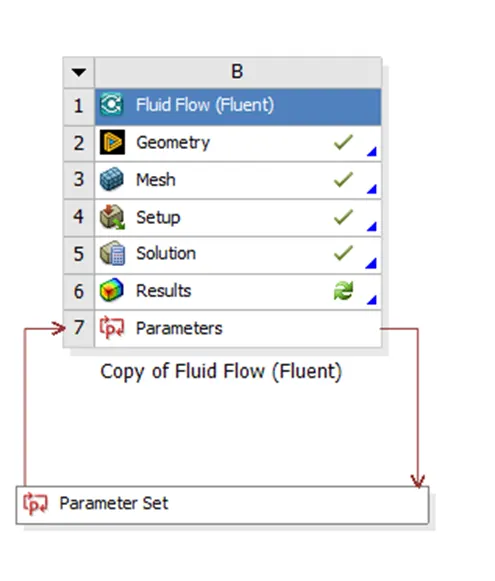
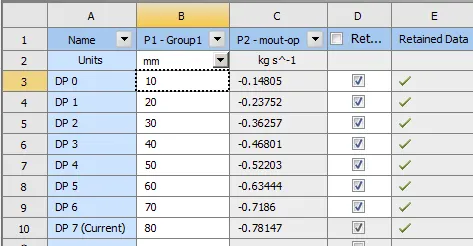
The lift parameter is set and the mass flow rate is included as the output parameter.
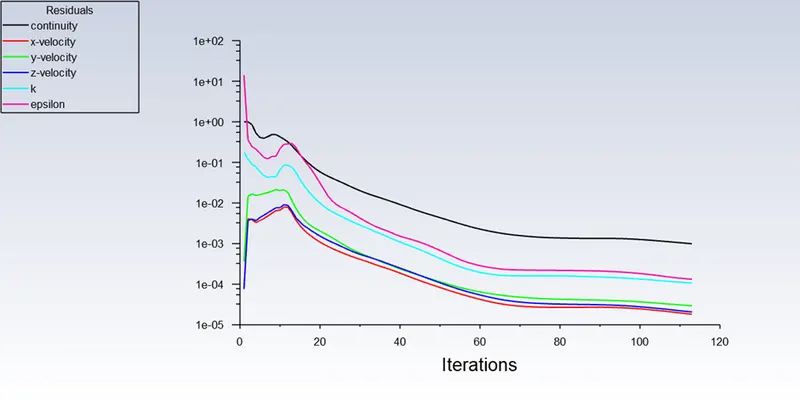
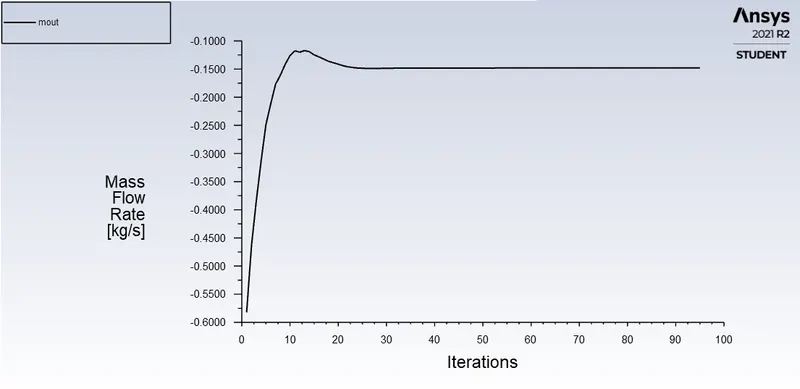
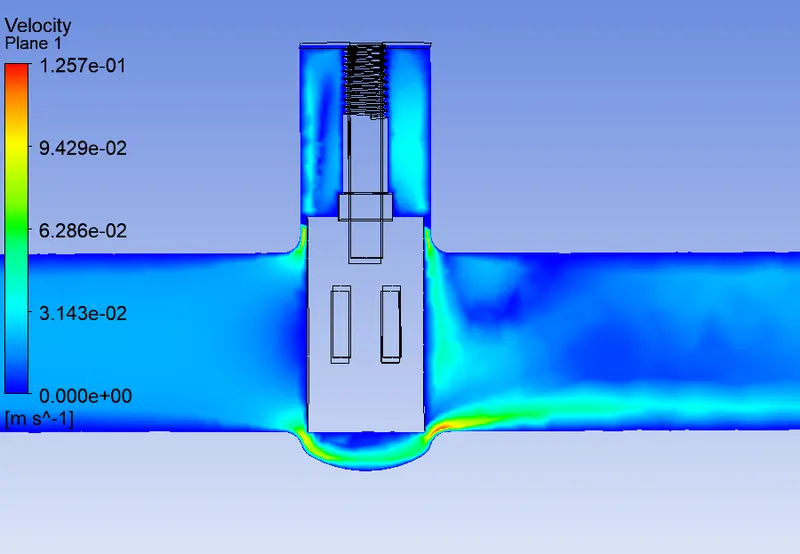
1) Case 1: Lift = 10 mm
Scaled residuals plot:
Mass flow rate:
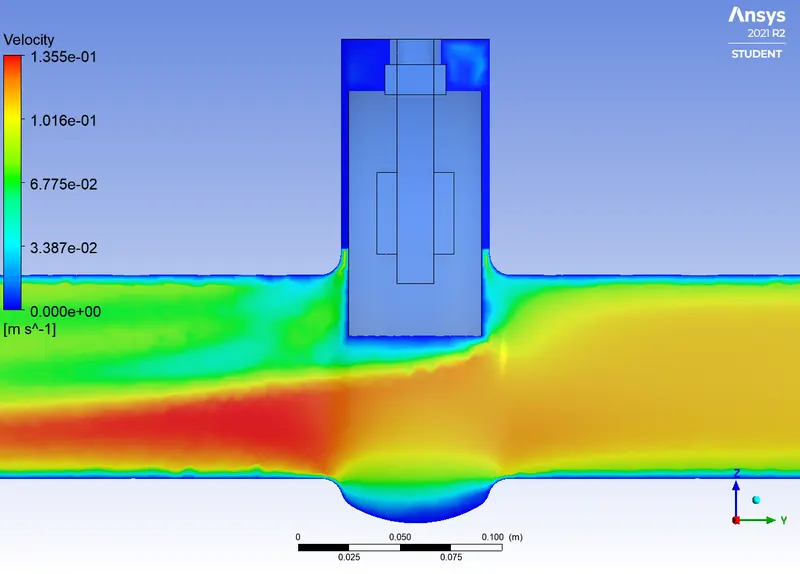
Velocity contour:
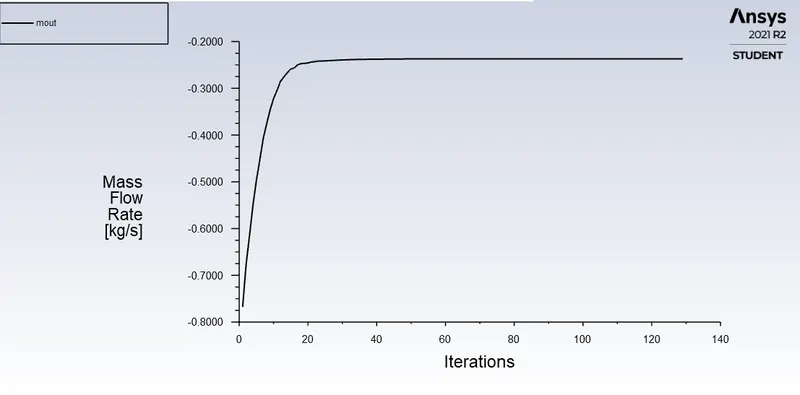
2) Case 2: Lift = 20 mm
Mass flow rate:
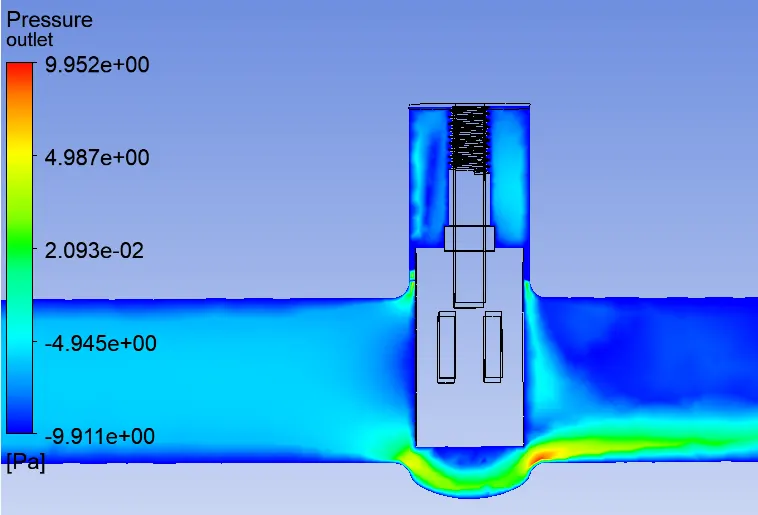
3) Case 3: Lift = 30 mm
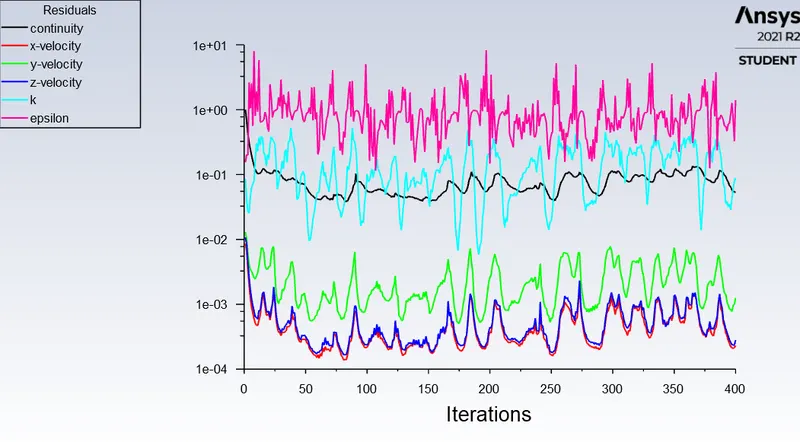
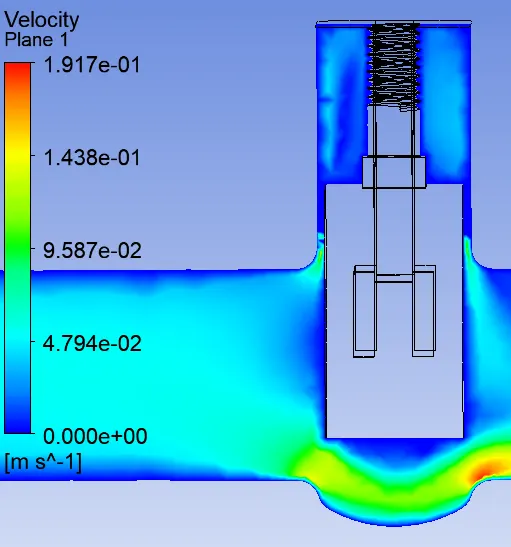
4) Case 4: Lift = 40 mm
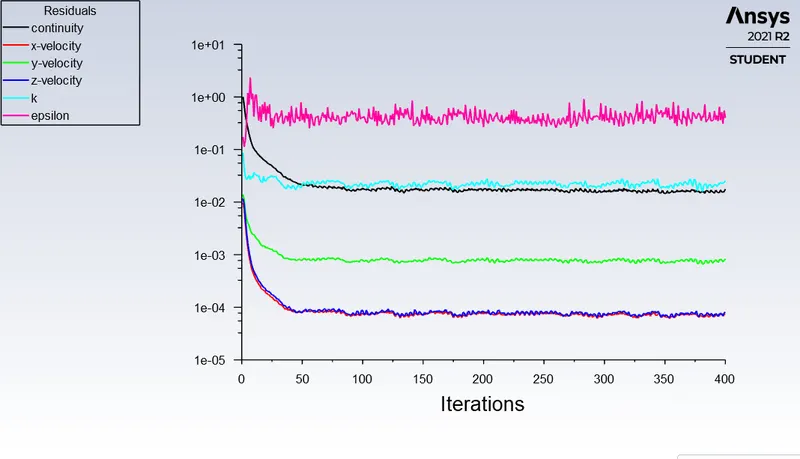
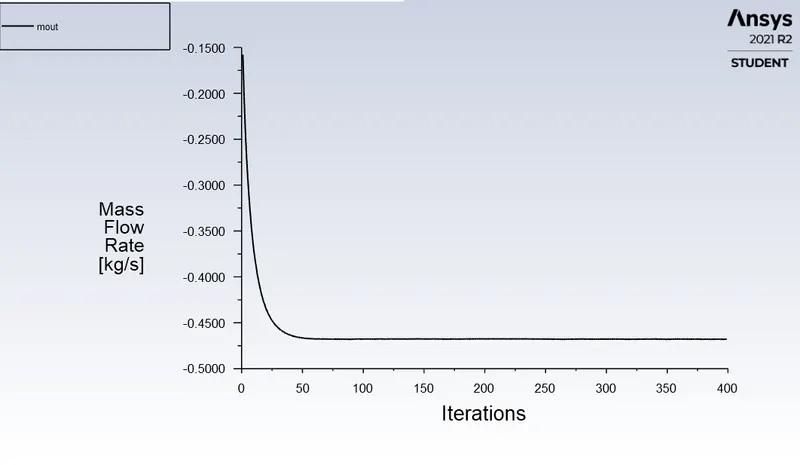
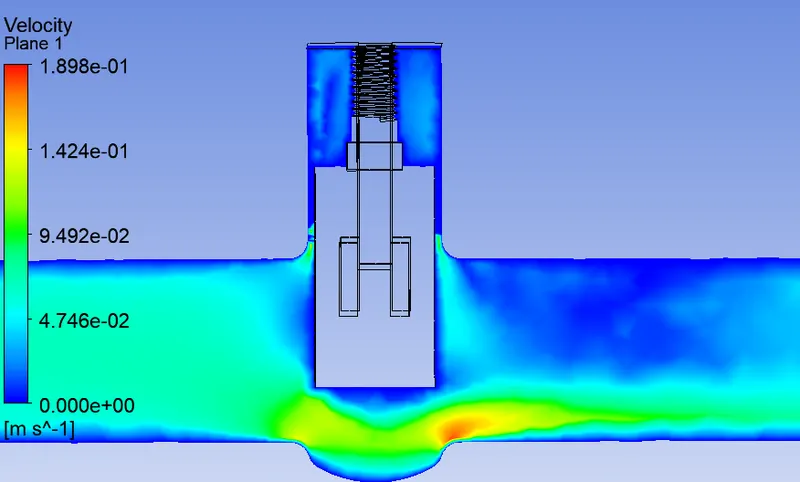
5) Case 5: Lift = 50 mm
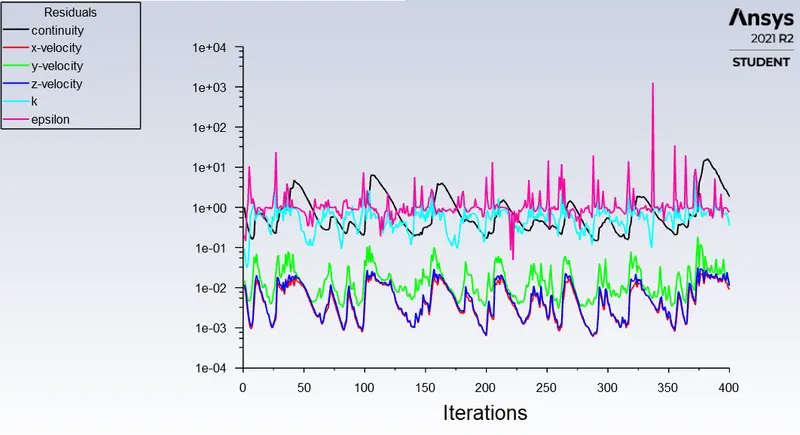
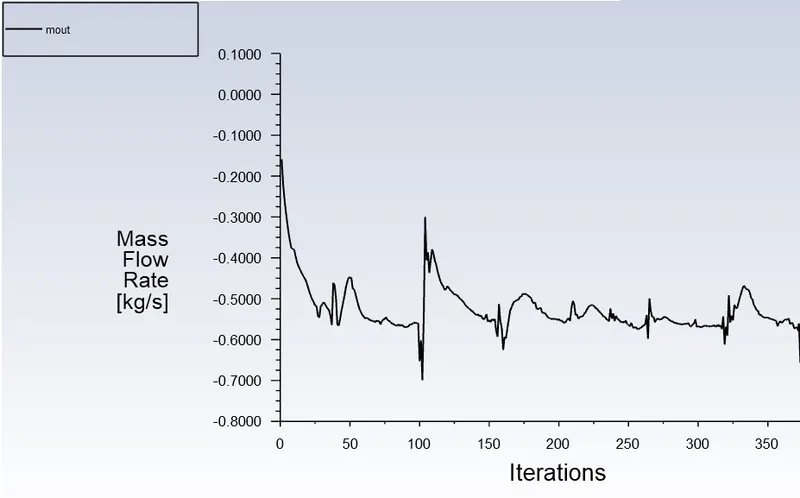
Velocity contour:
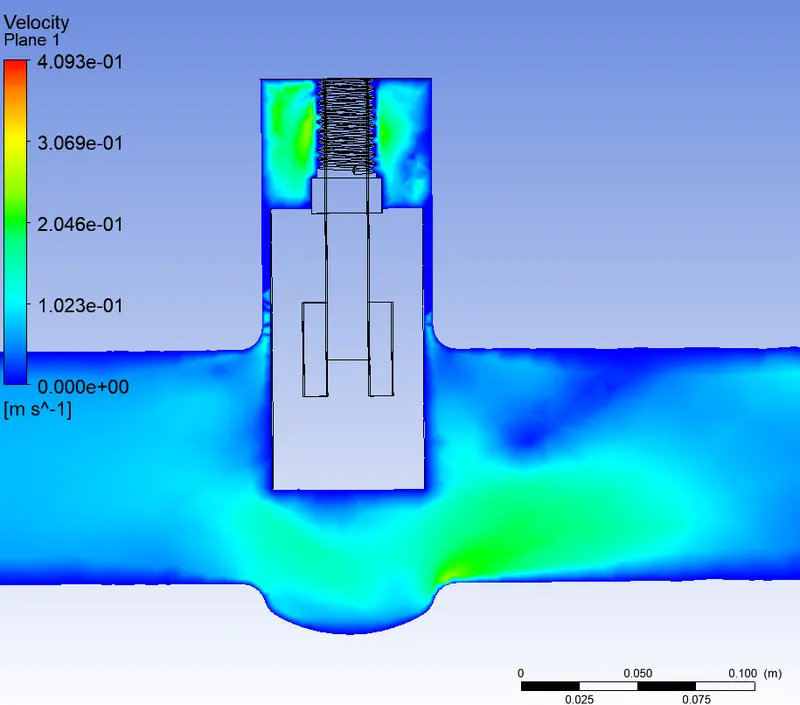
6) Case 6: Lift = 60 mm
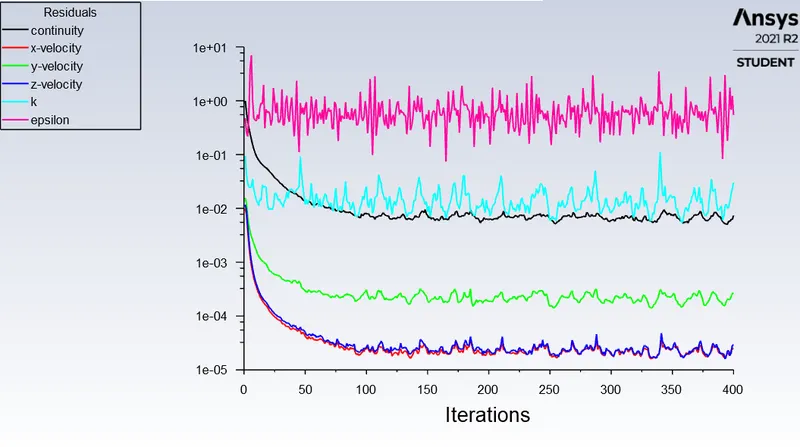
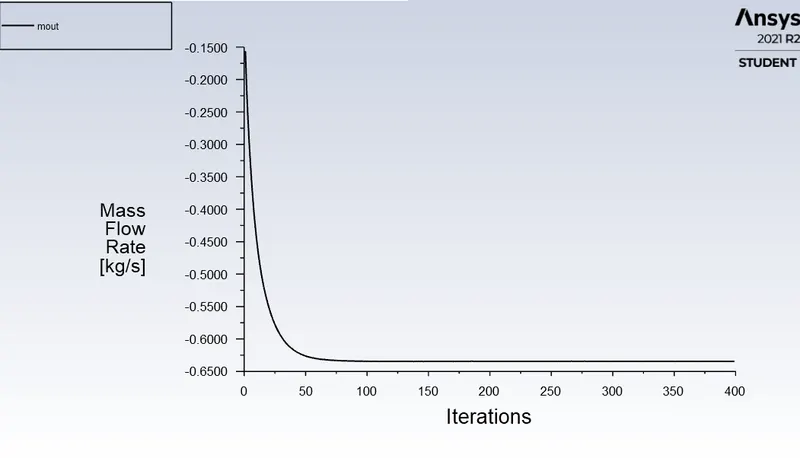
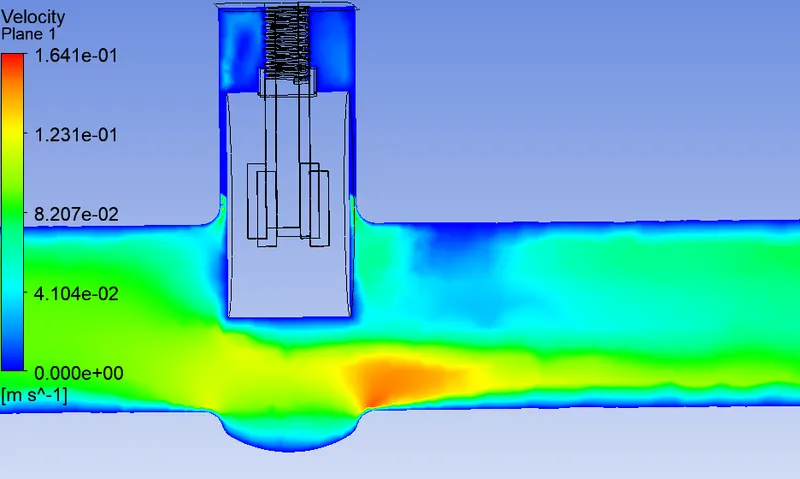
7) Case 7: Lift = 70 mm
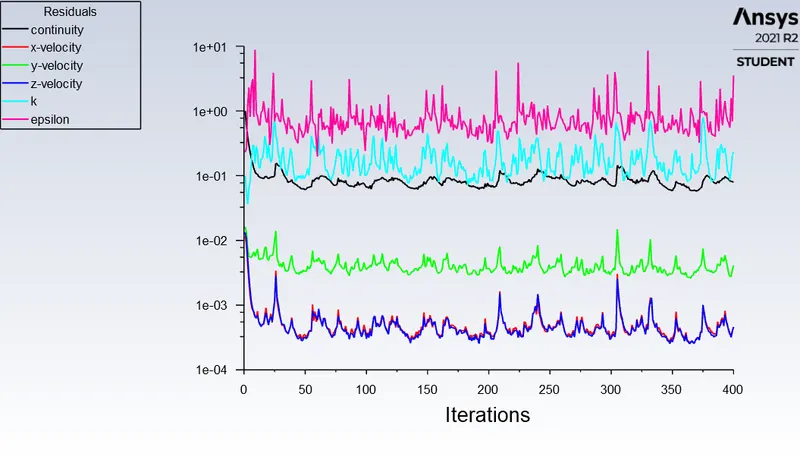
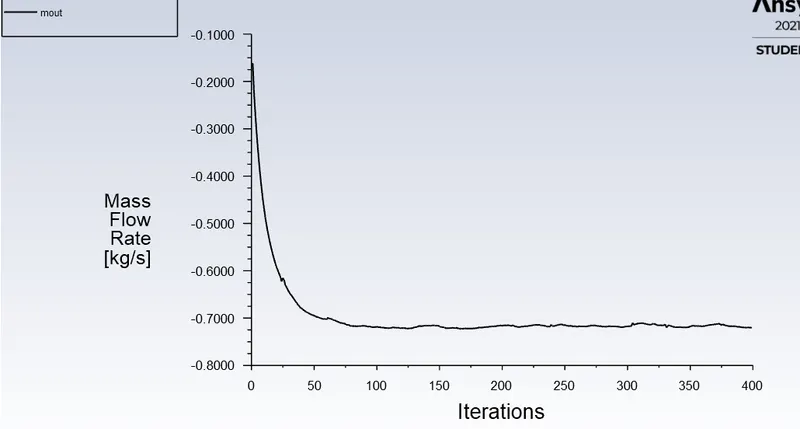
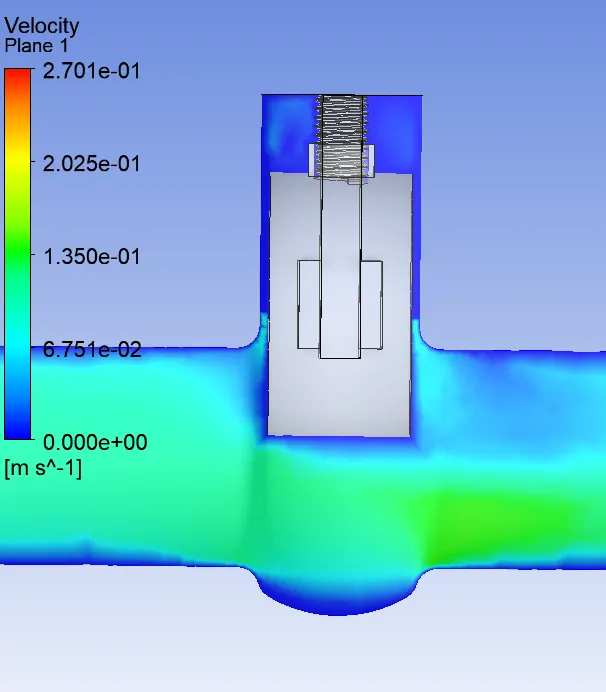
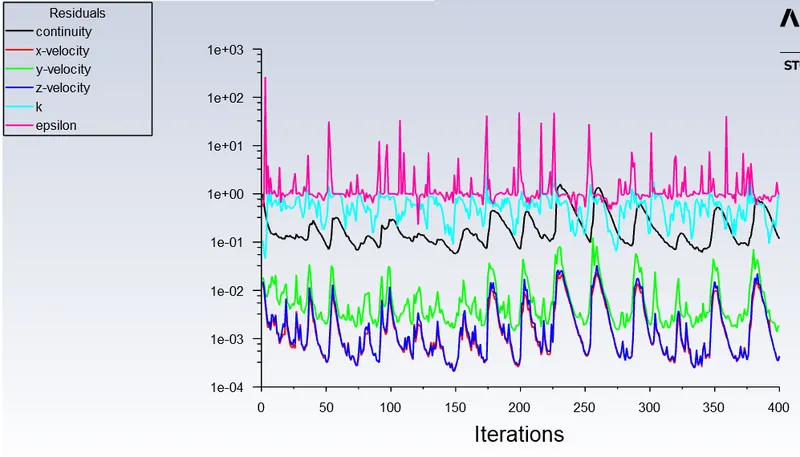
8) Case 8: Lift = 80 mm
Calculations:
Flow Factor (Kv) :
flow rate is the flow coefficient in metric units. It is defined as the flow rate in cubic meters per hour for water at the constant temperature of 16 degrees Celcius with a pressure drop of 1 bar across the valve.
Flow Coefficient (Cv) :
Cv is the flow coefficient in the imperial units. It is defined as the flow rate in US Gallons per minute of water at a constant temperature of 60 degrees Fahrenheit and a pressure drop of 1 psi across the valve. It is used to determine the flow under various conditions and to select the proper valve for the various applications.
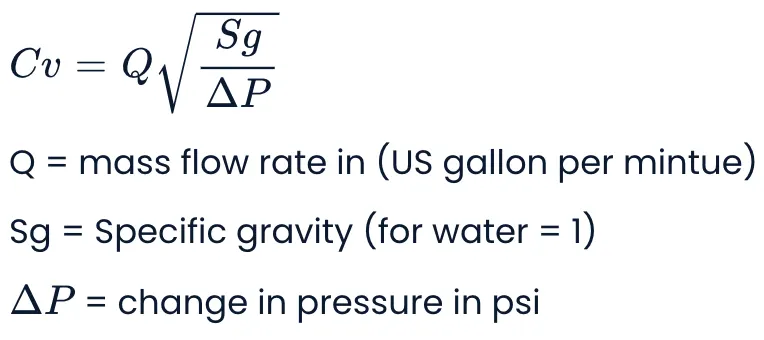
Flow factor Kv =0.865* Cv
Flow coefficient Cv= Kv/0.865
The Table was prepared in Excel as shown below.

Graphs are obtained when plotting Cv and Kv with respect to valve opening.
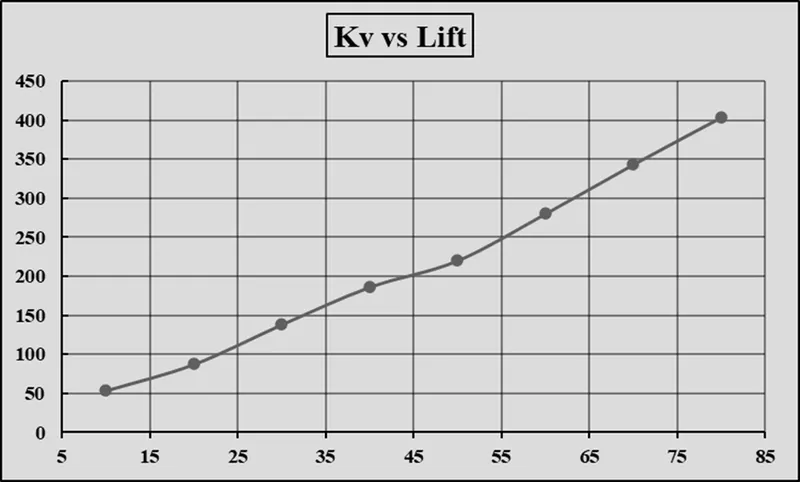
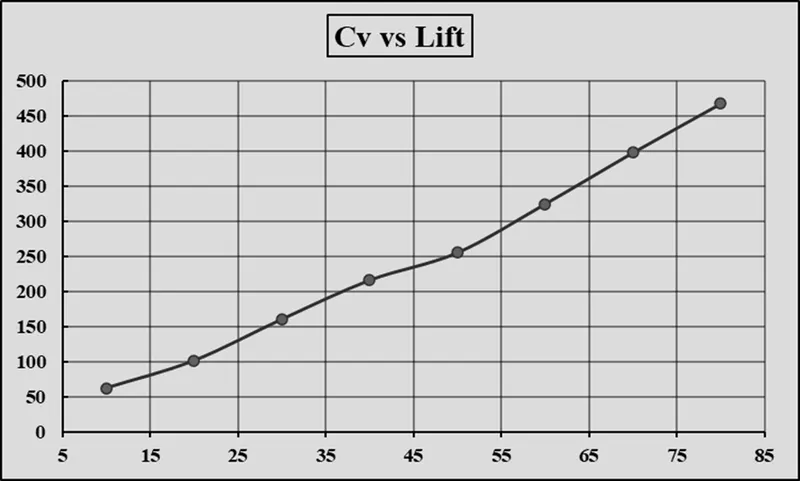
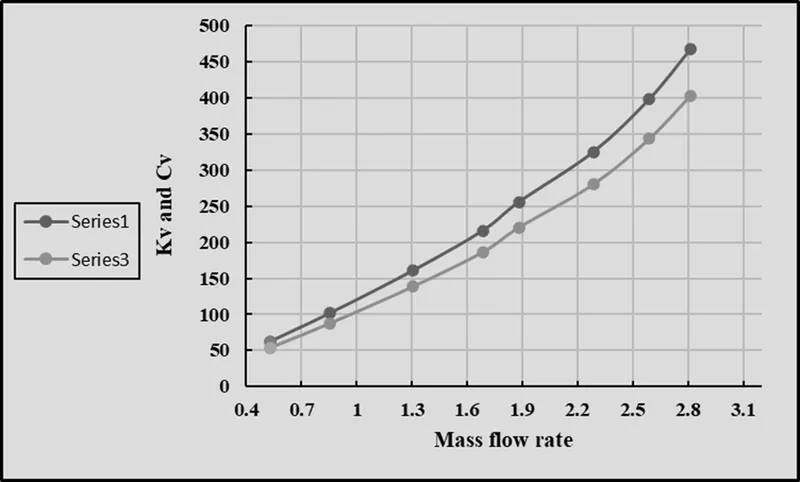
From the above Tabular Data and Graphs, we can observe that
- The opening of the Gate Valve or Lift of the Gate Disc increases the Mass Flow Rate increases.
- With Increases in Mass Flow Rate, there is an increment in Flow Coefficient.
- Also, Increases in Flow Factor are observed at each Design Point from 10 to 80 mm Lift.
- So, the Graph of Mass Flow Rate, Flow Coefficient, and Flow Factor goes linearly with Gate Disc Opening.
Conclusion
Finally, the parametric study is performed on the gate valve varying the gate disc opening from 10% to 80%. The mass flow rate, the flow coefficient, and the flow factor are calculated and plotted. From the results, we conclude that the velocity keeps increasing as the gate disc opening or lift increases. As for the pressure, it decreases from the inlet where it is high to the outlet where it becomes 0. As the gate disc opening increases from 10% to 80%, there is an incrementation in Mass flow rate, flow coefficient and flow factor.
In the above results and graphs, one can notice that the design points corresponding to 40 mm and 60 mm are not considered; this is because the obtained results are not accurate. The reason behind this is the bug from the Ansys Student version.