Week 9 - Parametric study on Gate valve.
Aim: Perform a parametric study on the gate valve simulation by setting the opening from 10 % to 80%.
Theory:
- Gate valve are mainly used in industries to shut the flow of a fluid rather than flow regulation. They can be found in petrochemical industries, power plants and widely in the pipeline industries
- In this challenge we varying the gate valve opening from 10% to 80% and finds the results of mass flow rate and calculate the flow coefficient and flow factor for each opening and also finally we takes out the contour plot in post processing
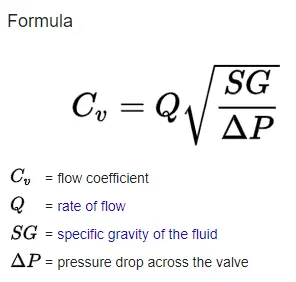
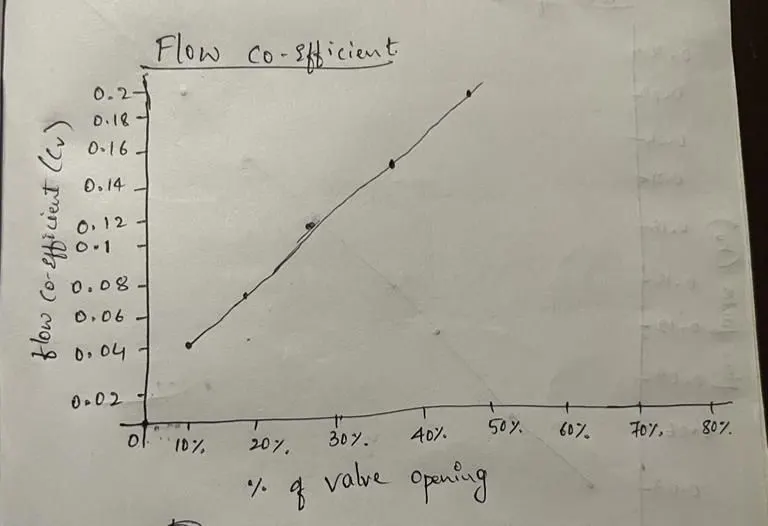
- The flow coefficient is a relative measure of its efficiency at allowing fluid flow. It describes the relationship between the pressure drop across an orifice valve or other assembly and the corresponding flow rate
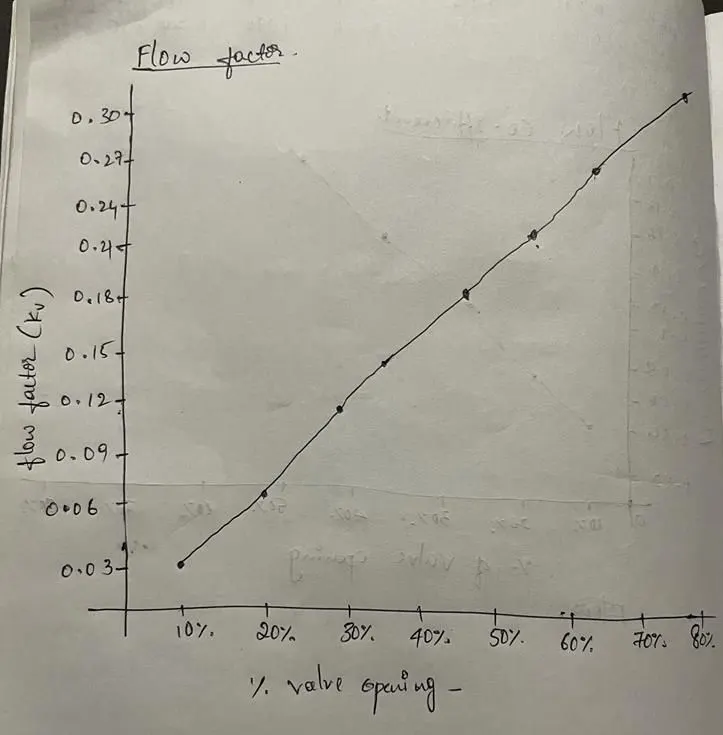
- The flow factor formula is kv = 0.865*Cv
Procedure to run Gate valve simulation:
- First we opening the new space claim window then we import the Geometry and we perform operation like extending inlet and outlet by pulling, Creating the parametric for the gate disc movement, Volume extraction, and supress the physics
- How we extend the inlet and oulet by pulling is shown in image2
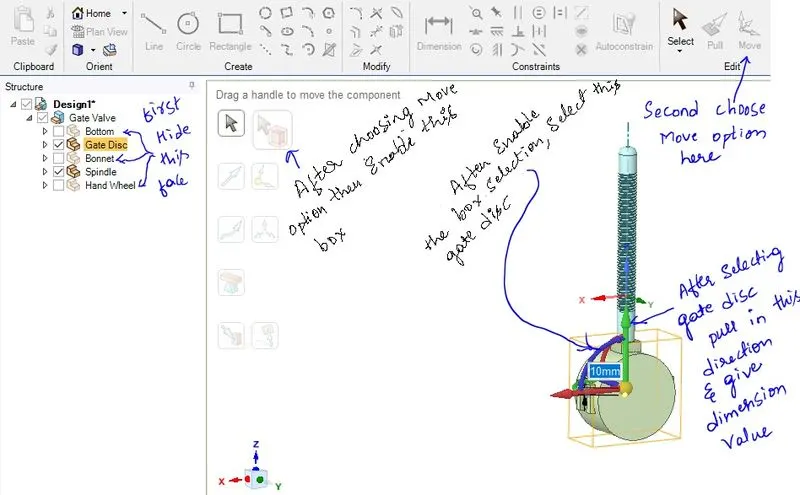
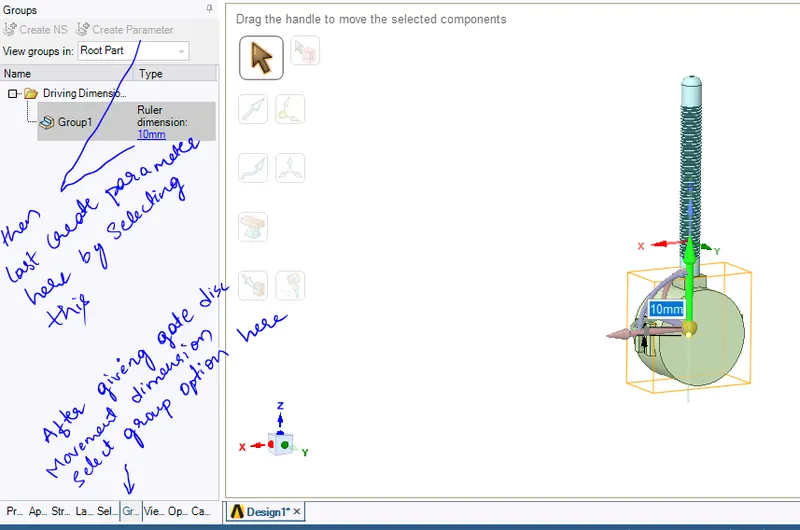
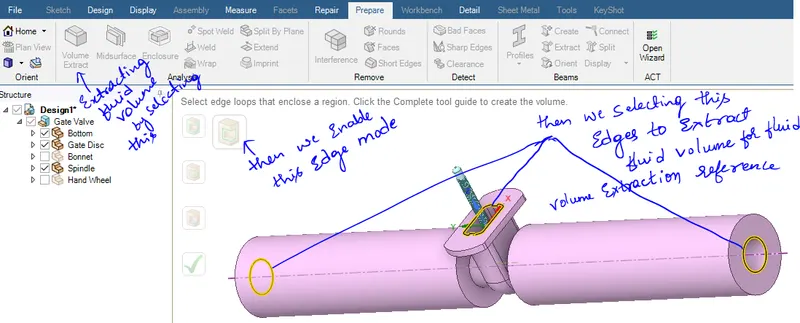
- How we creating paramteric for the disc movement, how we do the volume extraction, and how we supress physics is shown in image3
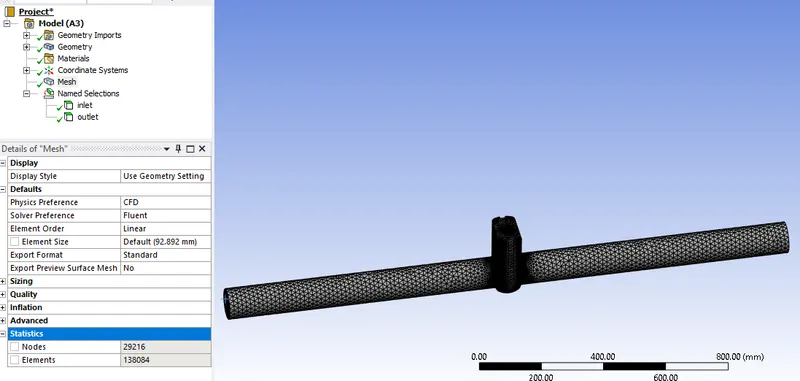
- Then we close the new space claim window and open the meshing window and performimg the Default mesh to fluid volume, The meshed model is shown in image4
- After meshing we close the mesh window and open the setup window
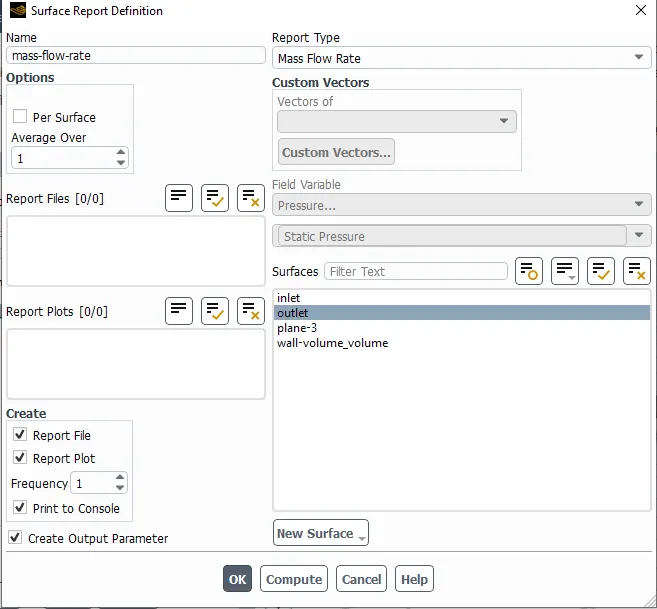
- In setup window we setting the viscous model. How we setting is shown in image5, Creating the water material by Copy from fluent database. How we copying is shown in image6, Editing the cell zone condition by changing fuild volume air into water. How we editing is shown in image7, Assigning the boundary condition by changing type pressure inlet and giving 20 pascal gauge pressure. How we assign the boundary condition is shown in image8 and Finally we creating Surface report for mass flow rate at outlet and enabling the print to console and enabling Create output parameter to get mass flow rate result as output in parametric table. How we creating surface report is shown in image9
- After setting the set up we intialize the problem and run the simulation upto the iteration result converging, Then we close the setup window and we open the parametric table
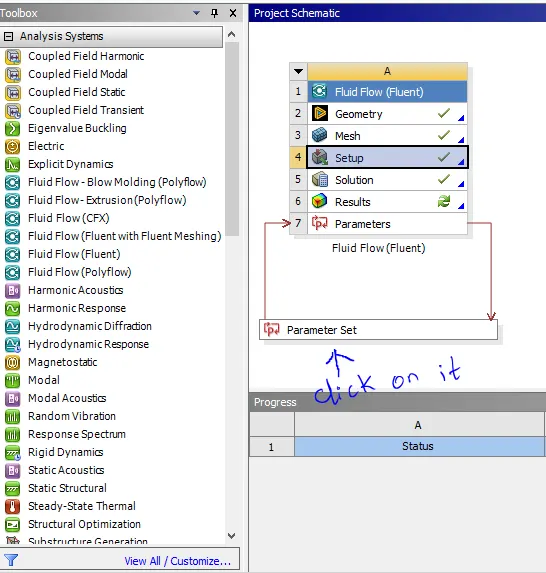
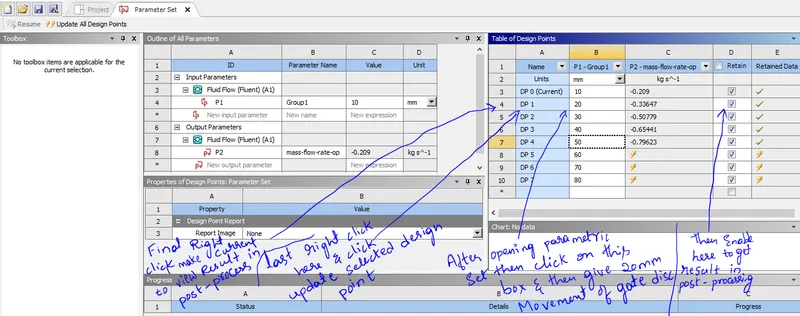
- In paramteric table we giving the movement dimension to gate valve for range the 10% to 80% opening and updating the mass flow rate for each opening. How we setting the parametric value and updating is shown in image10
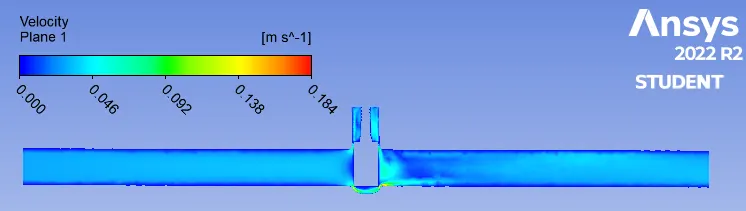
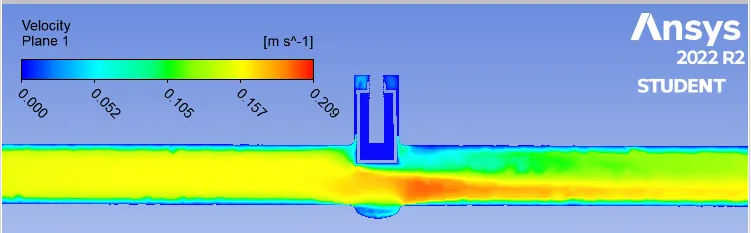
- Finally we taking the velocity contour plot and pressure drop of each gate valve opening case, But taking contour result or any post processing result of any case first in parametric table we set that case dp(design point) as current directry
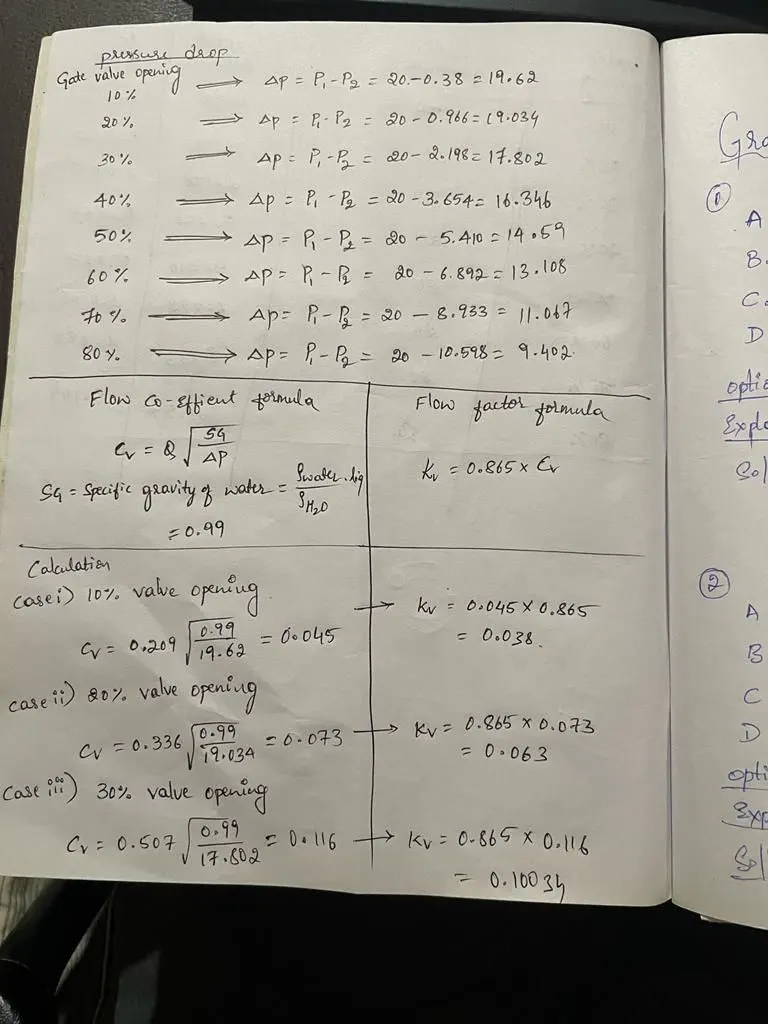
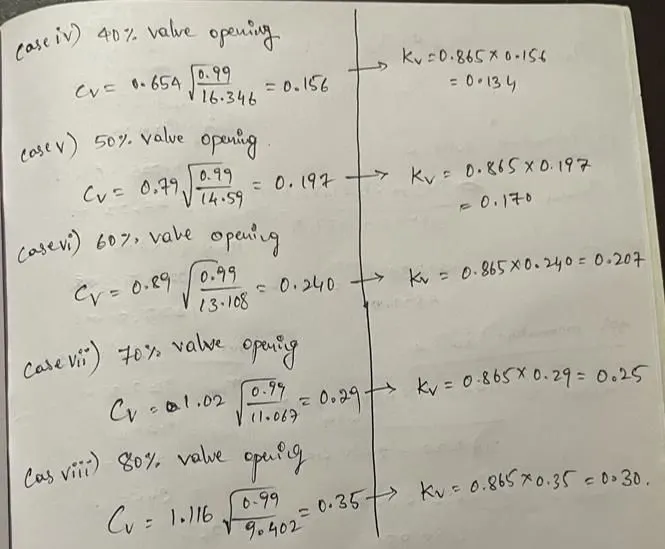
- After simulation by knowing pressure, specific gravity of water, mass flow rate from simulation result we calculate the Flow co-efficient and Flow factor
Calcultion for Flow coefficient and flow factor:
Geometry setting:
Image1: Given model
Image2- pulling inlet and exit pipe at some distance
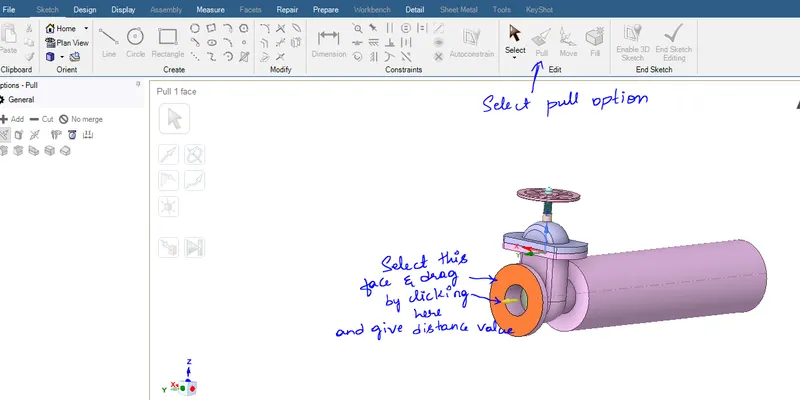
Image3-
parametric setting
Volume extraction
Supress design and final cut section view
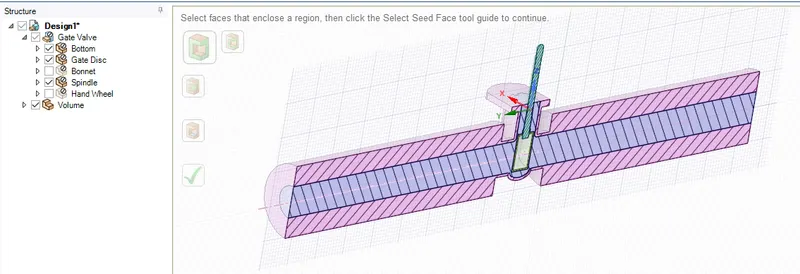
Image4- meshed model
Setup for solving:
Image5- setting the viscous model
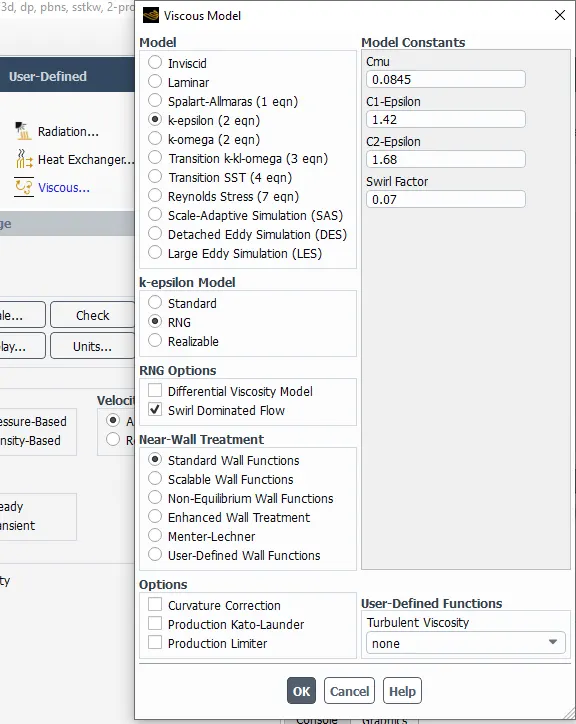
Image6- Creating the water material by Copy from fluent database
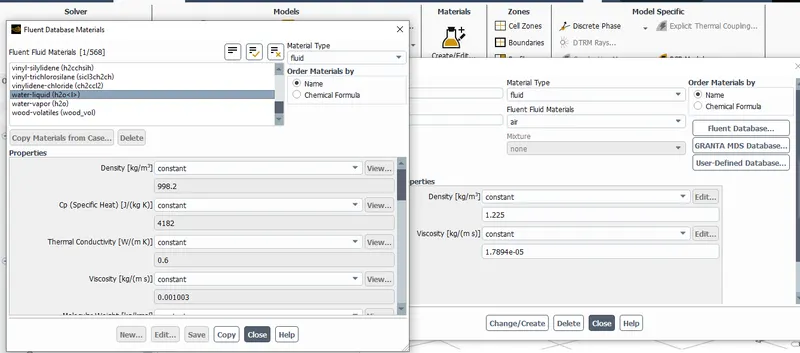
Image7- Editing the cell zone condition by changing fuild volume air into water
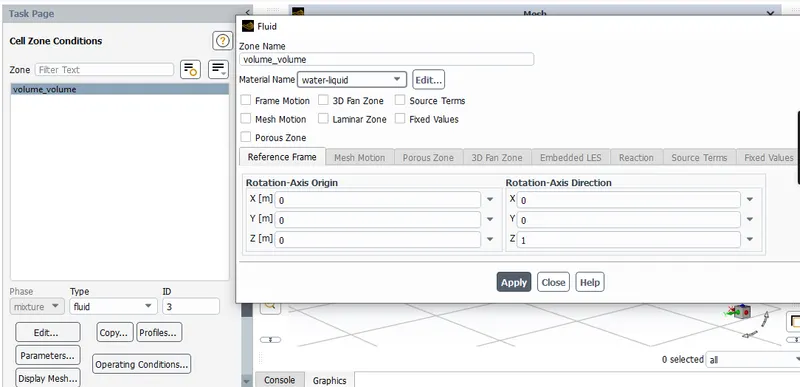
Image8- Assigning the boundary condition by changing type pressure inlet and giving 20 pascal gauge pressure
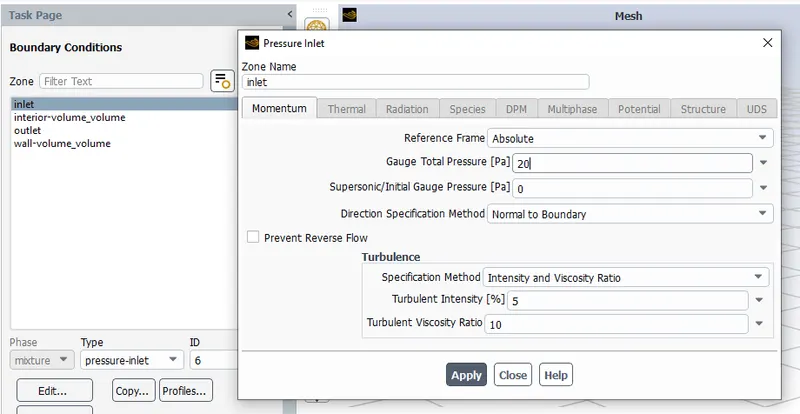
Image9- Creating Surface report for mass flow rate at outlet and enabling the print to console and enabling Create output parameter to get mass flow rate result at output parametric table
How we setting the parametric value and updating:
Image10-
Result:
Image11- Mass flow rate results in parametric table
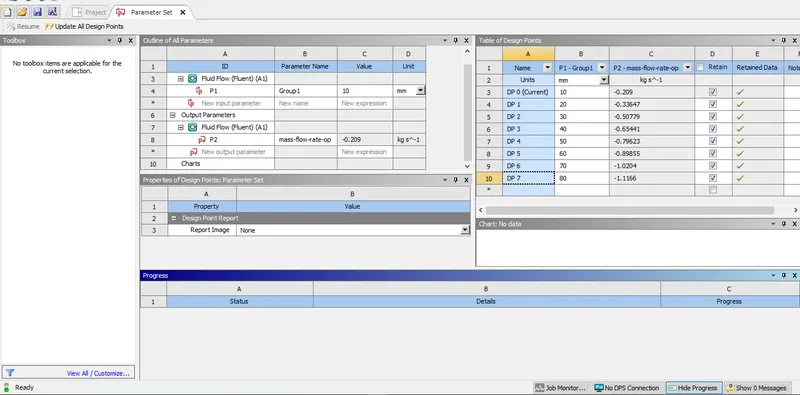
Image12- Contour plot result for each Gate valve opening case
case1:- 10% valve opening
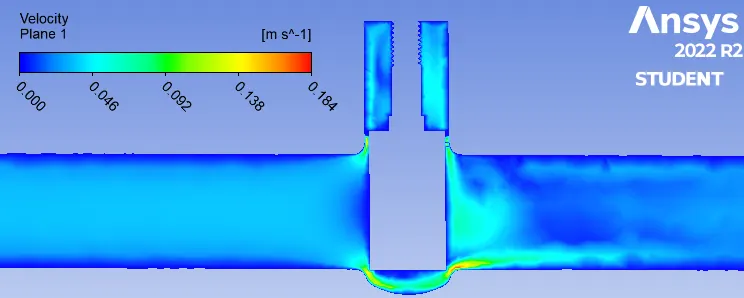
case2:- 20% valve opening
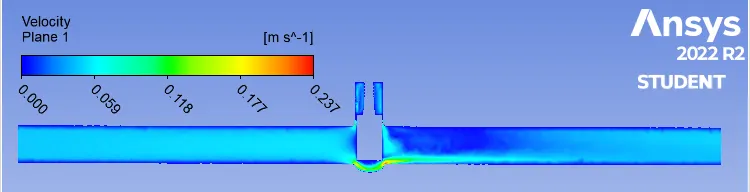
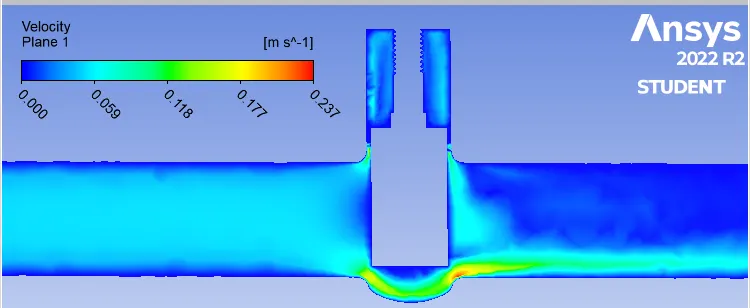
case3:- 30% valve opening
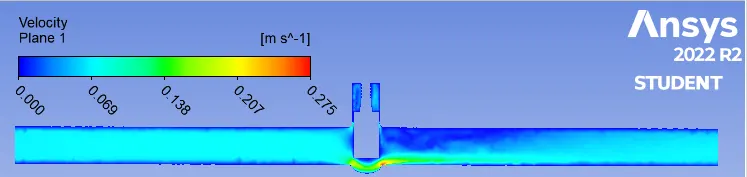
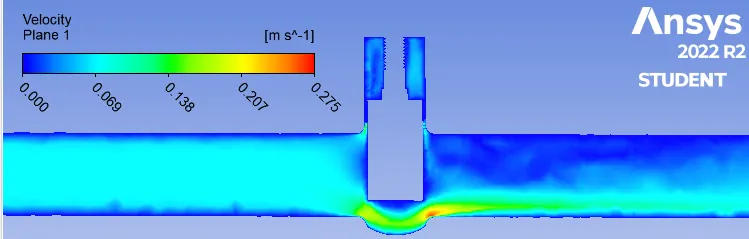
case4:- 40% valve opening
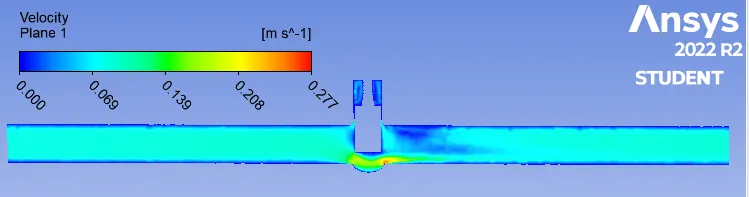
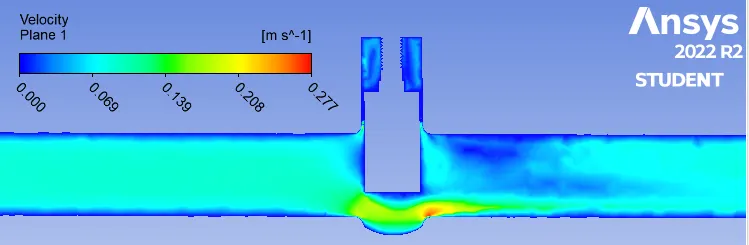
case5:- 50% valve opening
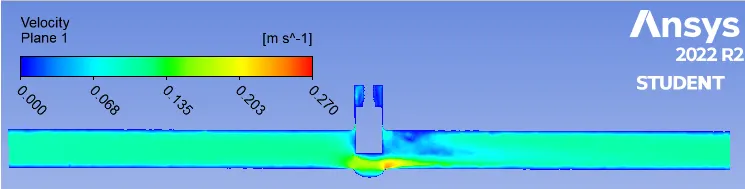
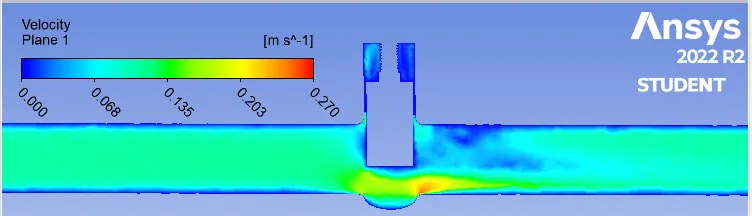
case6:- 60% valve opening
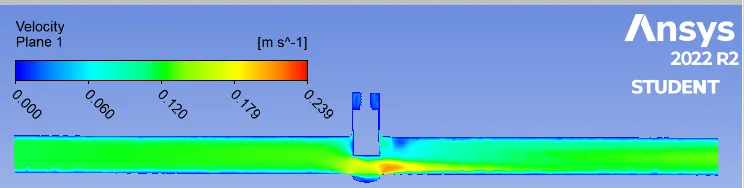
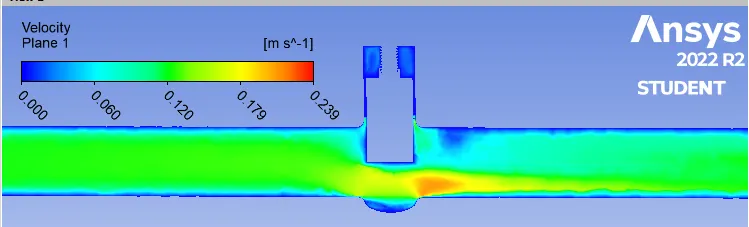
case7:- 70% valve opening
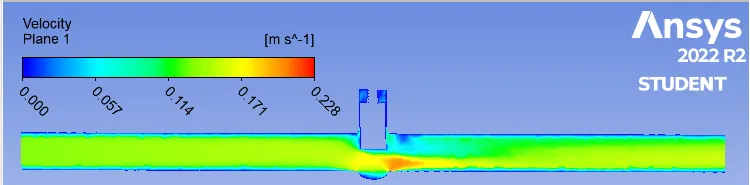
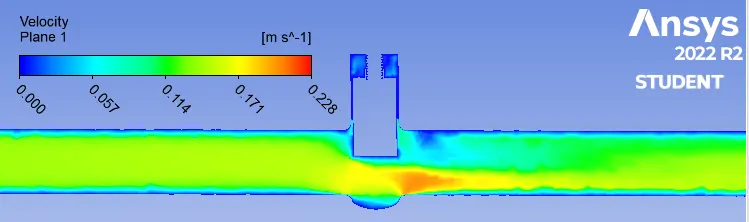
case8:- 80% valve opening
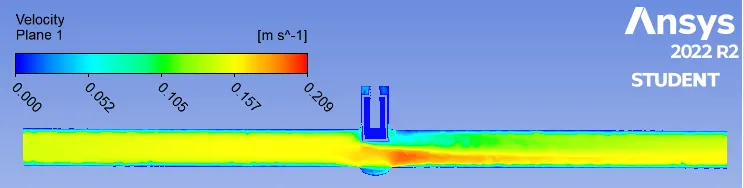
Results on tabular coumn:
| Gate valve opening | Mass flow rate | Pressure difference | Flow coefficient | Flow factor |
| 10% | 0.209 | 19.62 | 0.045 | 0.038 |
| 20% | 0.336 | 19.03 | 0.073 | 0.063 |
| 30% | 0.507 | 17.80 | 0.116 | 0.100 |
| 40% | 0.654 | 16.34 | 0.156 | 0.134 |
| 50% | 0.79 | 14.59 | 0.197 | 0.170 |
| 60% | 0.2089 | 13.10 | 0.240 | 0.207 |
| 70% | 1.02 | 11.06 | 0.29 | 0.25 |
| 80% | 1.116 | 9.402 | 0.35 | 0.30 |
Graph between gate valve opening v/s flow coefficient and gate valve opening v/s flow factor:
Final report definition:
- By interpret results from simulation the mass flow rate is higher by opening gate valve 80%
Conclusion: By following above procedure the simulation run successfully