Week 9 - Parametric study on Gate valve.
Aim:
To perform a parametric study on the gate valve simulation by setting the opening from 10 % to 80%.
Objectives:
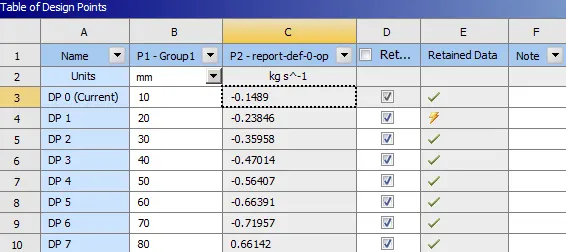
- Obtain the mass flow rates at the outlet for each design point.
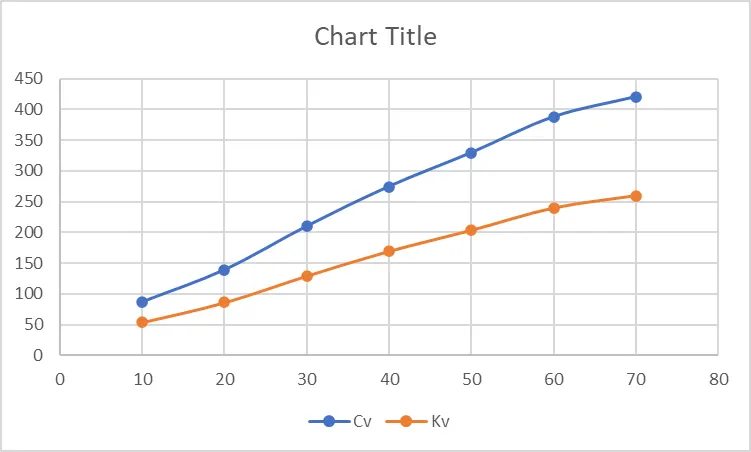
- Calculate the flow coefficient and flow factor for each opening and plot the graph.
- Discuss the results of the mass flow rate and flow coefficient.
Introduction:
Gate valve:
A gate valve, also known as a sluice valve, is a valve that opens by lifting a barrier (gate) out of the path of the fluid. Gate valves require very little space along the pipe axis and hardly restrict the flow of fluid when the gate is fully opened. The gate faces can be parallel but are most commonly wedge-shaped (in order to be able to apply pressure on the sealing surface).
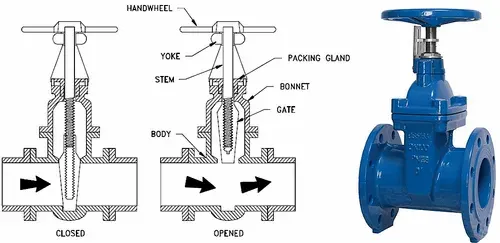
Gate valves are used to shut off the flow of liquids rather than for flow regulation. When fully open, the typical gate valve has no obstruction in the flow path, resulting in very low flow resistance. The size of the open flow path generally varies in a nonlinear manner as the gate is moved. This means that the flow rate does not change evenly with stem travel. Depending on the construction, a partially open gate can vibrate from the fluid flow.
Applications of gate valve:
Gate valves (Sluice Valve) are used in piping systems as an isolating valve, designed for fully open or fully closed service. It is a multi-turn valve that means the operation of the valve is done employing a threaded stem. Industrial gate valves are commonly used when minimum pressure loss and a free bore are needed.
When the gate valve is fully open, there is an absence of obstruction in the flow path for the gate valve, which results in a very low-pressure loss, thus making it possible to use a pipe-cleaning pig.
Indusroof’s gate valve (Sluice valve), is a high-quality product suitable for any type of industrial setup, with high endurance and powerful performance capacity. The industrial gate valve is best suitable for,
- Refineries
- Petrochemical Industries
- Gas Processing Plants
It is suitable for most fluids along with steam, water, oil, and gas control.
Parametric study:
A parametric study that perturbs design variables in the product design model to explore design alternatives can effectively support product concept designs. A parametric study is simple and easy to perform as long as the mapping between CAD and simulation models has been established. The mapping supports fast simulation model generation for performance analyses. It also supports DSA using the finite difference method. The parametric study is possible for concept design because the number of design variables to perturb is usually small. A spreadsheet with a proper formula defined among cells is well suited to support the parametric study.
Mass flow rate:
The mass flow rate is the mass of a liquid substance passing per unit time. In other words, the mass flow rate is defined as the rate of movement of liquid pass through a unit area. The mass flow is directly dependent on the density, velocity of the liquid, and area of cross-section. It is the movement of mass per unit time. The mass flow is denoted by m and the units in kg/s.
m = `(rho *v)/A
where `rho`is density
v is velocity
A is area
Flow coefficient:
The flow coefficient of a device is a relative measure of its efficiency at allowing fluid flow. It describes the relationship between the pressure drop across an orifice valve or other assembly and the corresponding flow rate.
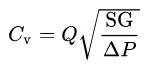
where Q is rate of flow ,
SG is specific gravity
`Deltap` is pressure drop.
Flow factor:
Flow factor is the flow of water with temperature ranging 5 - 30 oC through a valve in cubic meters per hour (m3/h) with a pressure drop of 1 bar. Represented by `K_v`
relation between flow factor and dlow coefficient `K_v and C_v`.
Kv = 0.862 Cv
Geometry:
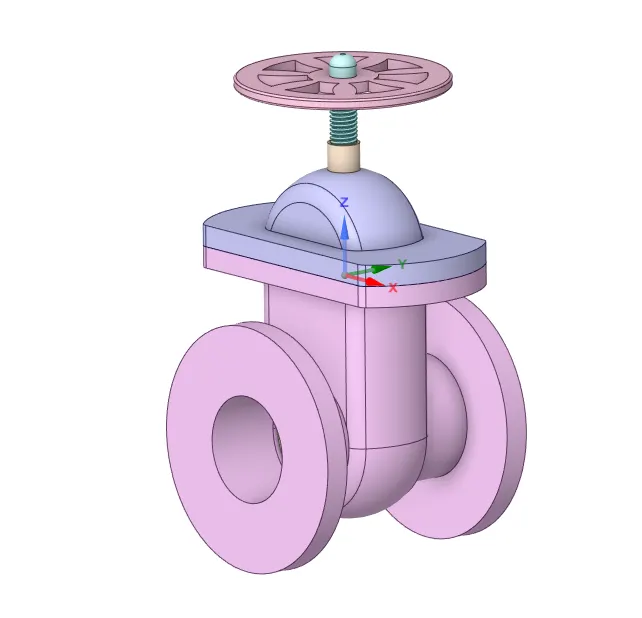
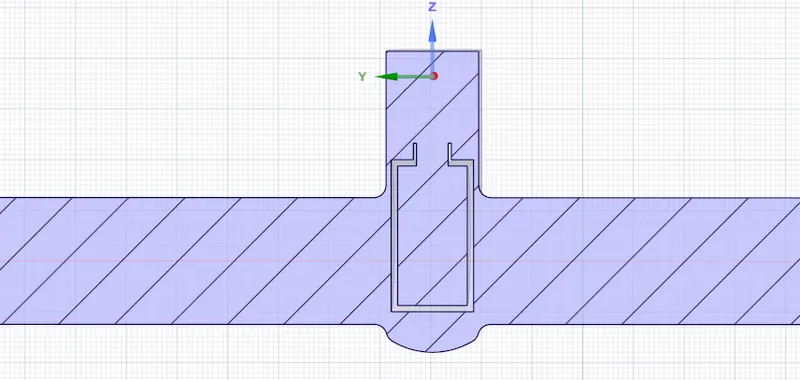
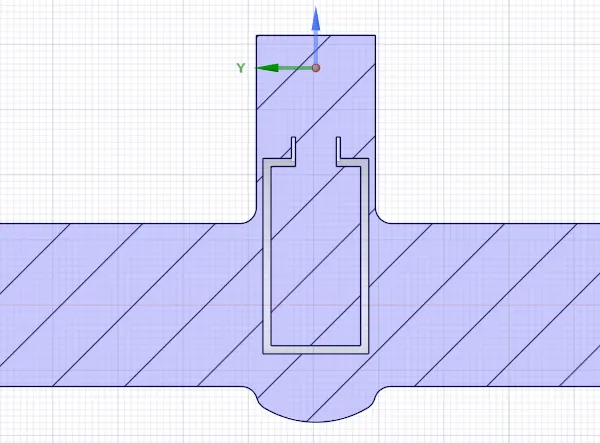
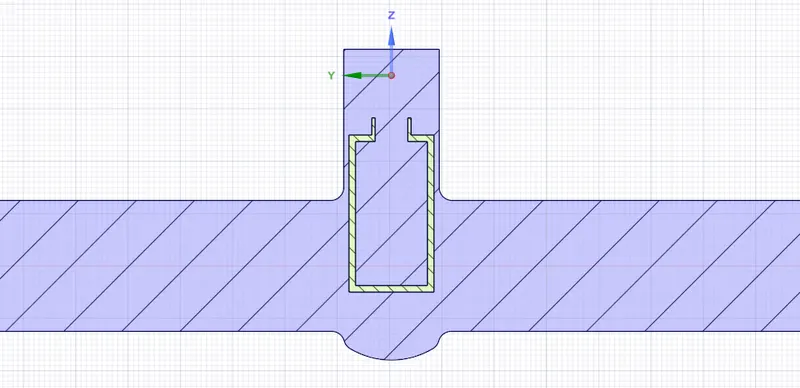
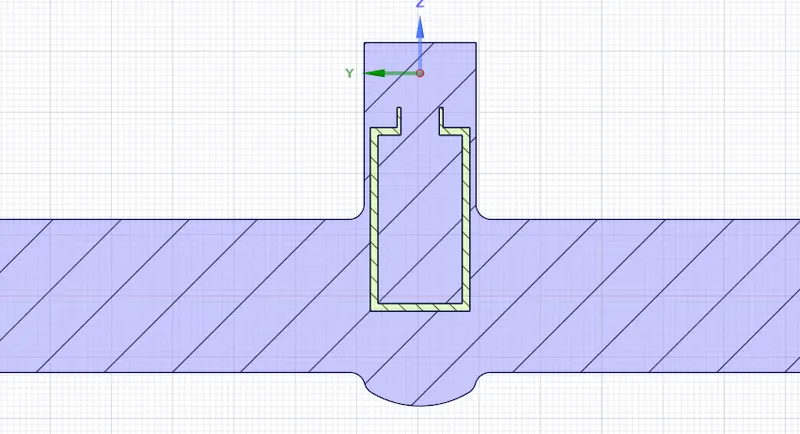
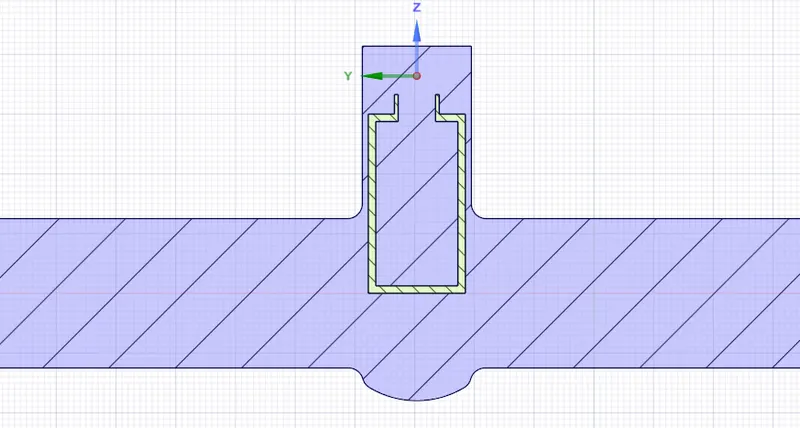
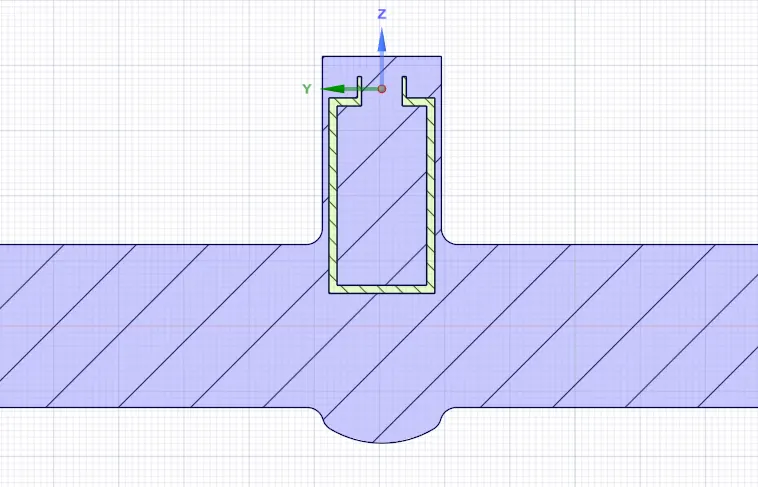
Use move tool to move the spindle up to 10mm in the z direction.
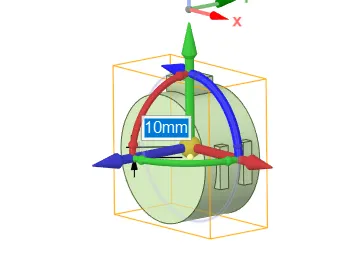
Use the pull to extrude the length of the bottom pipe at both inlet and outlet side by 800mm respectively.
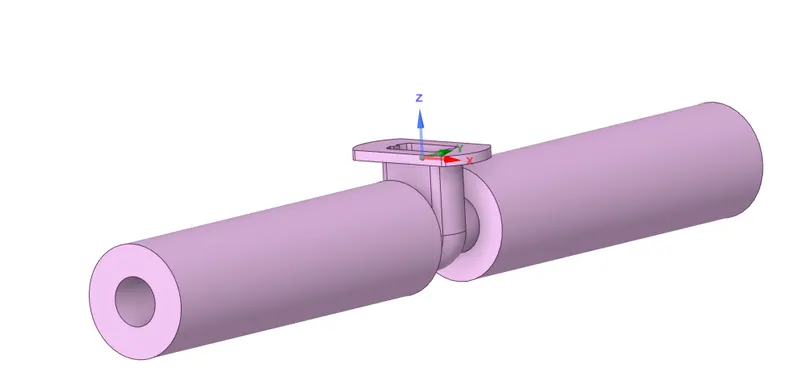
Use the volume extract from prepare and select the three edges to extract the fluid volume.
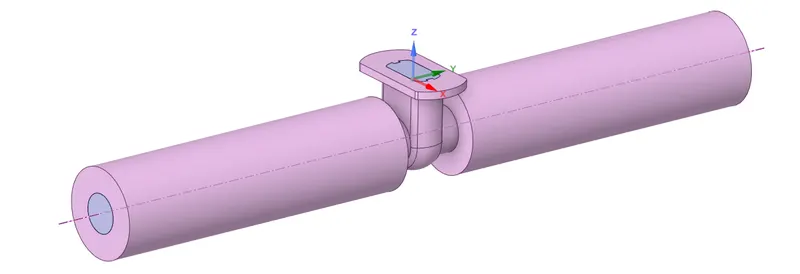
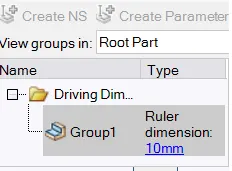
Create parameter in the group tab .
Update the volume body in context to update the enclosed fluid volume respective to current body.
Mesh:
Set the element size as 10mm.
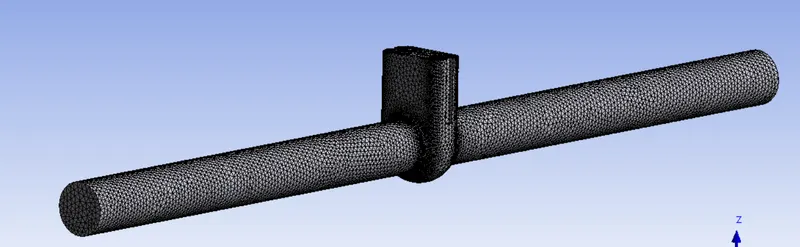
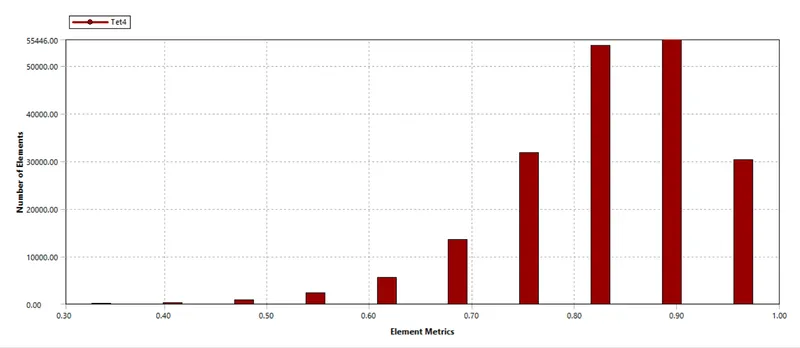

Create named selections inlet and outlet.
Fluent setup:
Steady state and pressure based solver gravity is turned on and negative g value is given.
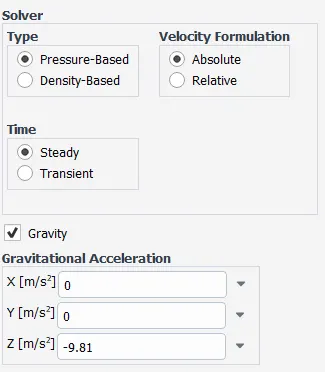
The velocity at the inlet is 0.1415488 m/s in Y direction by applying a pressure of 10Pa
`rho = 998`kg/m^3
V= 0.1415488 m/s
D=0.1m
Re =`(rho * V *nu)/D`
Re = 14087.14
here it is greater than 2000,so the flow is turbulent.
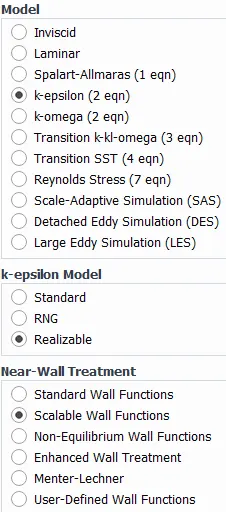
Select the k-epsilon ,realizable and scalable wall functions.
Create water from fluent database and delete the air and change the fluid as water in cell zone conditions.
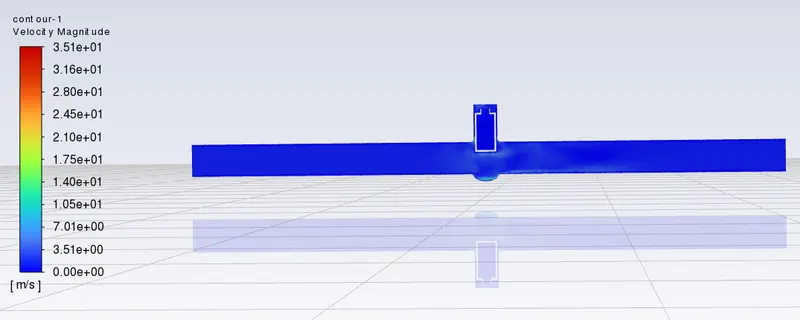
Standard hybridization from the inlet.For output create mass flow rate from flux report and create a plane on fluid volume to capture the velocity contour and create animation.
Results:
Disc lift at 10 mm:

Residuals:
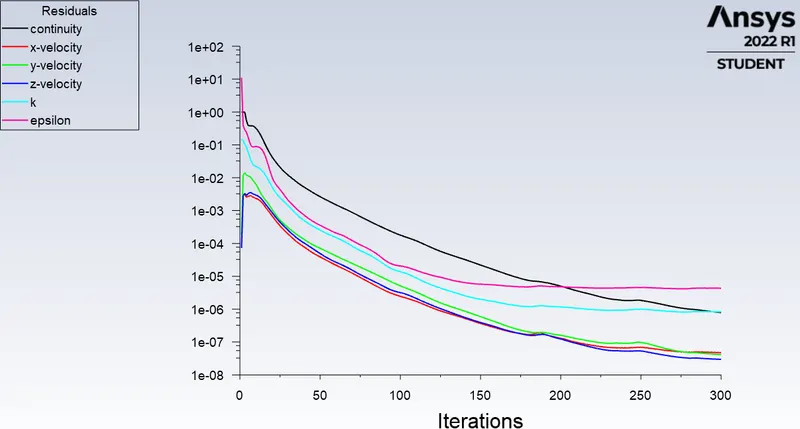
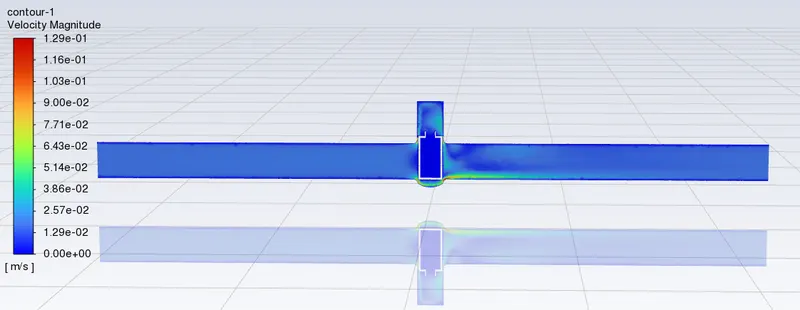
Velocity contour:
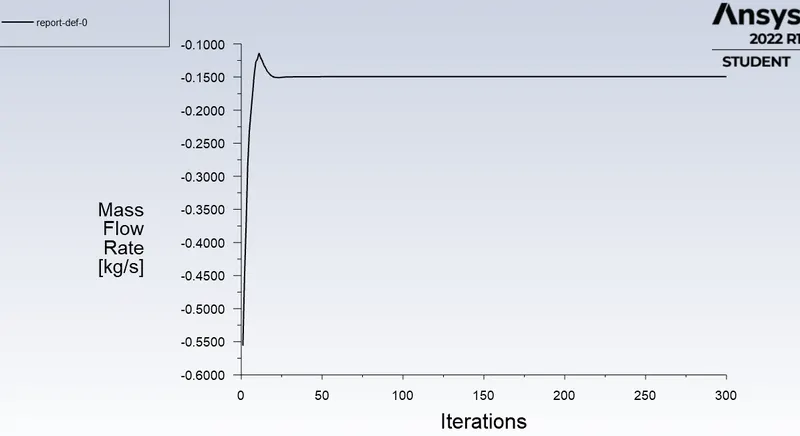
Mass flow rate:
disc lift at 20 mm:
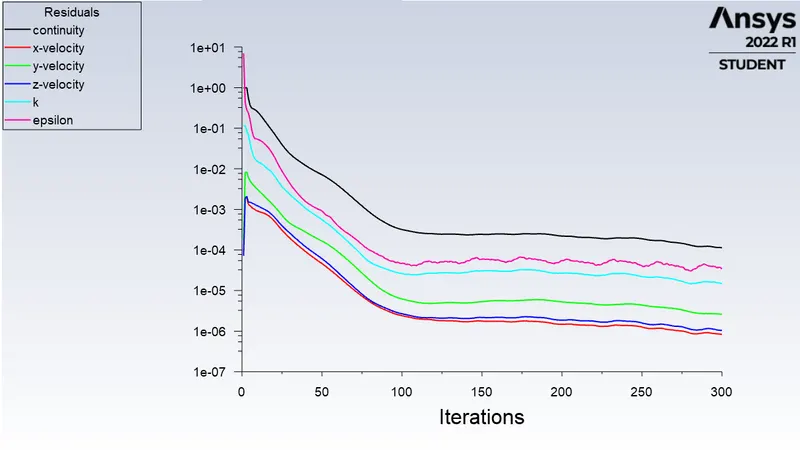
Residuals:
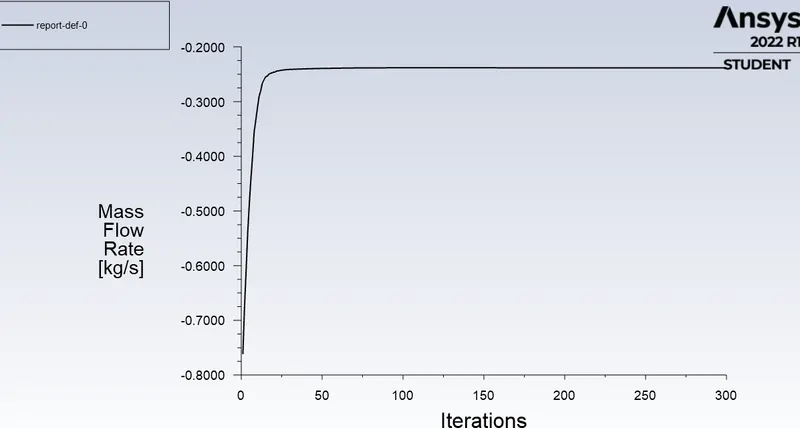
Mass flow rate:
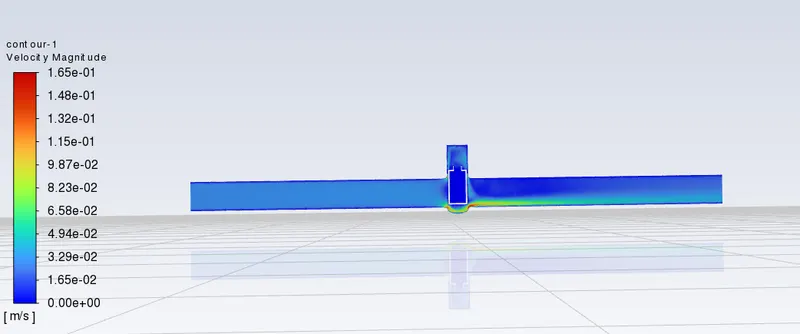
Velocity contour:
disc lift at 30mm:
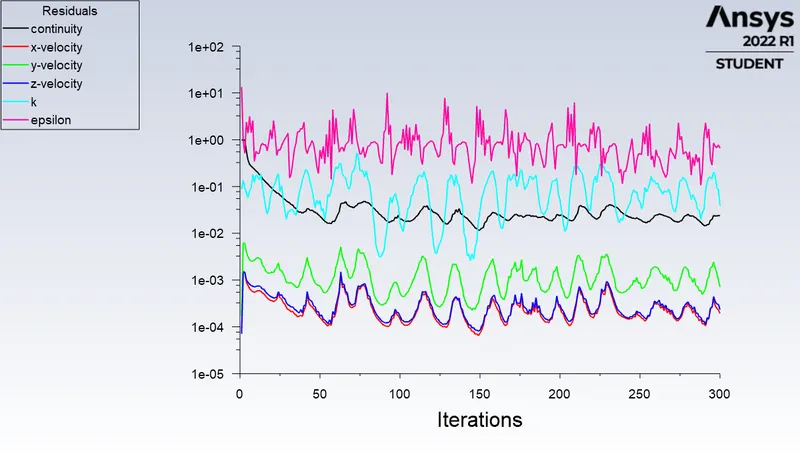
Residuals:
Mass flow rate:
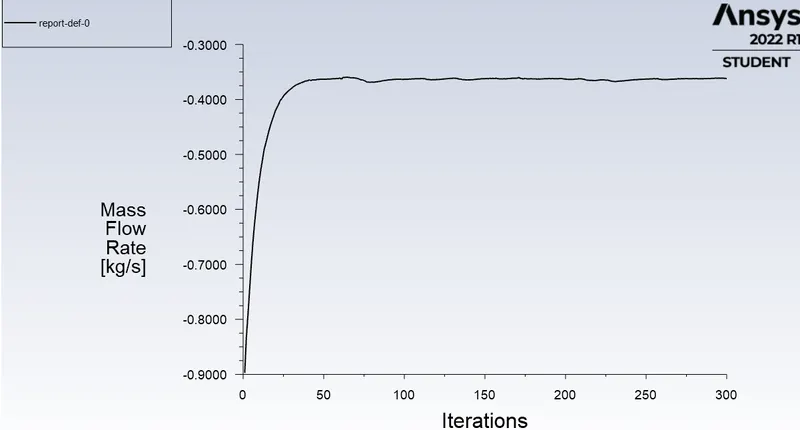
Velocity contour:
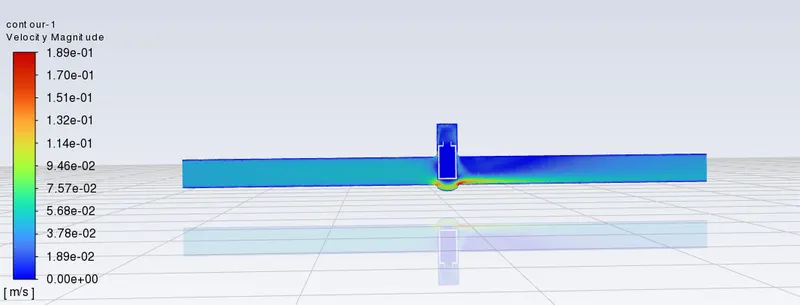
disc lift at 40 mm:
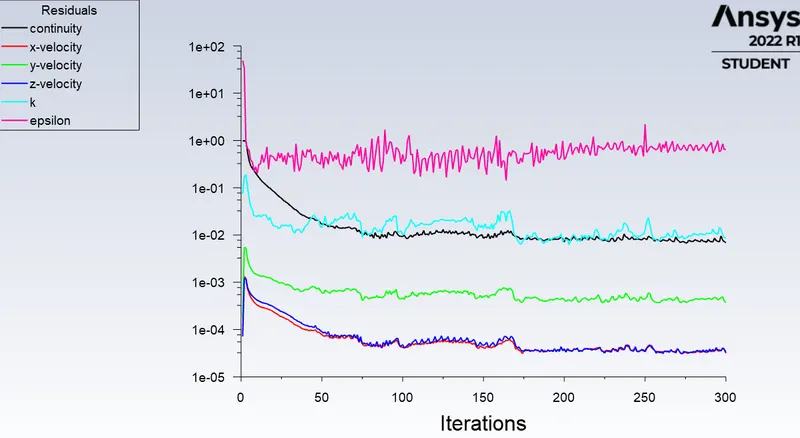
Residuals:
Mass flow rate:
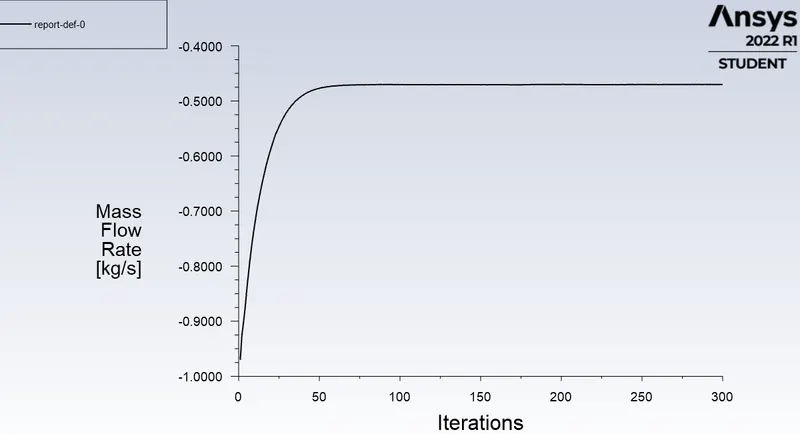
Velocity contour:
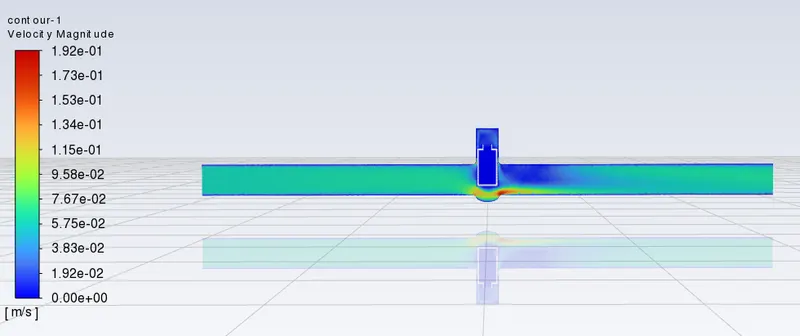
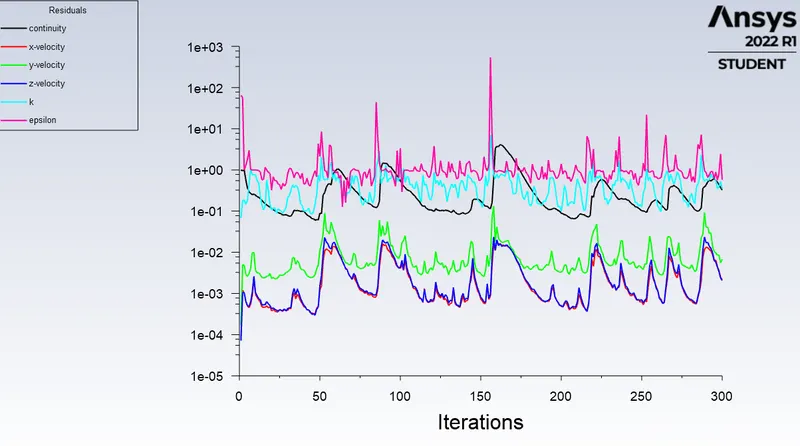
disc lift at 50 mm:
Residuals:
Velocity contour:
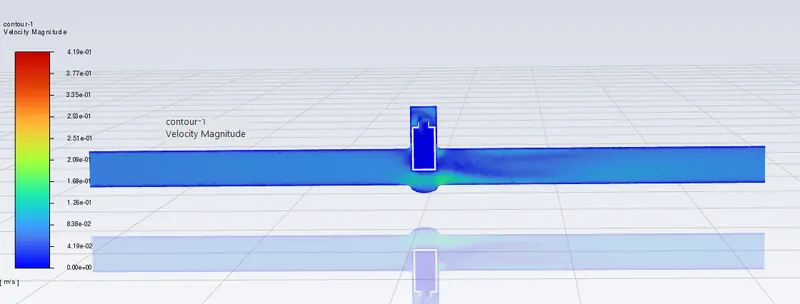
disc lift at 60 mm:
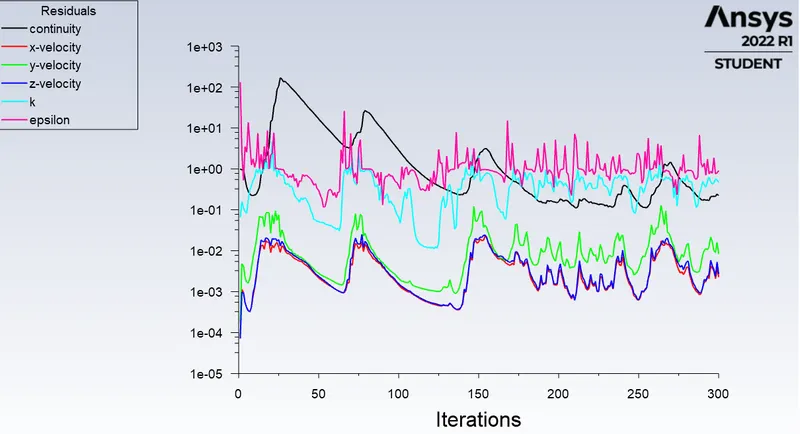
Residuals:
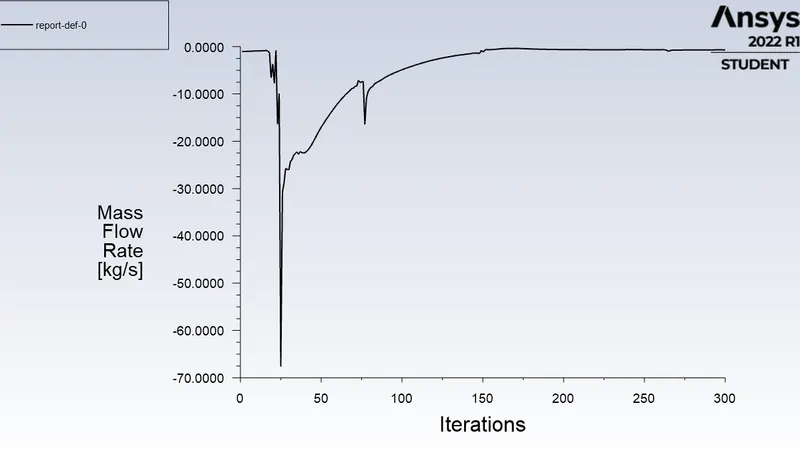
Mass flow rate:
Velocity contour:
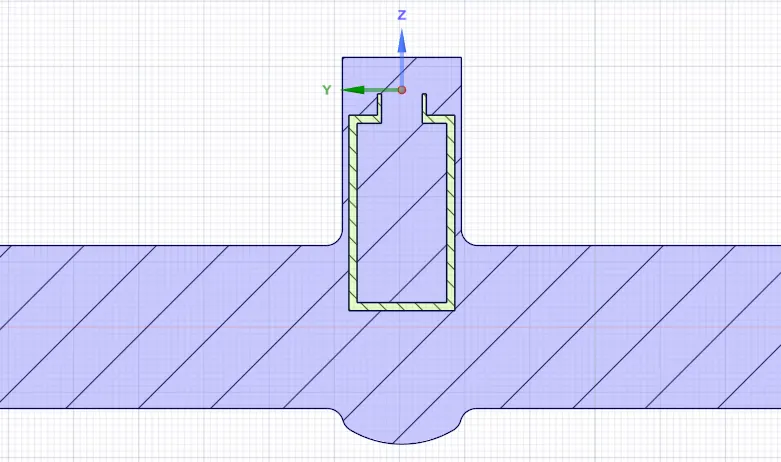
disc at lift 70mm:
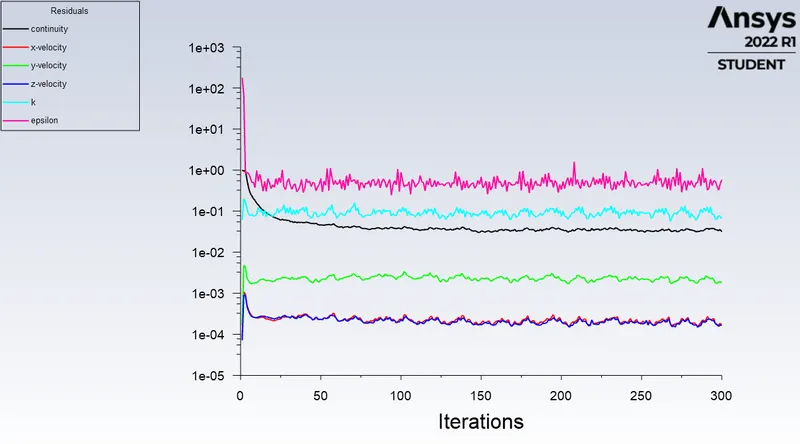
Residuals:
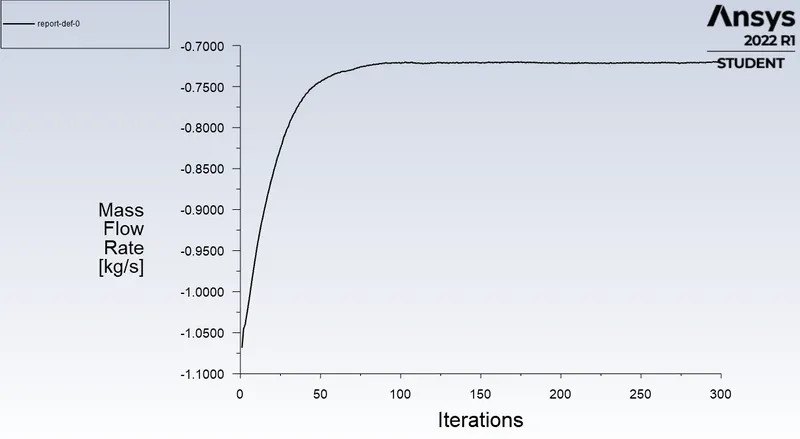
Mass flow rate:
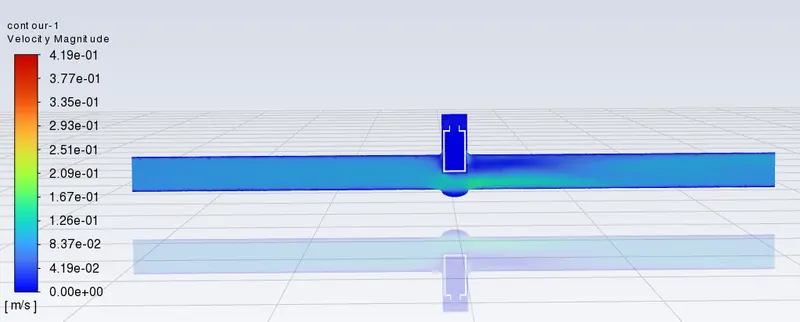
Velocity contour:
disc lift at 80 mm:
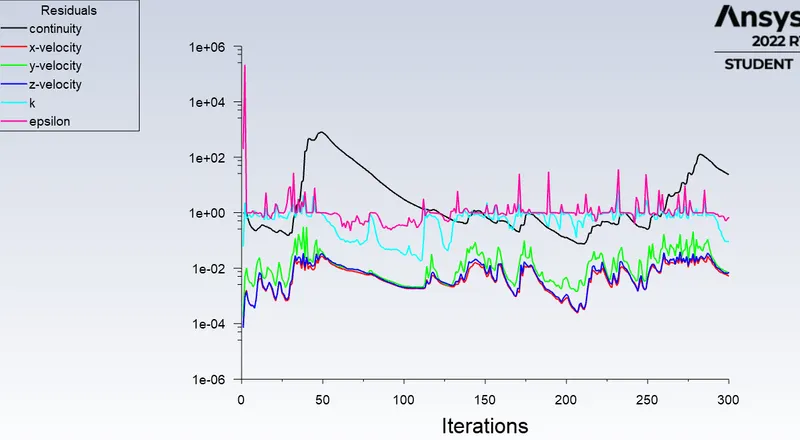
Residuals:
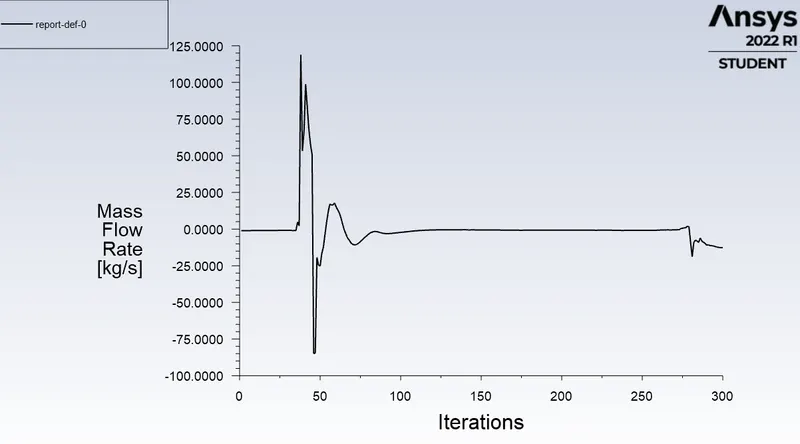
Mass flow rate:
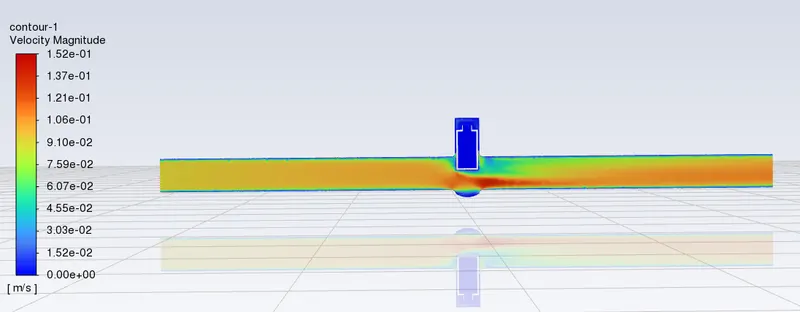
Velocity contour:
Tables and inferences:
The pressure drop is taken as 10Pa since the outlet pressure is small and if converted to psi from pascal is negligible so the pressure drop is taken as 10Pa
Here I converted the mass flow rate from kg/s to gal/min for Cv calculation and m^3 /hr for Kv calculation respectively.
1kg/s = 22.23 gal/min
10 Pa =0.00145038psi
| Disc lift | Mass flow rate (kg/s) | Mass flow rate (m^3/hr) | Cv (gal/min psi) | Kv (m^3/hr bar) |
| 10 mm | -0.1489 | 0.54 | 86.75 | 54 |
| 20 mm | -0.23846 | 0.86 | 138.91 | 86 |
| 30 mm | -0.35958 | 1.29 | 209.9 | 129 |
| 40 mm | -0.47014 | 1.69 | 274.36 | 169 |
| 50 mm | -0.56407 | 2.03 | 329.28 | 203 |
| 60 mm | -0.66391 | 2.39 | 387.5 | 239 |
| 70 mm | -0.71957 | 2.59 | 420.05 | 259 |
| 80 mm | 0.66142 | 2.38 | 386.11 |
238 |
Conclusion:
1.The negative sign in the mass flow rate is because of the mass outlet.
2.Parametric study helps to reduce the solving time in studying the changing parameter of the system.
3.From the graphical analysis we can conclude that by increasing the gate lift , increased in mass flow rate is obtained.the pressure drop decreases.
4.As the lift of the disc increases,the flow coefficient and flow factor increases.