Week 9 - Parametric study on Gate valve.
Parametric study on Gate valve
Aim
To perform a parametric study on the given model of gate valve by varying the opening from 10% to 80% and performing the following calculations:
- To obtain the mass flow rates at the outlet for each design point.
- To calculate the flow coefficient and flow factor for each opening and plot the graph.
- To discuss the results of the mass flow rate and flow coefficient.
Theory
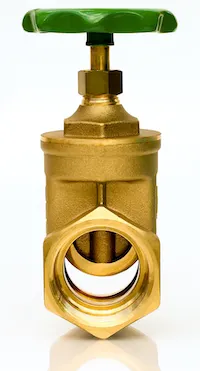
A gate valve is a control valve that either allows media to flow through unobstructed or stops the fluid flow. The main advantage of a gate valve is the straight-through unobstructed passageway, which induces minimal pressure loss over the valve. The unobstructed bore of a gate valve also allows for a pig's passage in cleaning pipe procedures, unlike butterfly valves. However, gate valves are slower than quarter-turn valves and should only be used in the fully open or closed position, not to regulate the flow. Automated gate valves exist with either an electric or pneumatic actuator, but a manual gate valve is cost-effective since gate valves are typically used infrequently. Gate valves are also commonly referred to as sluice gate valves.
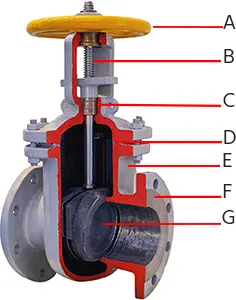
A gate valve has seven main parts, which can be seen in Figure 3, which are: handwheel (A), stem (B), gasket (C), bonnet (D), valve body (E), flange (F), and gate (G). A flanged gate valve or threaded gate valve is the most common connection type to connect the valve to an application. In addition, depending on the specific design and application, the handwheel, stem, bonnet, and gate can have different designs to accommodate different applications. However, the main function of the gate valve parts remains the same. Continue reading to find those sections.
A gate valve operates similar to other valves. To open the valve, turn the handwheel (A), which moves the gate (G) up or down on the stem (B) via the threads. A gate valve requires more than one 360° turn to open or close the valve fully. When the gate is lifted up, it opens the inlet to the outlet allowing an unobstructed passageway for the media to flow. When the gate is lowered, it closes and blocks the media flow.
The relationship between the gate's vertical travel and the flow rate is nonlinear for a gate valve, with the greatest changes occurring near-complete closure. When used to regulate flow, the relatively high velocity of the flow at partial opening results in gate and seat wear, which along with possible vibrations of the gate, shortens the valve's service life. Therefore, a gate valve should only be used for on/off control.
Flow coefficient,`underset(v)(C)`=`Q*sqrt((SG)/(Deltap))`
where Q->volumetric flowrate
SG->specific gravity of the liquid
Deltap->change in pressure
Flow factor=flow coefficient/1.156
Procedure
The procedure involves extracting the fluid volume from the solid, then parametrizing the opening of the gate from 10% of its length to 80%of its length and saving the file.
This is followed by meshing the geometry and giving named selections as inlet and outlet respectively. Save the mesh and exit.
The next step is to setup the given value in fluent. Choose the entire zone to be flowing with water. Give boundary conditions as 10Pa (inlet BC-pressure inlet) and create an animation for the flow visualization. Create an output parameter(namely pressure at inlet, mass flow at outlet and pressure at outlet) so as to compare data
Once that is done, click on parameter tab and click on "Retain Data" so that the solution is run for different values of the parameter.
Geometry
First, the fluid volume is extracted by clicking on Prepare->Volume extract and extract it. The next step is to move the gate by 10mm. This is achieved by using the move option in the design tab.
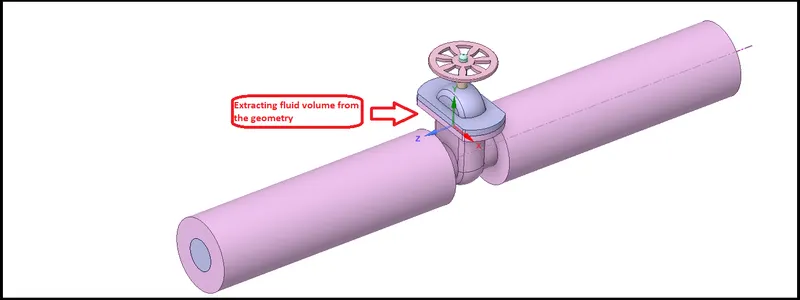
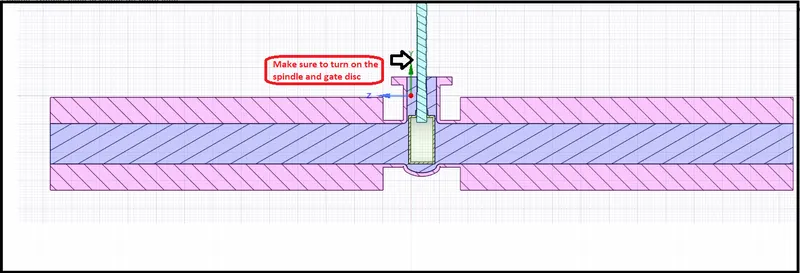
Once that is done, go to groups-> create parameter and click on the dimension. Make sure to turn on the spindle and the gate valve as well. In the volume tree, right click and select update at the current context. The cross section should resemble the analysis. Close spaceclaim.
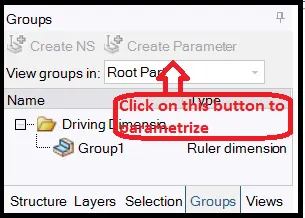
Next step is meshing. This involves meshing the geometry(fluid zone) and viewing a section so as to check. The mesh is coarse. Create named selections as the inlet and the outlet. Update

The next step is to setup the fluent solver. Specify the following:
Viscous model-K-epsilon turbulence model
Fluid in all cellzones-water
Inlet conditions-pressure inlet of 10Pa gauge pressure
Once everything is done, click on reports-definitions and create three output parameters(inlet pressure,outlet pressure,outlet mass flow rate). These will be the outlet parameters as shown
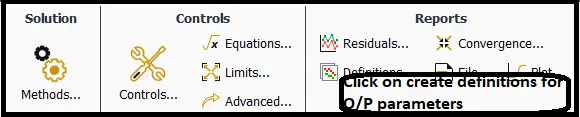
This step is for carrying out parametric study. Note that the input and output parameters are specified in the box.
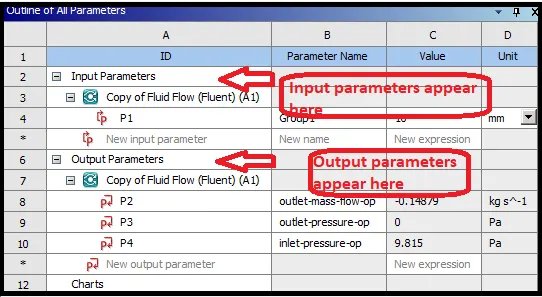
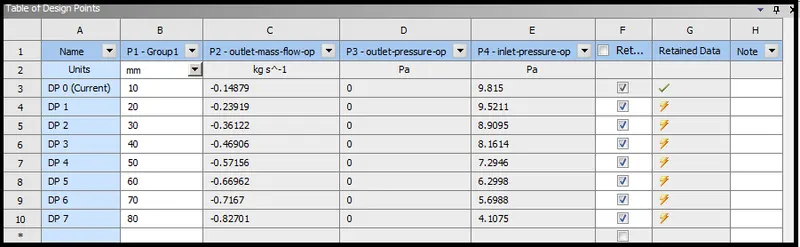
Enter the value of the gate opening valve and select all the point and right click to select update the design points. Once done, we will be able to see all the values as shown below.
Results
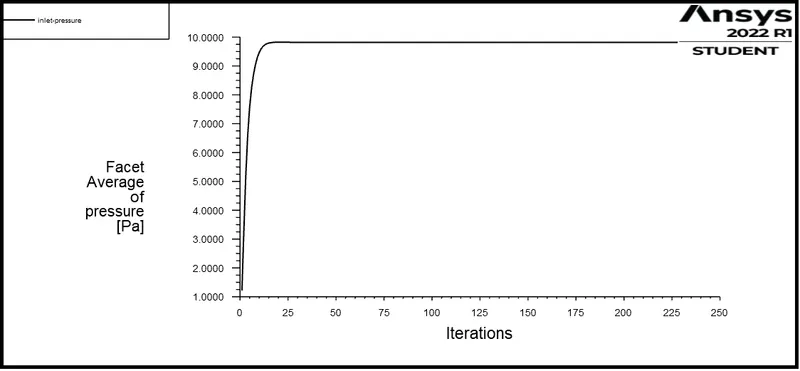
Convergence of inlet pressure
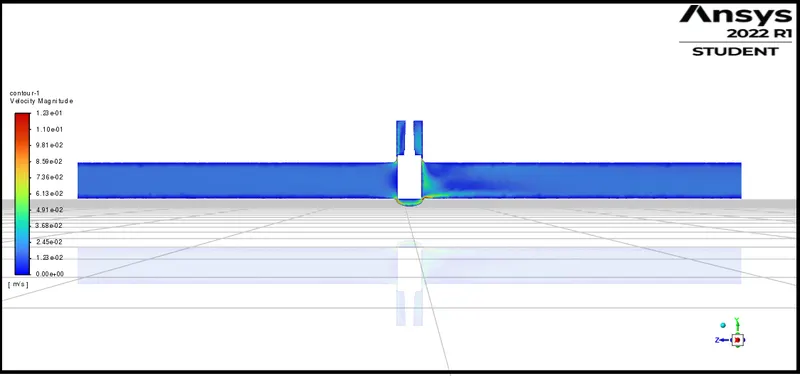
Velocity contour at a section plane
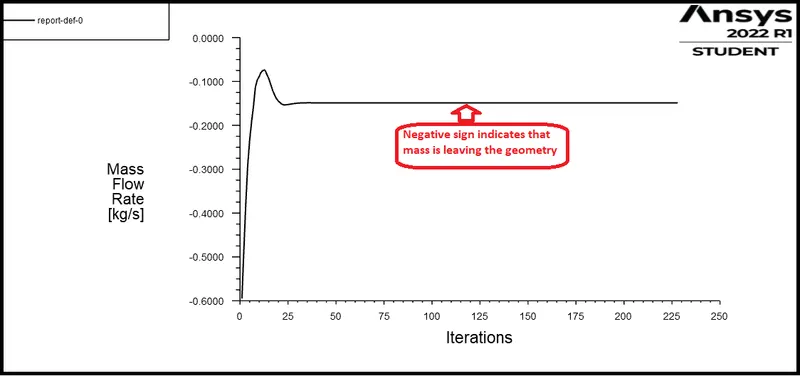
Convergence of outlet mass flow rate
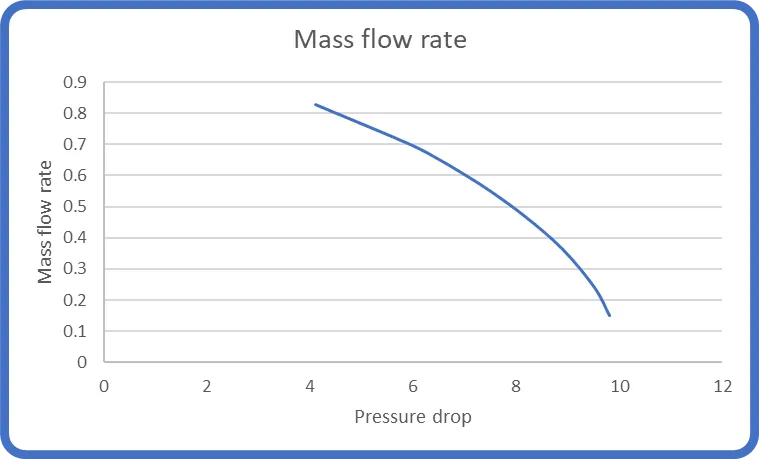
Variation of mass flow rate with pressure drop
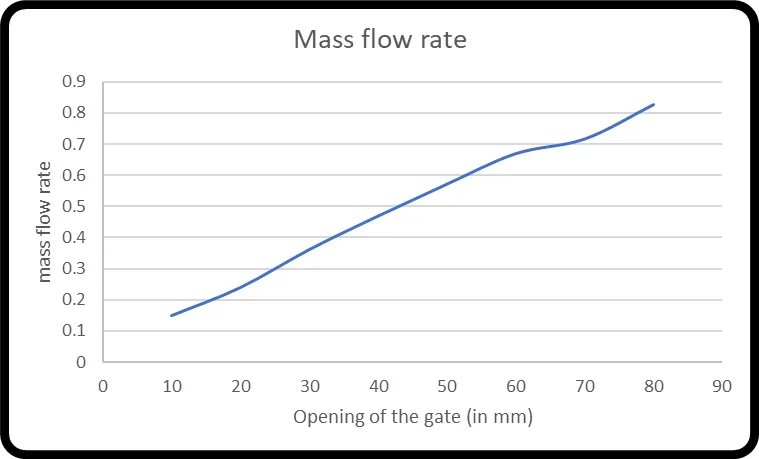
Variation of mass flow rate with the opening of the gate
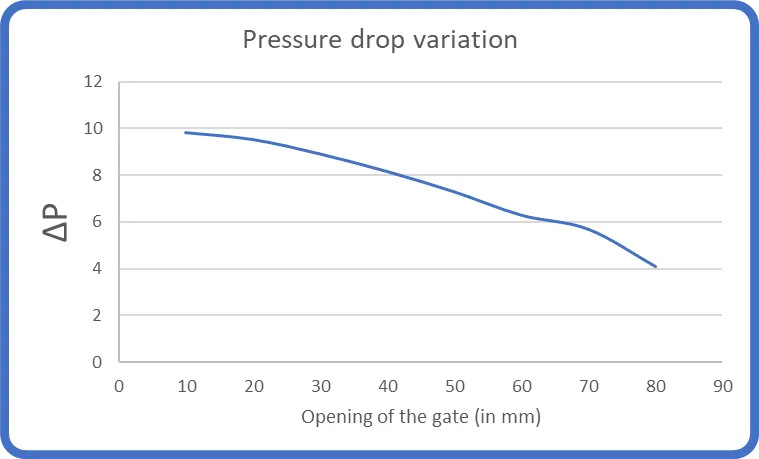
Variation of pressure drop with opening of the gate valve
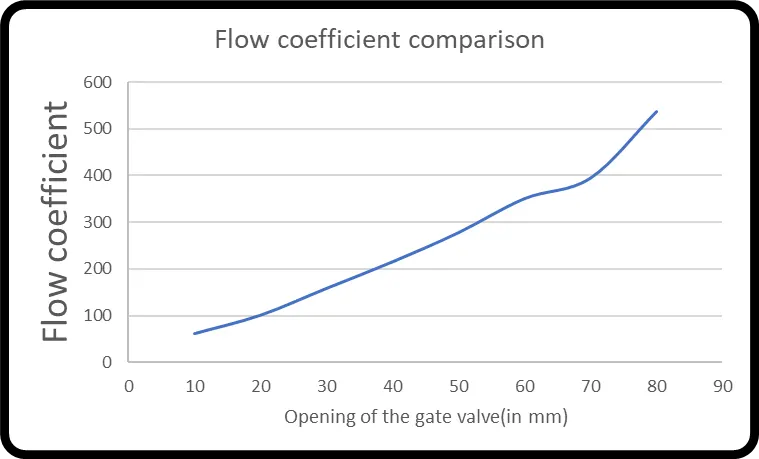
Variation of flow coefficient with opening of the gate valve
| Opening of gate valve | mass flow rate at the outlet | outlet pressure(in Pa) | Inlet pressure(in Pa) | ΔP | Flow coefficient | Flow factor |
| 10 | -0.14879 | 0 | 9.81504 | 9.81504 | 62.51130448 | 54.07552291 |
| 20 | -0.23919 | 0 | 9.521051 | 9.521051 | 102.0362364 | 88.26664046 |
| 30 | -0.36122 | 0 | 8.909526 | 8.909526 | 159.2896617 | 137.793825 |
| 40 | -0.46906 | 0 | 8.161403 | 8.161403 | 216.1201225 | 186.9551233 |
| 50 | -0.57156 | 0 | 7.294598 | 7.294598 | 278.5506781 | 240.9607942 |
| 60 | -0.66962 | 0 | 6.299825 | 6.299825 | 351.1661055 | 303.7769079 |
| 70 | -0.7167 | 0 | 5.6988 | 5.6988 | 395.1755876 | 341.8473941 |
| 80 | -0.82701 | 0 | 4.107533 | 4.107533 | 537.1151884 | 464.6325159 |
Discussions
- Here, we see that as the difference between inlet and outlet pressure increases, the mass flow rate increases. This is due to the fact that in order for flow to happen, there should naturally exist some pressure gradient across the gate valve.
- When we open the gate, the mass flow of water increases, which is evident from the above graph.
- Note that the value of mass flow rate at the exit has a negative sign. This is due to the fact that the mass is leaving the geometry.
- When the gate valve is fully locked on, the pressure on one side is very high and on the other side is very low. Once tha valve is opened slightly, the pressure buildup on one side eases and hence pressure drop value approaches zero as the opening of the valve is larger.
- The flow coefficient of the valve increases as the opening of the valve increases. Recall that Valve Flow Coefficient (Cv) is the flow capability of a control valve at fully open conditions relative to the pressure drop across the valve. It is defined as the volume of water that will flow through a fully open valve with a pressure differential of 1 psi across the valve.
- Here, the flow coefficient is calculated by considering flow rate in gallons per minute(1 kg/s=15.85 gal/min) and pressure in psi(1Pa=0.000145 psi)
- The flow factor of the valve increases as the opening of the valve increases.