Week 9 - Parametric study on Gate valve.
Aim
Perform a parametric study on the gate valve simulation by setting the opening from 10 % to 80%.
Objectives
- Obtain the mass flow rates at the outlet for each design point.
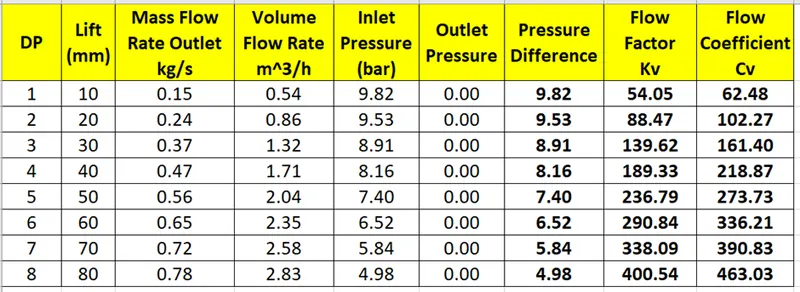
- Calculate the flow coefficient and flow factor for each opening and plot the graph.
- Discuss the results of the mass flow rate and flow coefficient.
Introduction
Parametric Study
A parametric study is the study of the influence of different geometric or physical parameters or both on the solution of the problem. It is an important tool in design exploration, for example, to examine the influence of gate valve opening on the mass flow rate of the fluid flow.
It also reduces the time and effort needed to be taken to set up the simulation.
Gate Valve
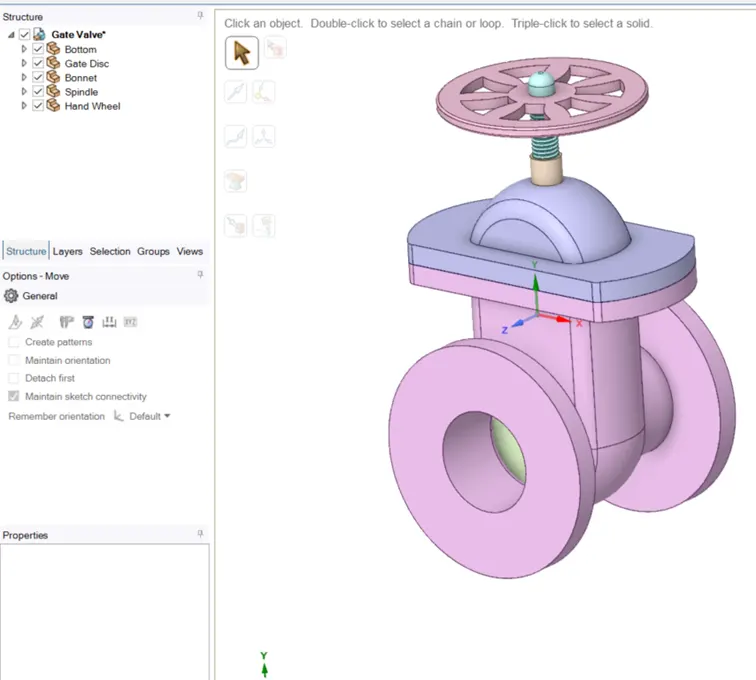
A gate valve is a device that is used in a pipe flow to start or stop the fluid flow. It is operated by lifting a barrier out of the path of the fluid. When it is in a closed condition, it blocks all the fluid to flow. When it is fully opened, there will be no obstruction in the fluid path, resulting in very low flow resistance. Depending on the position of the gate valve the flow rate will change.
Flow coefficient
The flow coefficient of a device is a relative measure of its efficiency at allowing fluid flow. It describes the relationship between the pressure drop across the valve and the corresponding flow rate. It is measured in US gallons.
In other words, the flow coefficient (in US gallons) is the volume of water at 60 (15 that will flow through a valve with a pressure drop of 1 psi (6.9kPa) across the valve.
`C_v=Q√(SG⁄∆P)`
Where,
Q = Flow rate in US gallons (GPM)
SG = Specific gravity of the fluid.
`∆P`= The pressure drop across the device (psi).
Here in this project, the variation of mass flow rate with the gate opening is studied in detail with the help of a parametric study in Ansys Fluent.
Flow factor
The flow factor is the metric equivalent of the flow coefficient.
`K_v=Q√(SG⁄∆P)`
Where,
Q = Flow rate in `m^3⁄h`
SG = Specific gravity of the fluid.
`∆P`= The pressure drop across the device in BAR
Methodology
- Pre-processing
Model creation
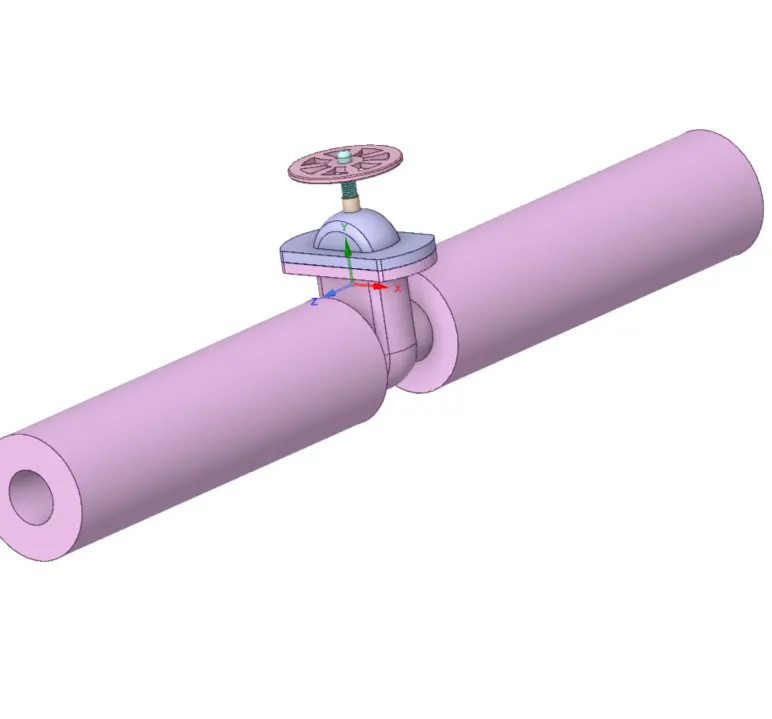
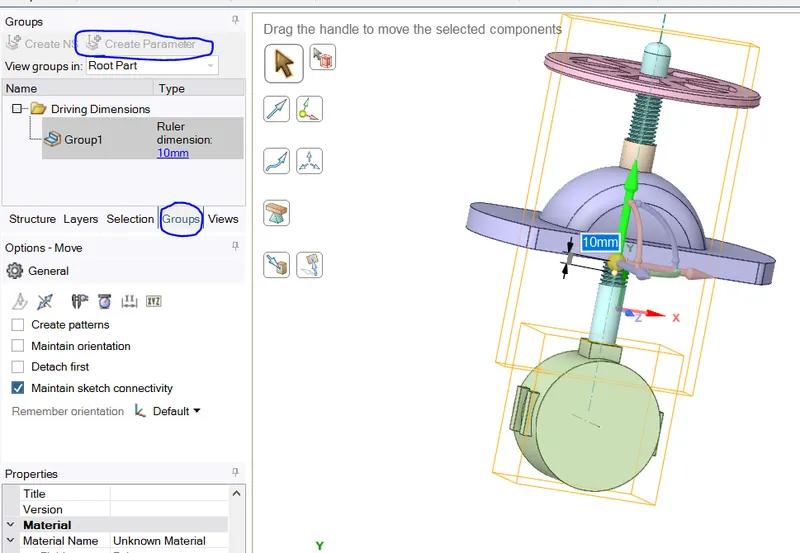
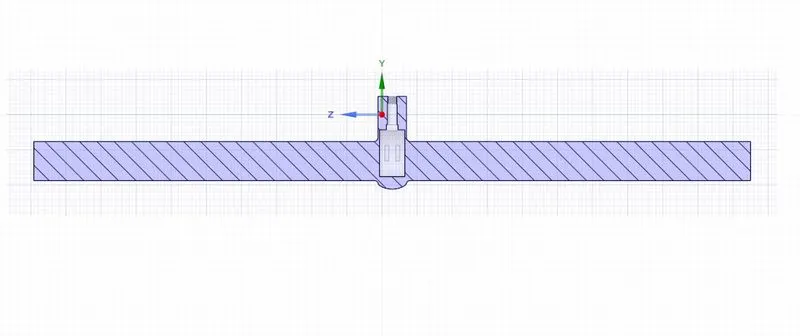
Open ANSYS Spaceclaim and import the 3d model of the Gate valve. After importing the model, both the inlet and outlet are pulled 800mm. The lift distance is set as a design parameter. The following steps were carried out to create a parameter.
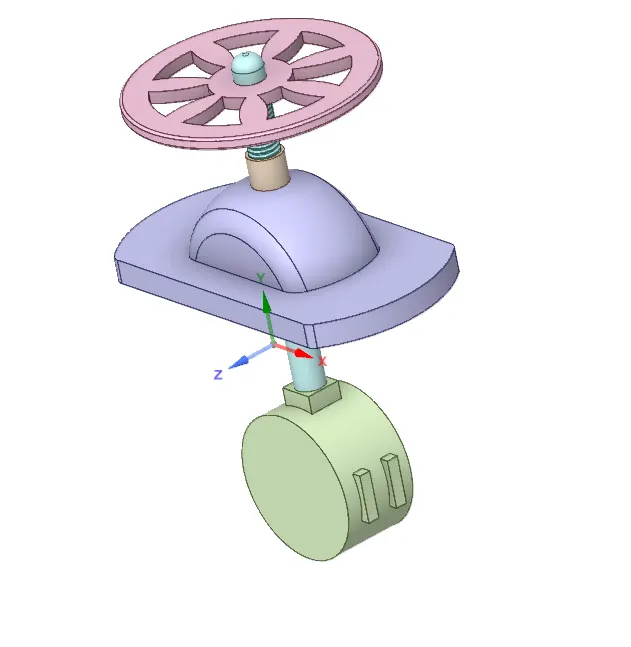
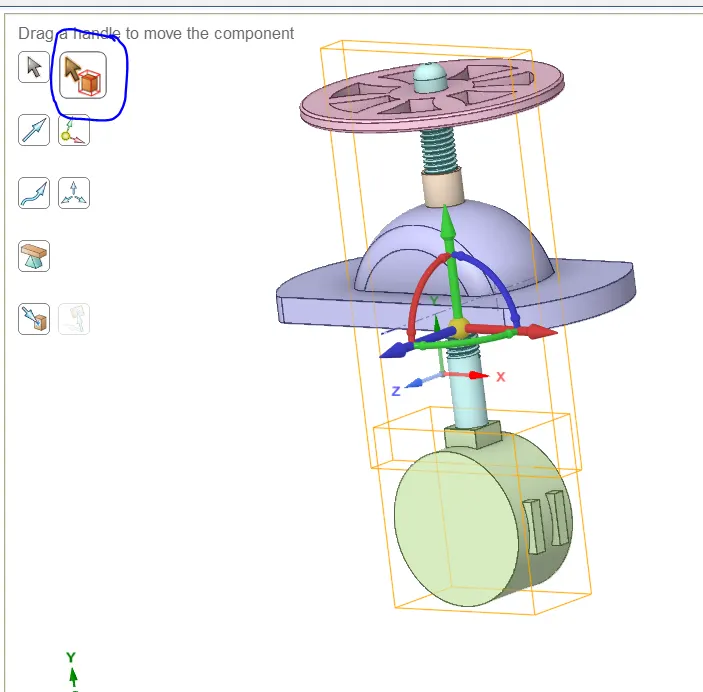
Hide the bottom part to see the gate disc. Now go to design, and click on move. Click on the component selector and select the gate disc and spindle. Drag the up arrow to move it up. This dimension is our design parameter. Enter 10mm (10 percent open) as distance and click on create parameter from the groups, which is located on the left pane. Now the parameter is set.
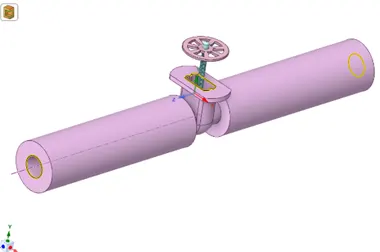
After creating the parametric point, the fluid volume is extracted from the domain. Unhide all the components and hide the Bonnet to extract the fluid volume.
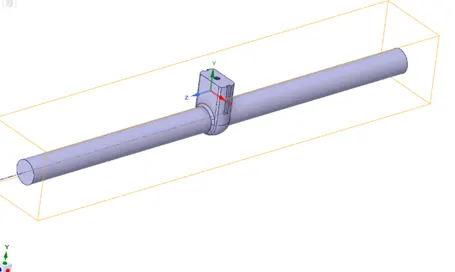
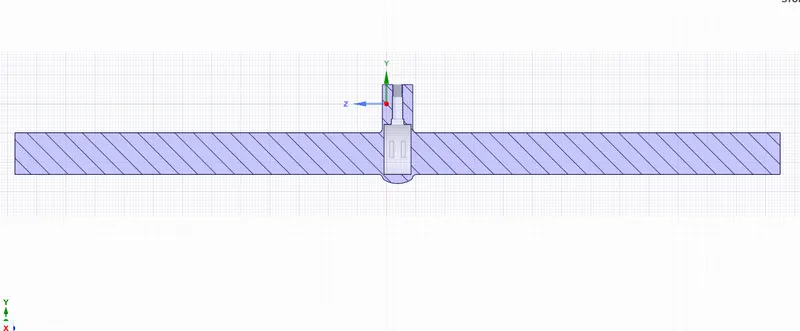
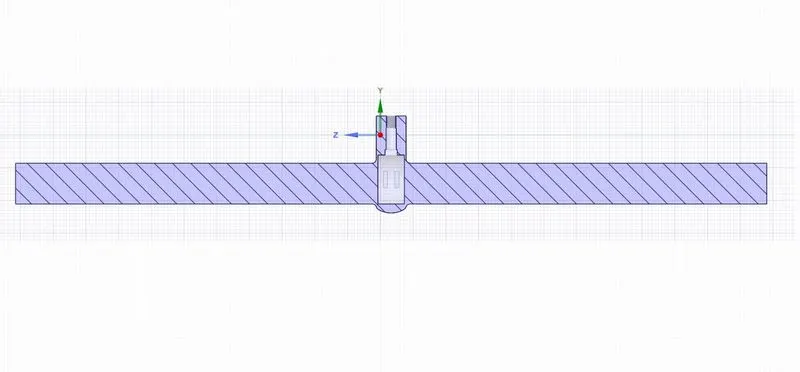
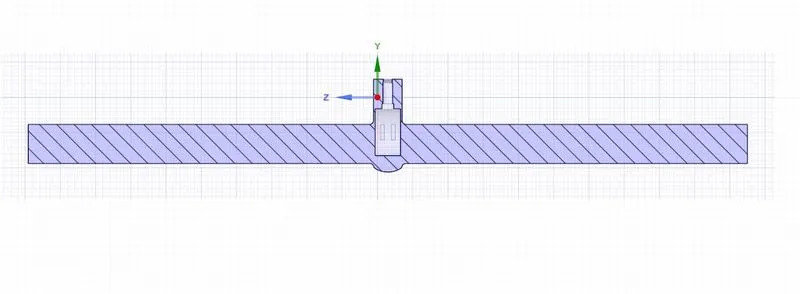
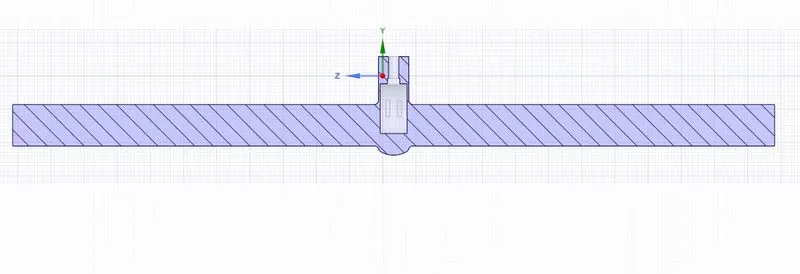
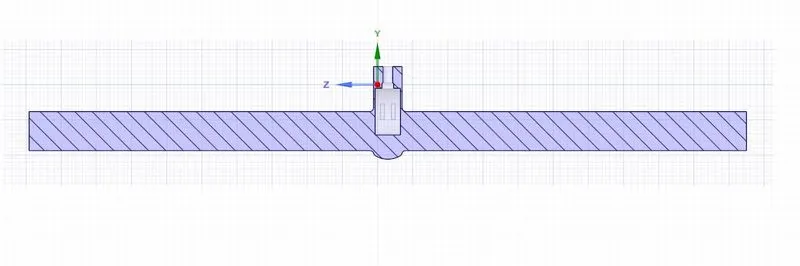
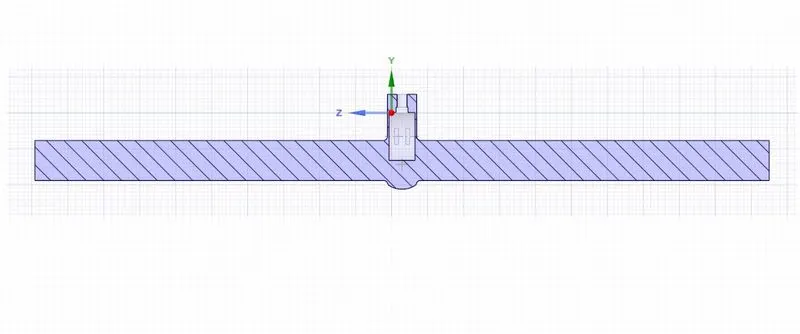
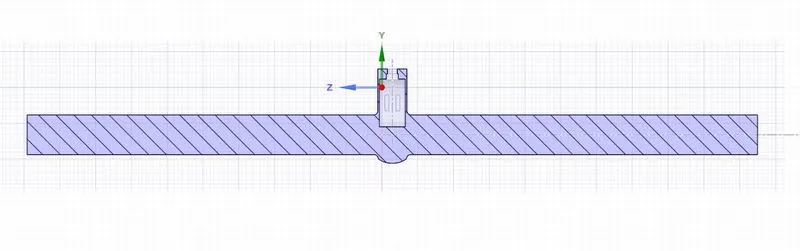
The cross-section of the fluid domain will look as shown below. Note that the gate disc is lifted 10mm.
Close the Spaceclaim and open meshing.
Meshing
In order to identify the inlet and outlet, both are named as shown below.
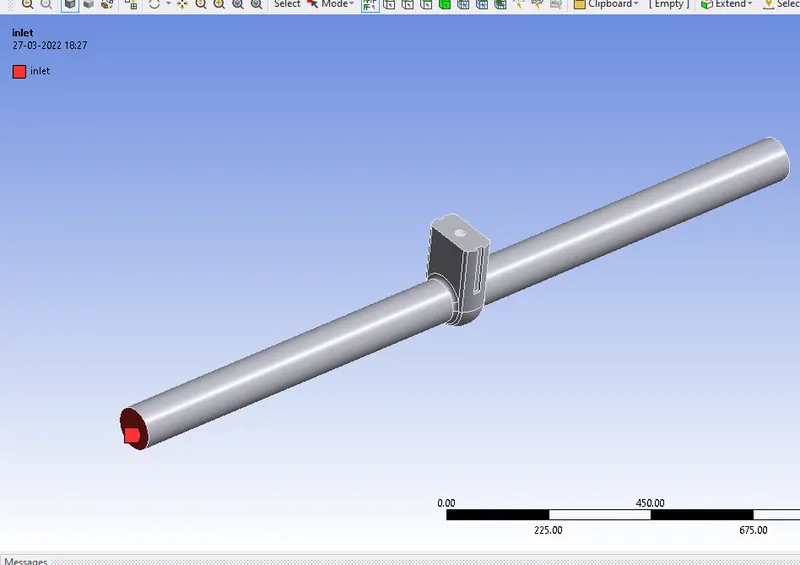
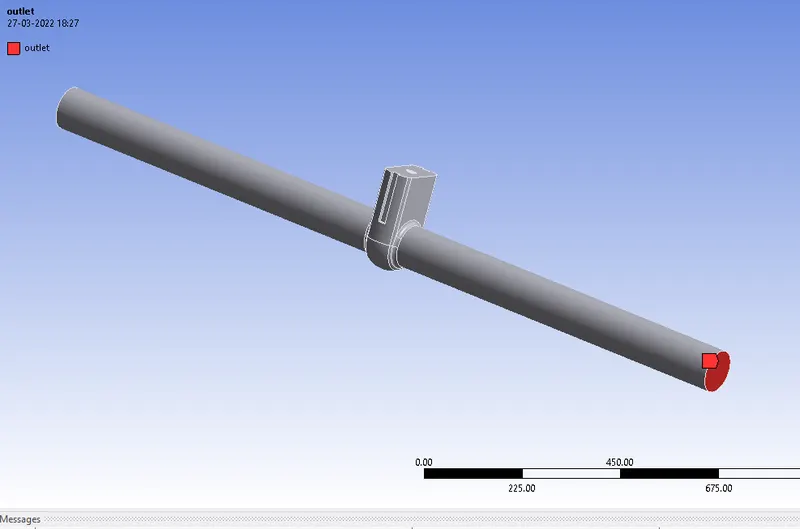
We will be doing a standard meshing with an element size of 6mm.
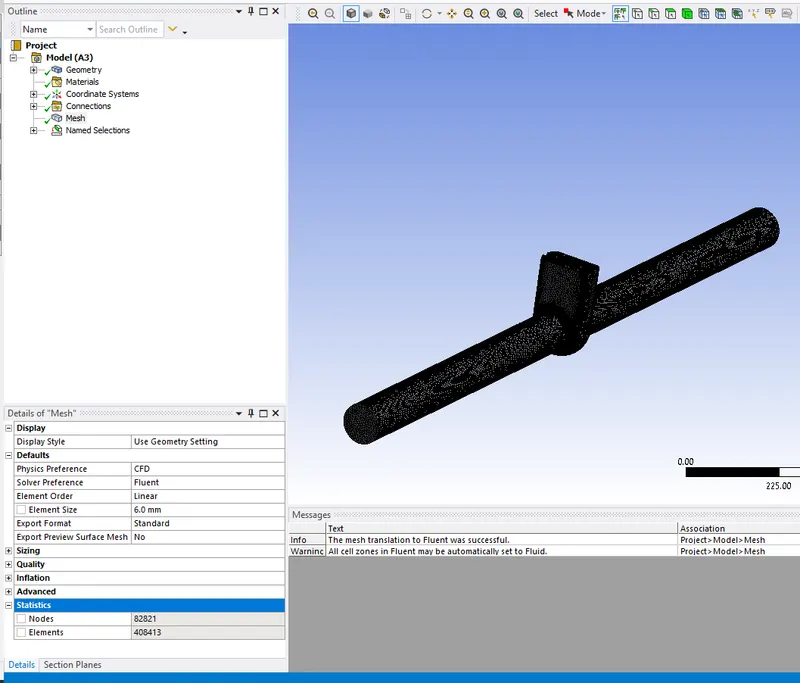 Total number of elements = 408413
Setting up the problem
Here we setup the problem by applying relevant
- Initial conditions
- Boundary conditions
- Material properties
- Turbulence Models
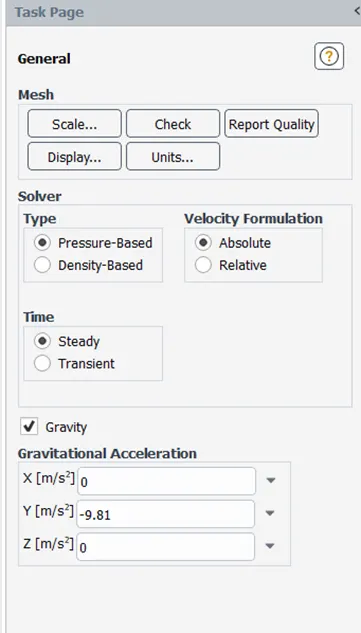
We will be doing a steady-state pressure-based analysis with gravity =9.81`m/s^2`
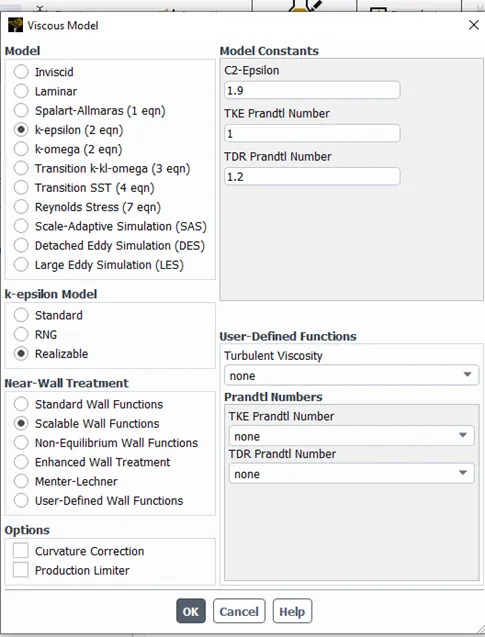
The viscous model is k-epsilon with a realizable model and scalable wall treatment.
The working fluid is Water
Hence the working fluid is water, water is taken from the fluent database by going in to create/edit material.
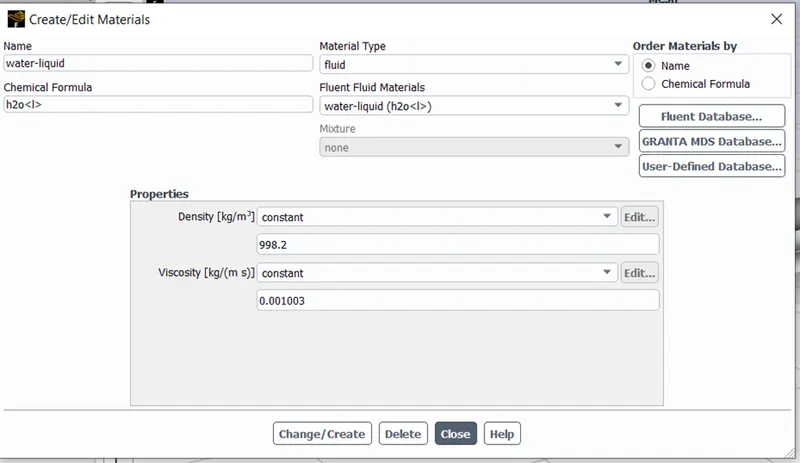
Material: Water
Density: `998.2 (kg)/m^3`
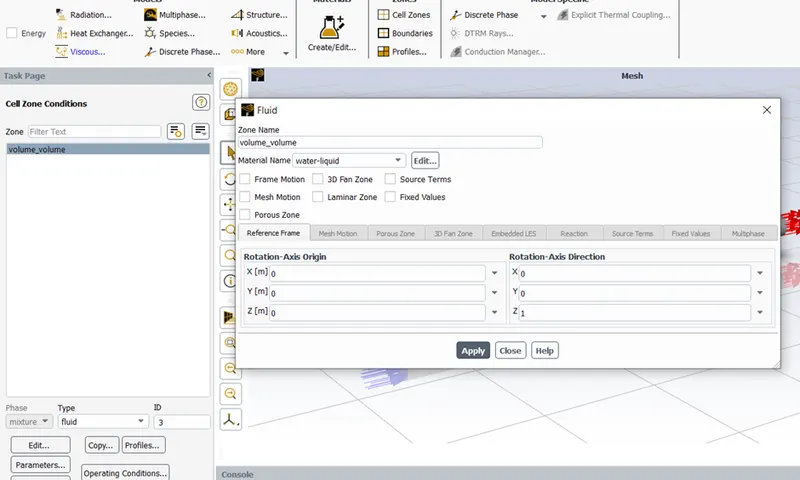
After this water is assigned as a working fluid by going into the cell zone
Boundary condition
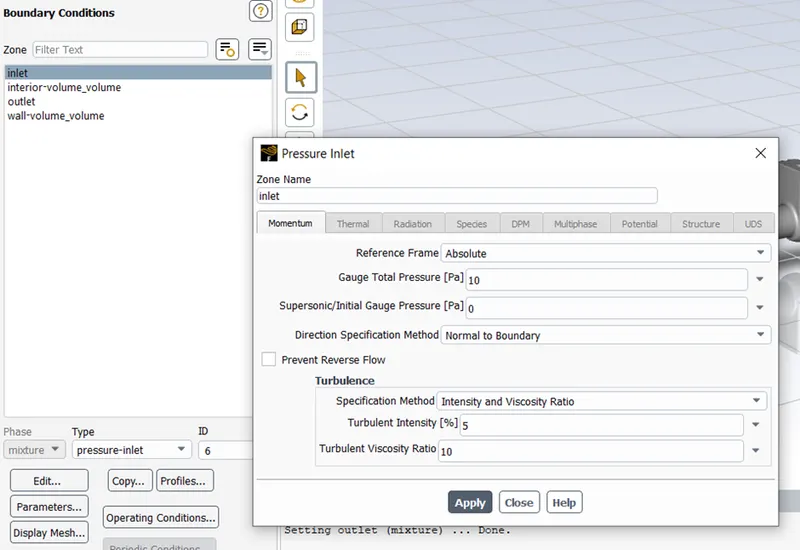
Inlet; Pressure inlet
Gauge total pressure= 10Pa = `10^-4`bar
Outlet: Pressure outlet
The next step is to define the output parameter report. As the simulation is all about the flow rate and flow coefficient, the flux report of mass flow rate and pressure at the inlet and outlet are observed.
Select mass flow rate by going to Report→ Definition→ New→ flux report→ Mass flow rate.
Select outlet as the boundary, check print to console and create output parameter.
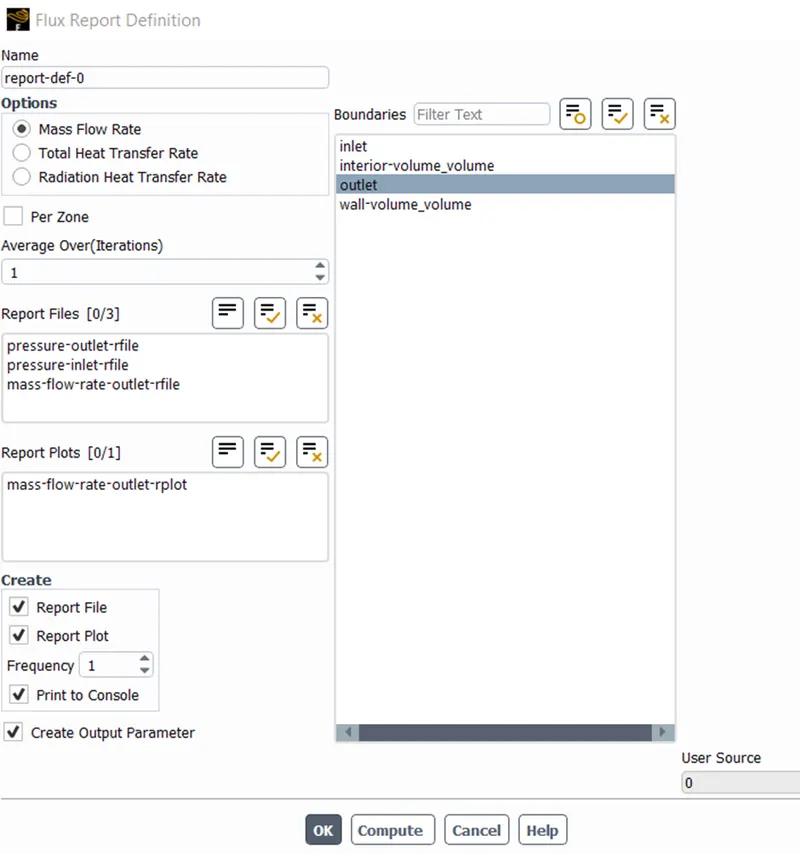
Similarly, Pressure reports are created to observe the pressure at the outlet and inlet.
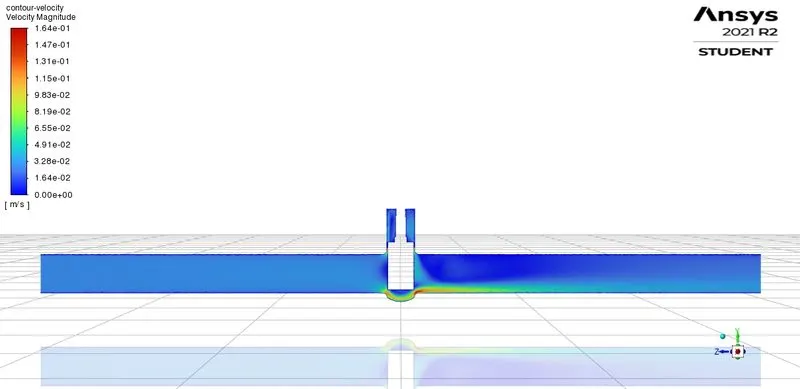
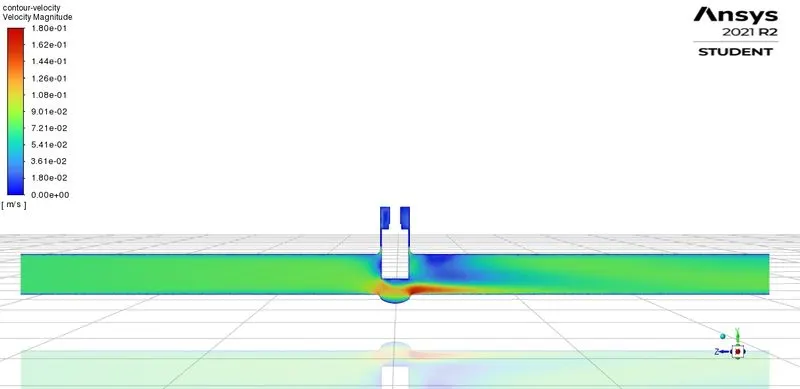
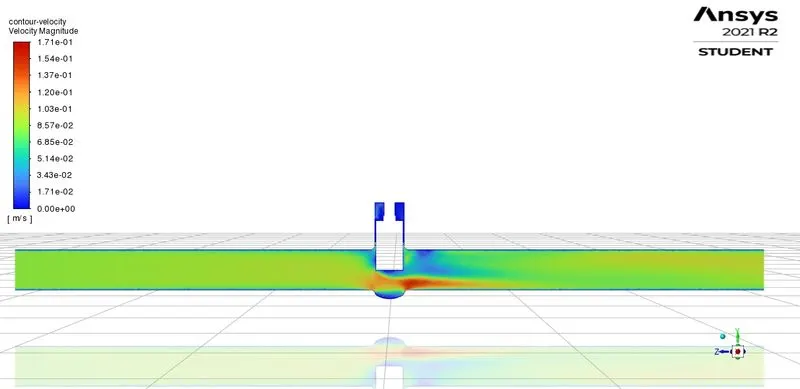
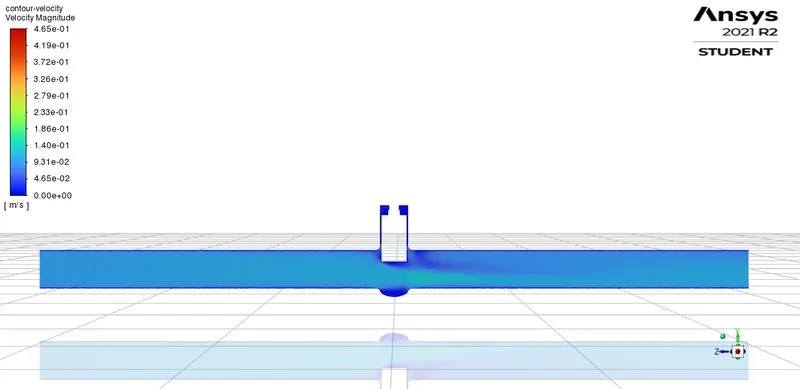
A velocity contour is created at the center plane to visualize the velocity distribution.
The solution is initialized using standard initialization from the inlet and coupled solver with the first-order upwind scheme.
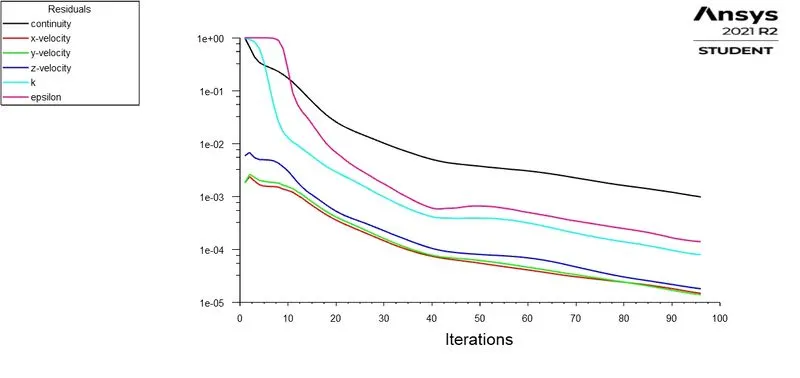
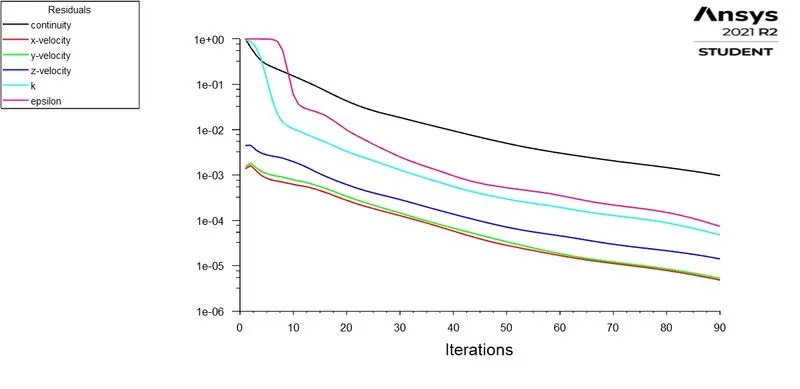
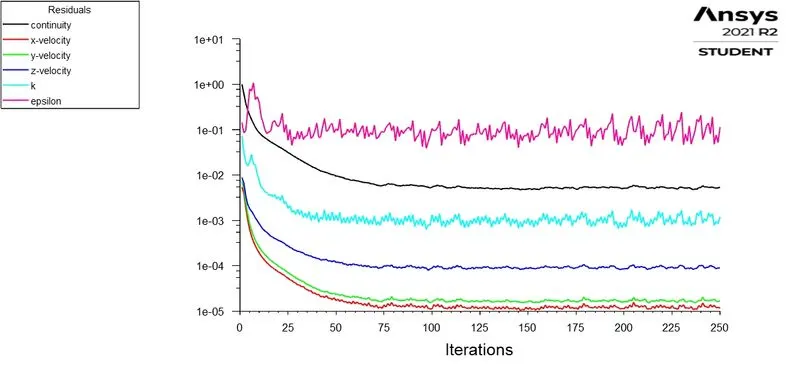
The simulation is run for 250 iterations.
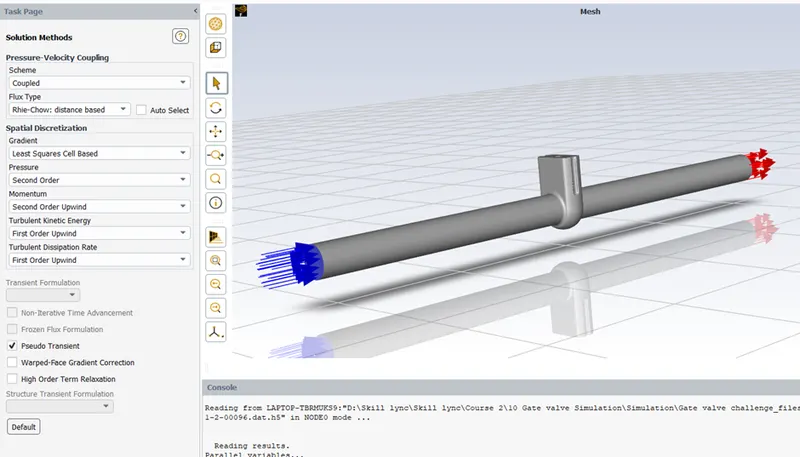
Once the calculation is over, close the fluent and go to parametric study. A table of design points indicating the lift distance and outlet mass flow rate can be visible once double click on parameters. In this table, we can input the design point values, i.e. the list distance as design points. After giving all the design points click on retain data and click on solve all design points. By doing so, fluent will run the simulation for different lift values and give us outlet flow rate as result.
- Solutions
The results obtained from the parametric study can be summarised below,
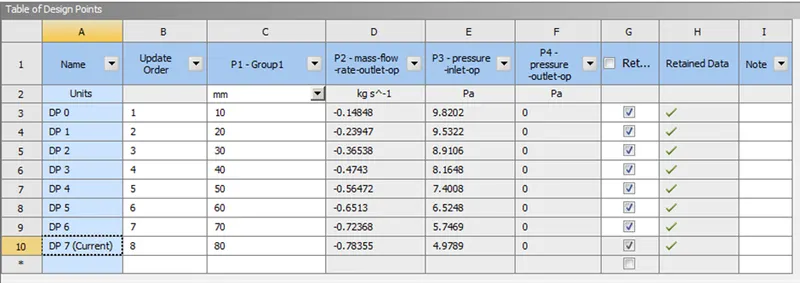
All the cases are narrated below.
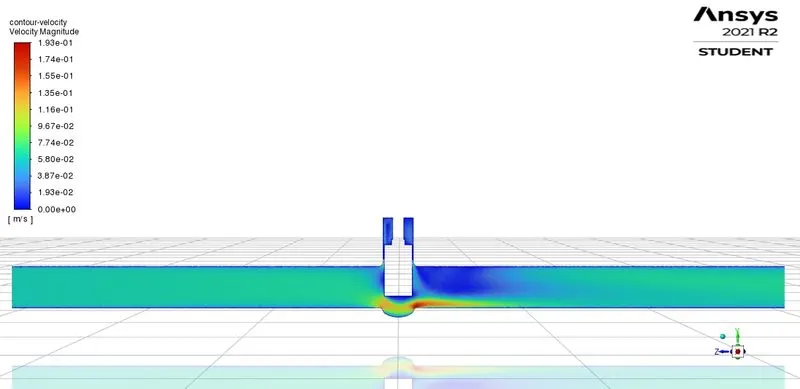
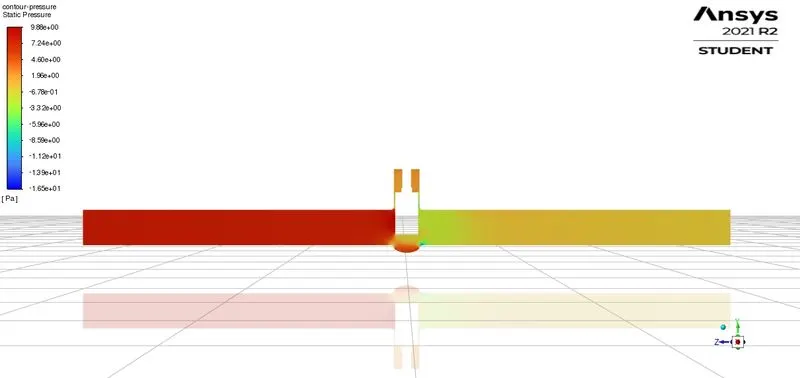
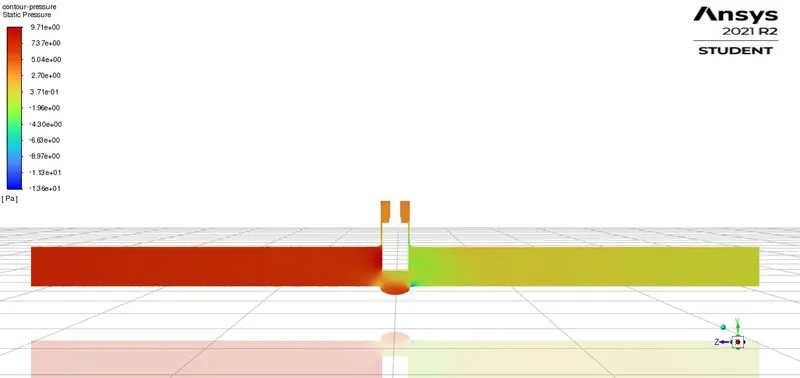
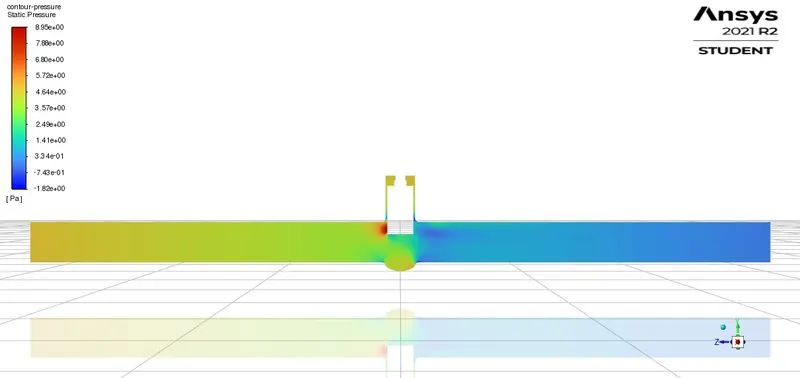
- Velocity and Pressure contour at different lift Positions.
10MM Lift
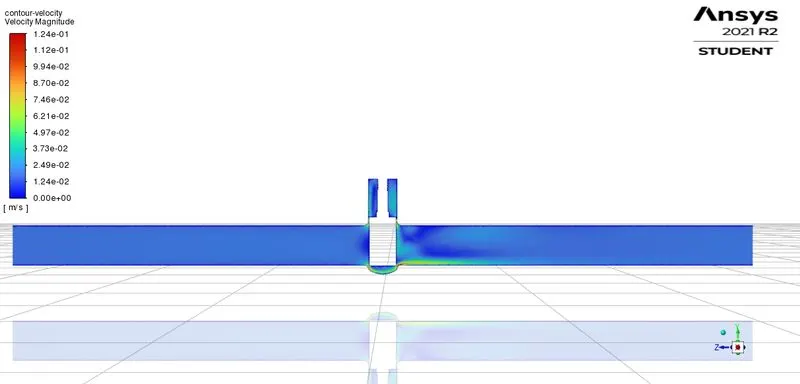
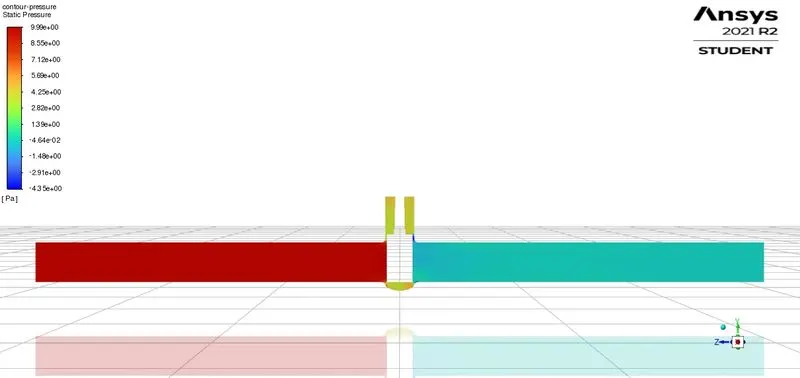
20mm Lift
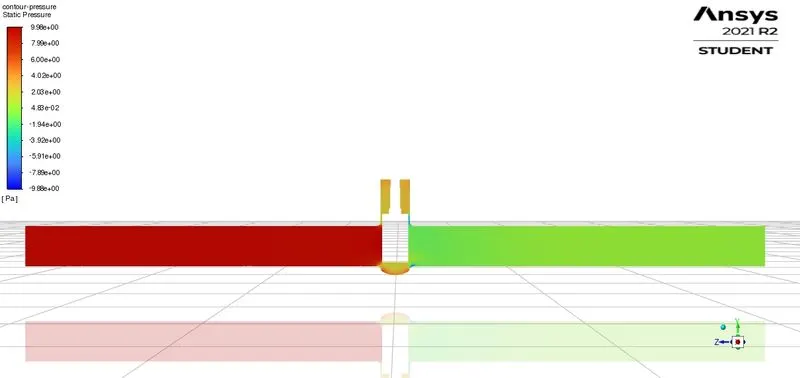
30mm Lift
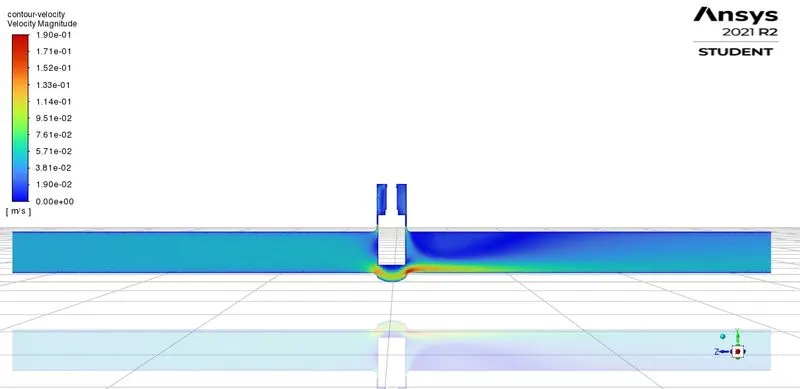
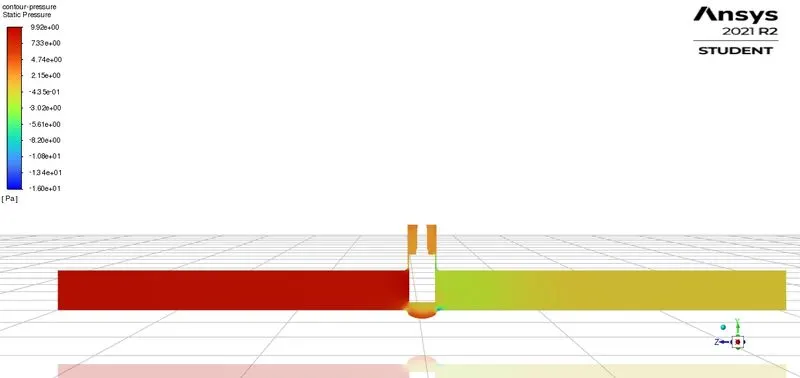
40mm lift
50mm Lift
60mm Lift
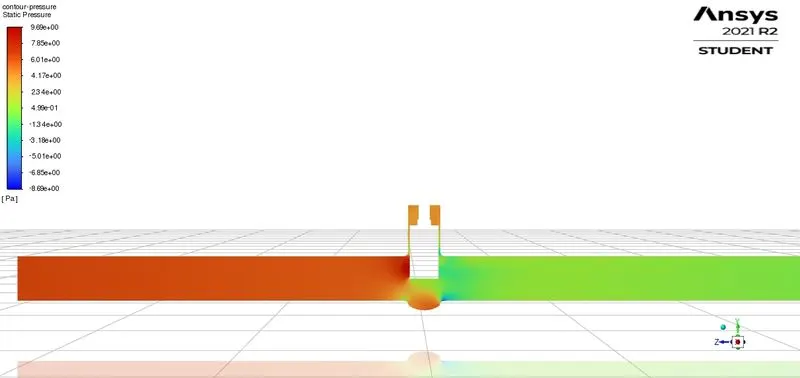
70mm Lift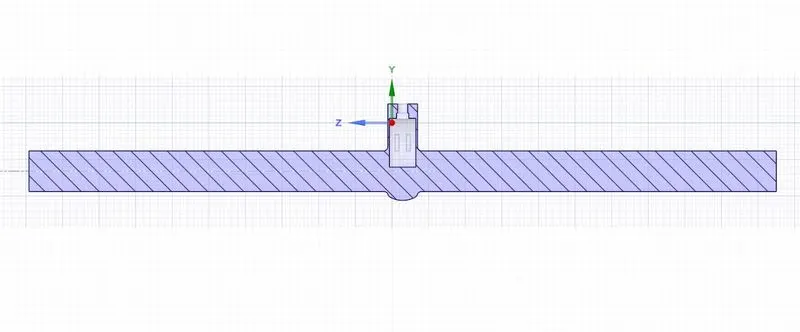
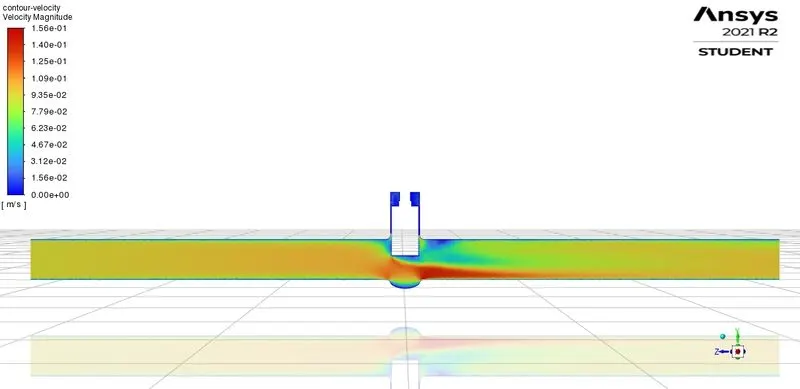
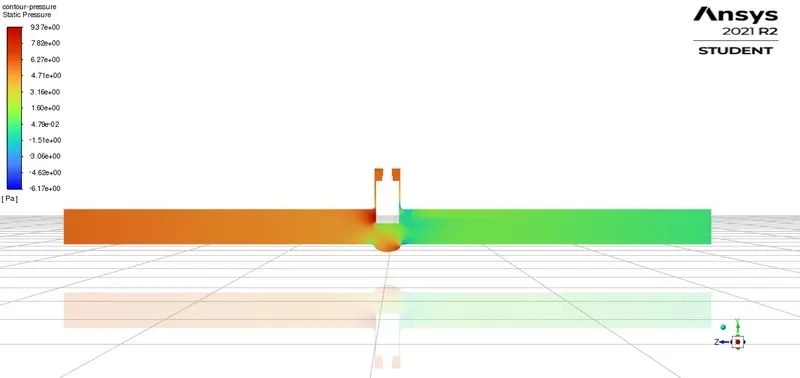
80mm Lift
- Mass flow rate at different lift conditions.
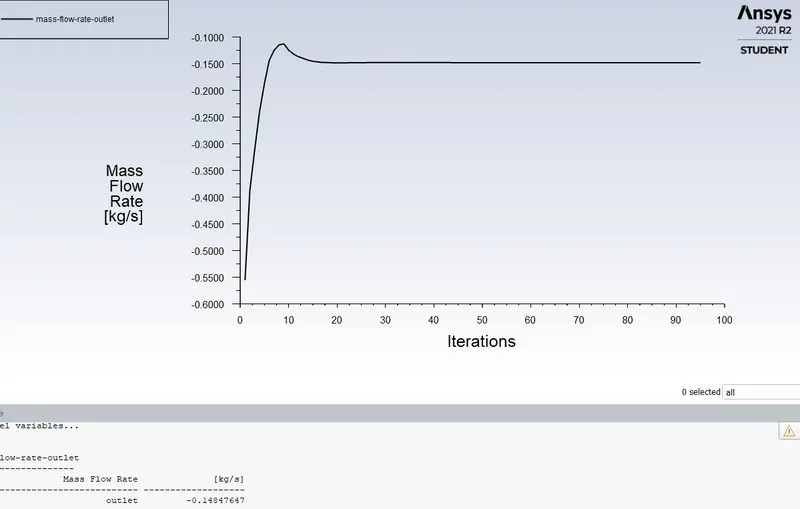
10mm lift: Flow rate = 0.15 kg/s
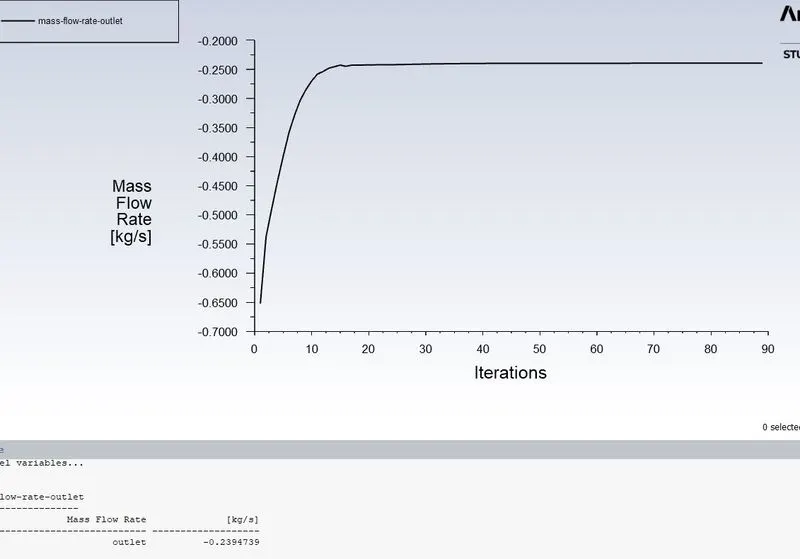
20mm Lift: Flow rate = 0.24 kg/s
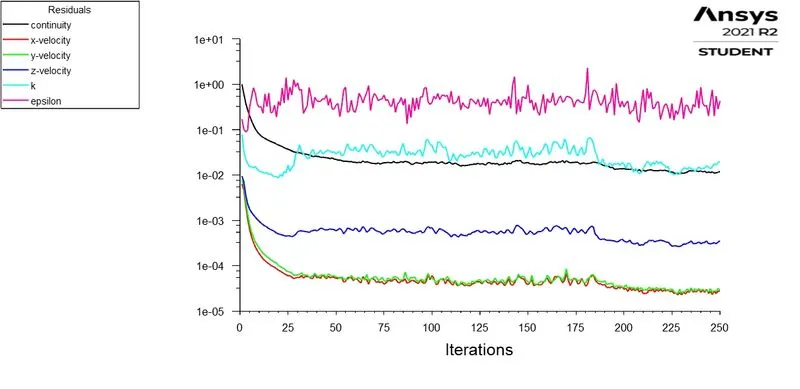
30mm Lift : Flow rate = 0.37 kg/s
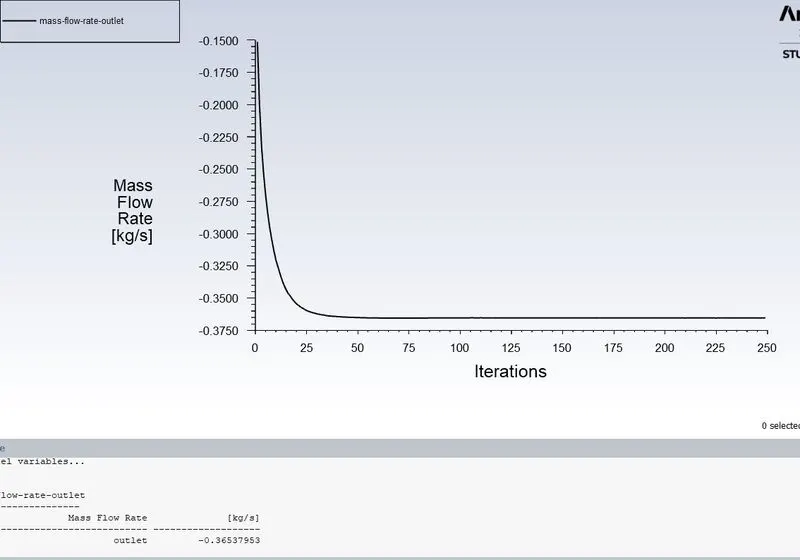
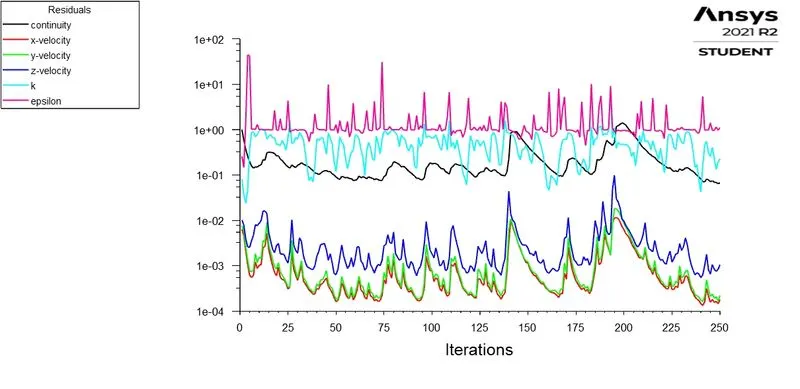
40 mm lift : Flow rate = 0.47 kg/s
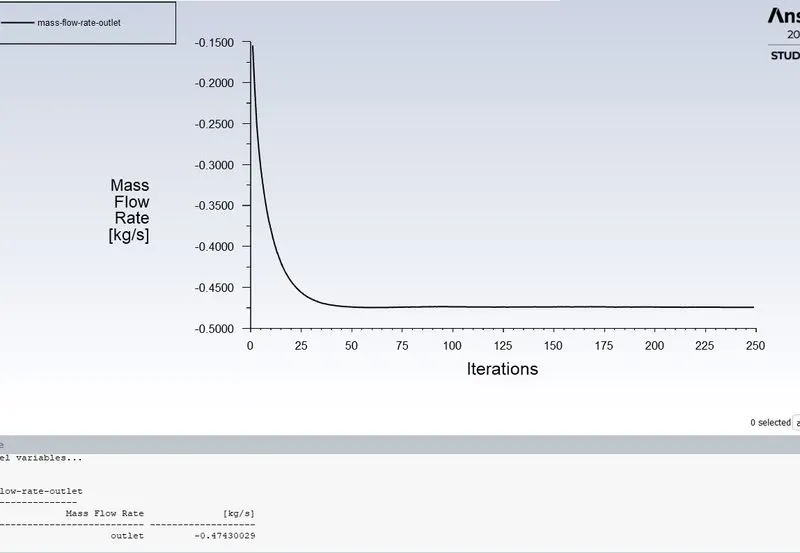
50mm lift: Flow rate = 0.56 kg/s
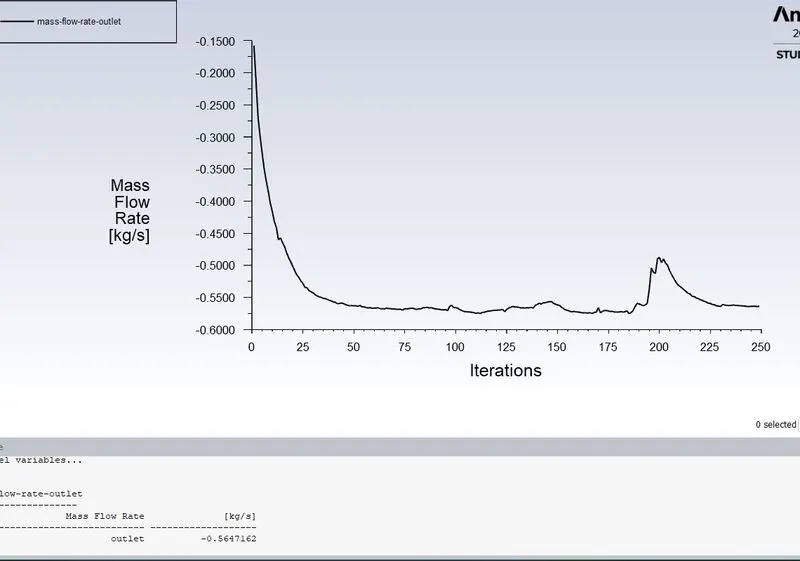
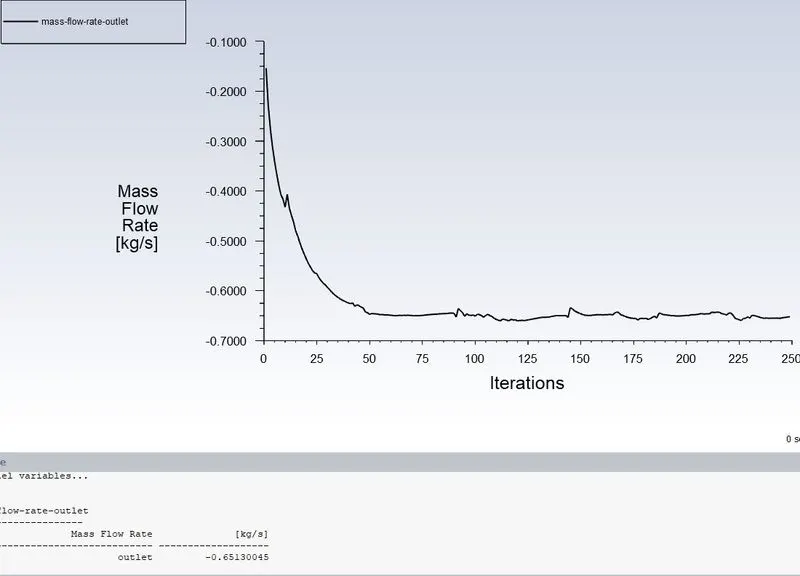
60mm lift: Flow rate =0.65 kg/s
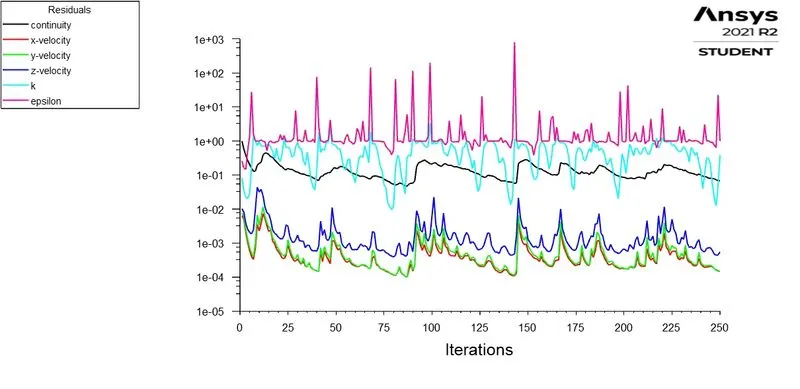
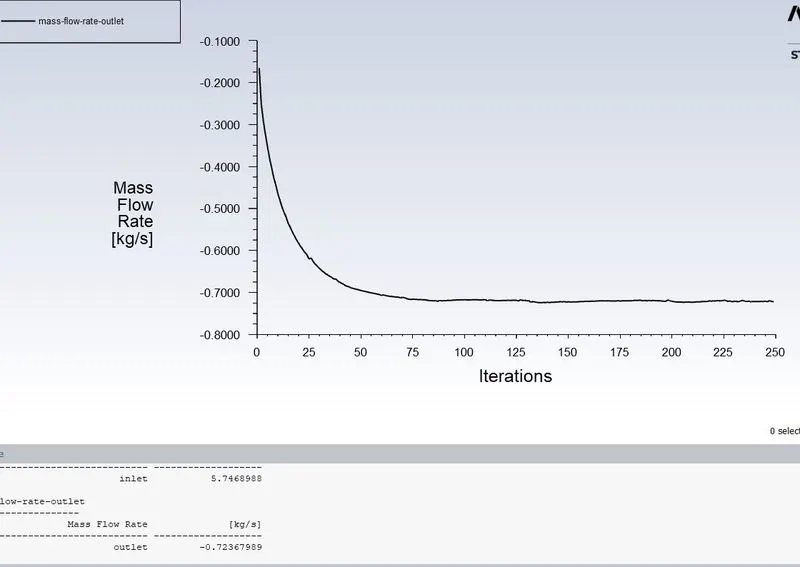
70mm lift: Flow rate = 0.72 kg/s
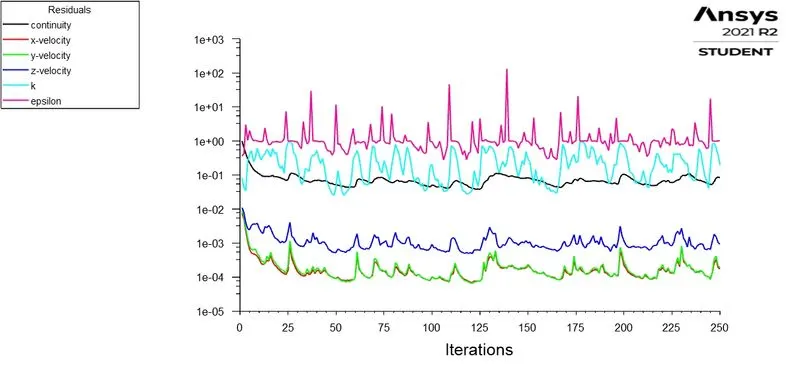
80mm Lift: Flow rate = 0.78 kg/s
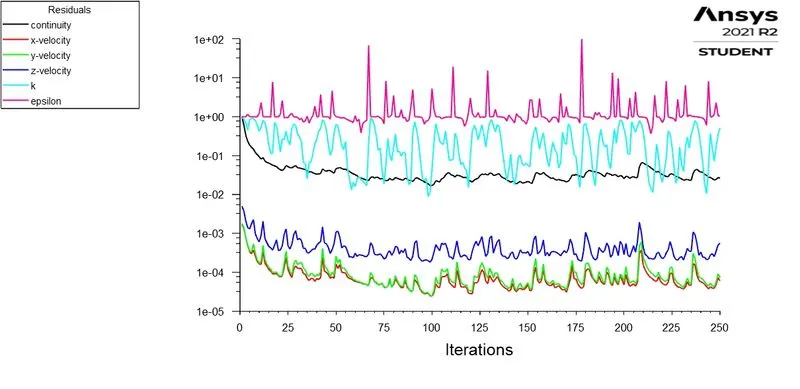
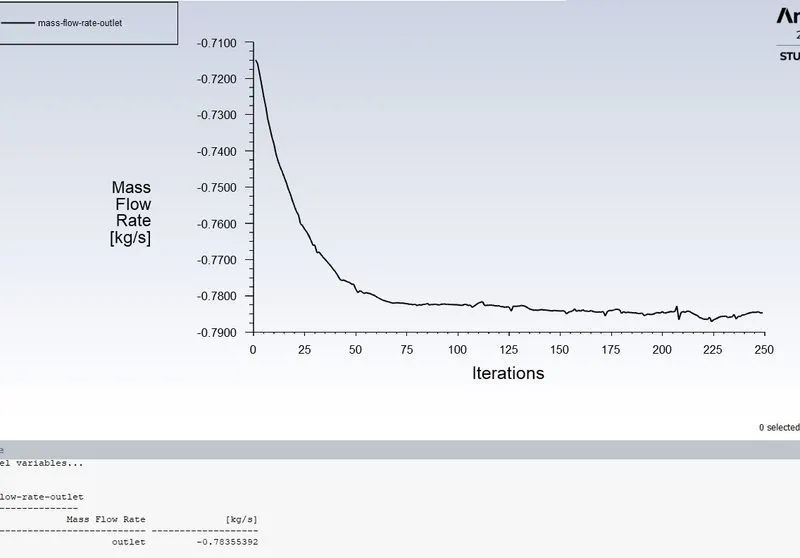
The above results show that the mass flow rate increases as the opening of a gate valve are increases. The mass flow rate is 0.15kg/s when the opening is 10mm and it is 0.78kg/s when the opening is 80mm.
It is also observed that the pressure on the gate valve is reducing as the opening increases.
- Flow coefficient `(C_v)` and Flow factor `(K_v)`
`K_v=Q√(SG⁄∆P)`
`C_v=1.156*K_v`
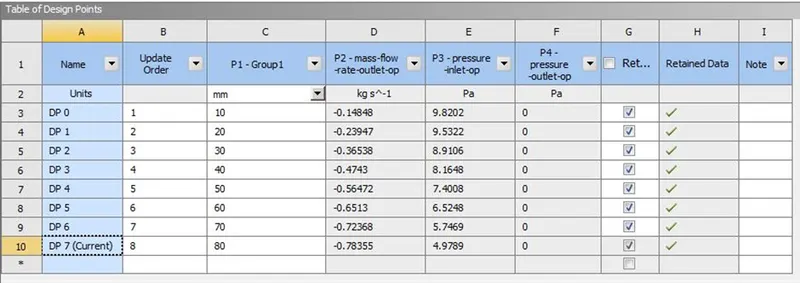
From the results obtained, we have all the data to calculate the Flow coefficient and flow factor.
The results are attached in the below table along with the pressure difference. All the unit conversions are taken care of in the table.
Conclusion,
- The parametric study helps us to simplify the flow calculation by reducing the time as well as the efforts to run the simulation.
- The mass flow rate in the pipe increases as the gate valve opening increases. This also reduces the pressure difference inside the pipe.
- A variation in the flow factor, as well as the flow coefficient, can be observed from the calculations. It shows that the flow factor as well as the flow coefficient increases with the valve opening