Week 9 - Parametric study on Gate valve.
Parametric study on the gate valve simulation
Objectives
To perform a parametric study on the gate valve simulation by setting the opening from 10 % to 80%.
- Obtain the mass flow rates at the outlet for each design point.
- Calculate the flow coefficient and flow factor for each opening and plot the graph.
- Discuss the results of the mass flow rate and flow coefficient.
Introduction
Gate valves are generally used in systems where low flow resistance for a fully open valve and no throttling are desired. They utilize a sliding closure where a control member called a gate slides across a general passageway in order to control fluid flow. Gate valves are used when a straight-line flow of fluid and minimum restriction is desired. When the valve is wide open, the gate is fully drawn up into the valve, leaving a straight-through, unobstructed passageway for flow through the valve. Therefore, there is little pressure drop, turbulence and flow restriction through the valve. Gate valves are not suitable for throttling purposes as the key valving components have a tendency to erode quickly due to the high velocity fluid passing through a narrowly restricted area.
The high manufacturing costs and time along with reducing the dimensions of gate and block valves while still adhering to industrial standards is a difficult task. Therefore, a finite element analysis program would be useful in the design of future
valves. It will also allow the user to manipulate input parameters and obtain relevant design outputs and
information. parametric studies can define the effect of physical quantities like wall thickness, internal pressure in bores and cavities and internal temperature on the stress of the system or area under consideration for different models.The major examples of such valves are the fluid tranfer valves used in petroleum installations like in subsea and surface operations.
Theory
The valves in any systems are the common flow restrictors, hence, the design and analyses of valves are most critical tasks.
The flow control valves in high inlet pressure systems for different openings are simulated. The influence of pressure, flow rate and openings of the valve is done by k-epsilon turbulence models and the results have been compared.
The capacity of water flows through the investigated gate valve can be represented by the flowcoefficient, which can be expressed in the following
k_v=10Q×sqrt[1000ρΔpρ0]
where, Q is the volume flux (m3/h), ρ0 is the density of water, Kv is the flow coefficient and it sents the flux when the pressure drop.
The flow coefficient of a device is a relative measure of its efficiency at allowing fluid flow. It describes the relationship between the pressure drop across valve or other assembly and the corresponding flow rate
Mathematically the flow coefficient Cv (or flow-capacity rating of valve) can be expressed as :

where:
- Q is the rate of flow (expressed in US gallons per minute),
- SG is the specific gravity of the fluid (for water = 1),
- ΔP is the pressure drop across the valve (expressed in psi).
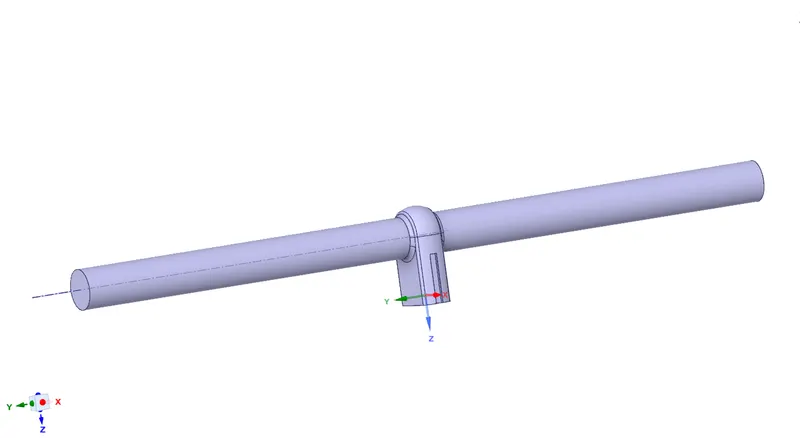
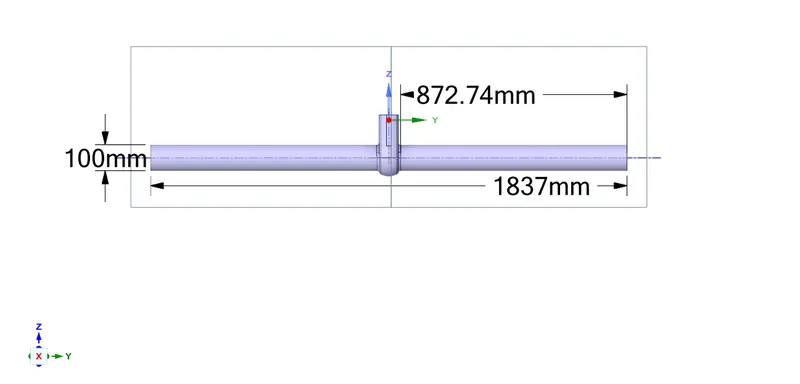
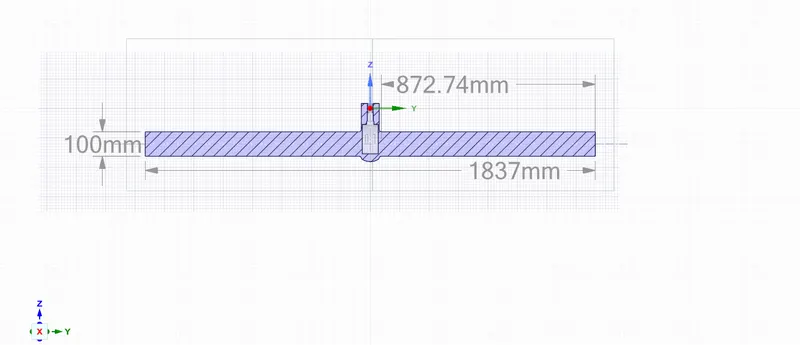
GEOMETRY
MESHING
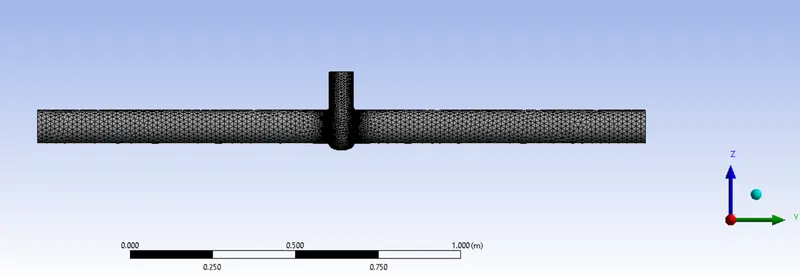
SETUP
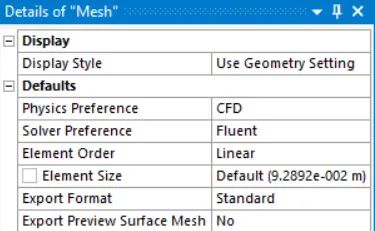
The setup of the modified gatevalve where the gravity acts in the negetive z diection is simulated for a steady state simulation. The materials used is water and the boundary type is set to pressure inlet boundary.
The pressure of the system under consideration is found to be approximately 10 Pa. The viscous model is set to K-epsilon model with scalable walls. The inlet vellocity is to be found by calculations or in the solving section which is given as a initial parameter.
The parameters taken into account for parametric solving are mass flow, flow coefficient, and flow factor.The definition reports of these parameters are taken along with necessary contours of lateral plane.
The solution thus obtained will give these output parameters for each lift of the gate valve.
SOLUTION
FOR 10MM LIFT
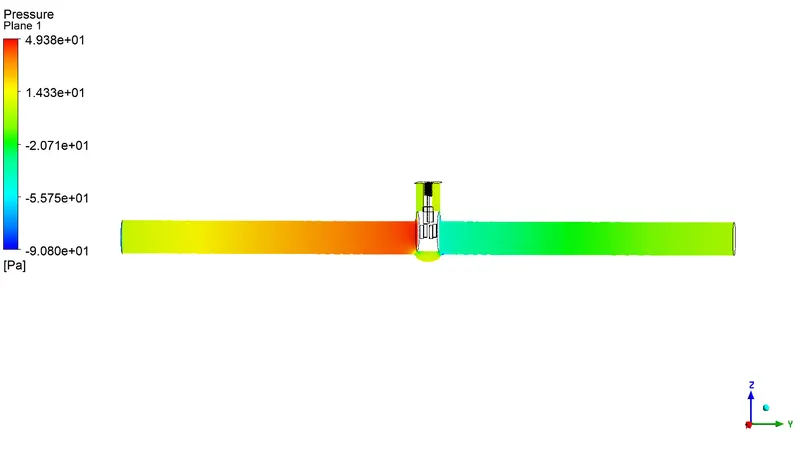
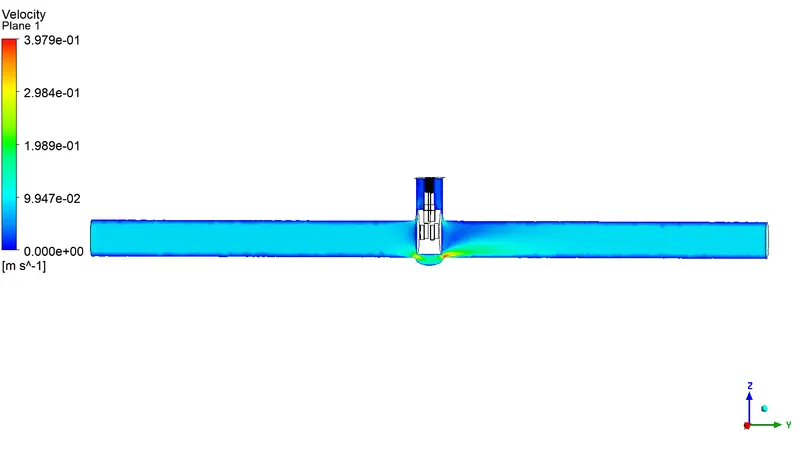
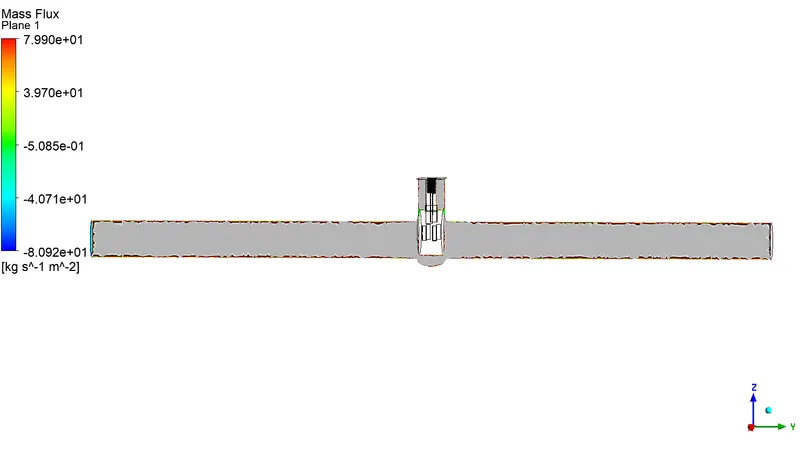
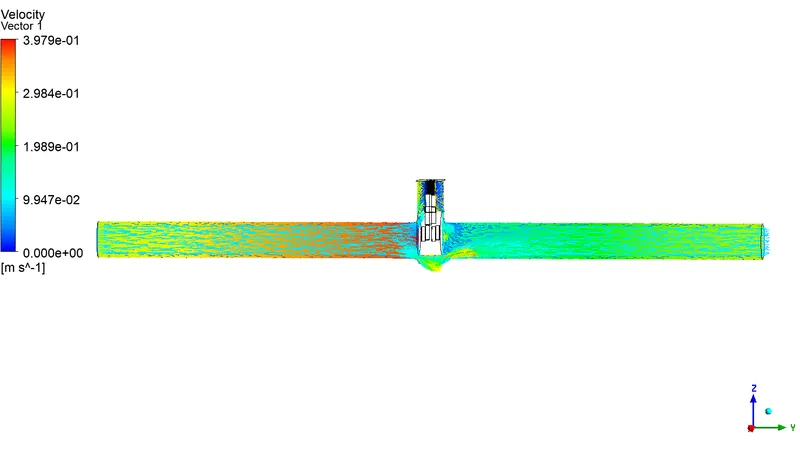
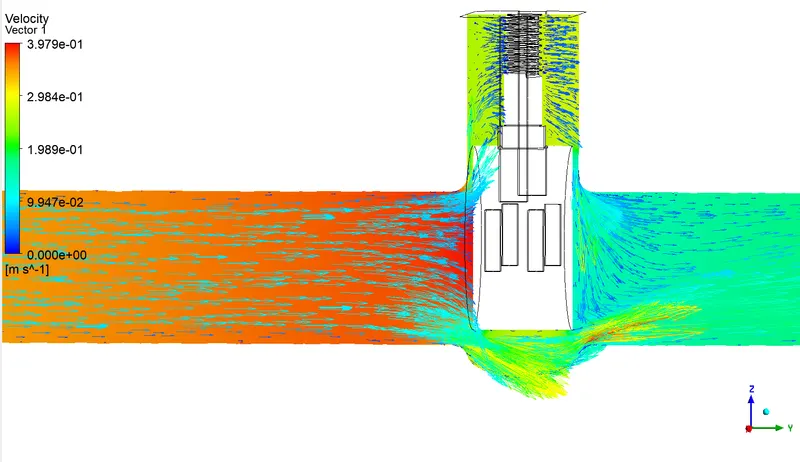
Since the fluid flows outside the volume, some of the mass flow rate tends to be negetive in the parametric study given below.
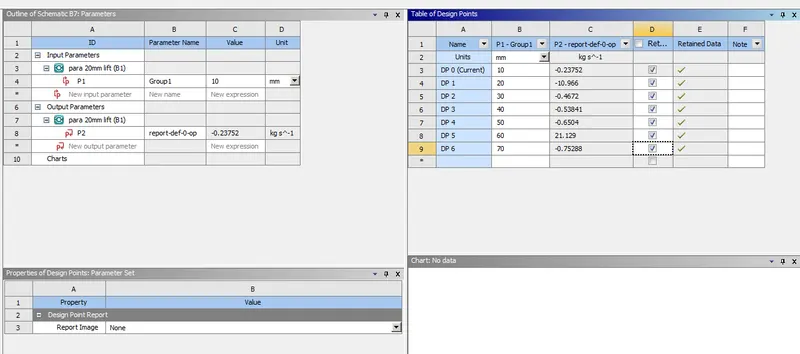
| opening(mm) | mass flow rate(kgs^-1) | ΔP (Pa) | flow coefficient | flow rate |
| 10 | -0.2375 | 10 | -0.0750 | -0.06465 |
| 20 | -10.966 | 10 | -3.465 | -2.9868 |
| 30 | -0.4672 | 10 | -0.1476 | -0.1272 |
| 40 | -0.5384 | 10 | -0.1701 | -0.4641 |
| 50 | -0.6504 | 10 | -0.2055 | -0.1771 |
| 60 | 21.129 | 10 | 6.6767 | 5.755 |
| 70 | -0.7528 | 10 | -0.2379 | -0.2050 |
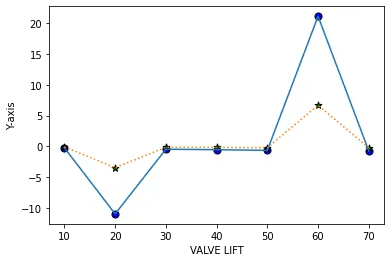
The above plot has the valve lift (mm) in the X axis,the flow coefficient and mass flow rate are compared in the Y axis is can be analysed with each lift.
The blue line represents the mass flow rate and the orange dotted line represents the corresponding flow coefficient.
The matches approximately in all points except the points where the mass flow rate is positive during the parametric study.
Conclusion
The selection of the valve types, design and material plays a vital role in the performance and reliability of any system. A
number of researchers have experimented and analyzed valves for all its parts, fluid types, operating parameters, discharge
coefficient, stiction and eroding characteristics and have improved the valve technology. Now, with the emergence of robust computational fluid dynamics (CFD) tools and powerful computers, the analysis of valve performance, and thus the job of designing valves to suit a particular application can be done much faster. Apart from this, CFD analysis can reveal the complex flow structure and the sonic characteristics around the valve, which the experiments hardly provide.
the decrease of the valve opening degree, the flow area decreases and the throttling effect increases, so the upstream pressure increases as the downstream pressure remains constant. It can be found that, when the gate valve is in a
100% opening degree, the water flows directly to the downstream pipe, and there is no swirl in the
main pipe of the valve. As the valve opening degree decreases, the maximum velocity increases and
it appears under the valve disks. When comparing the gate valve with a 80% opening degree and the
gate valve with a 10% opening degree, the maximum velocity increases from 2.2 m/s to 9.3 m/s. From
the water streamline under different valve opening degree, it can be found that there is a local
recirculation region with low velocity behind the valve disk, and the smaller the valve opening
degree, the greater the local recirculation