Week 9 - Parametric study on Gate valve.
Objective
You will have to perform a parametric study on the gate valve simulation by setting the opening from 10 % to 80%.
- Obtain the mass flow rates at the outlet for each design point.
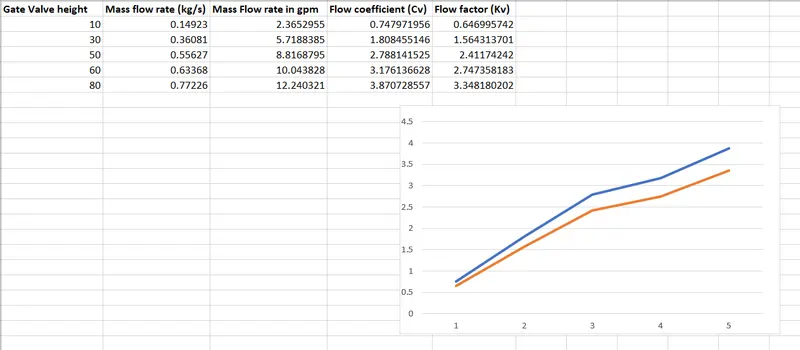
- Calculate the flow coefficient and flow factor for each opening and plot the graph.
- Discuss the results of the mass flow rate and flow coefficient.
Answer
Geometry
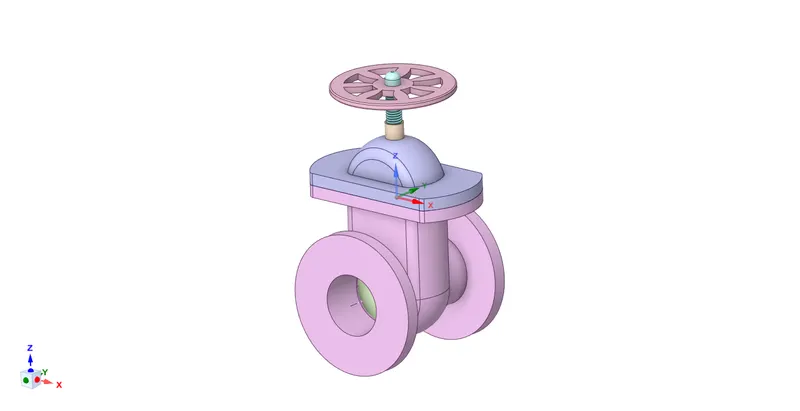
This is a gate valve, and we are going to do the flow simulation with this geometry.
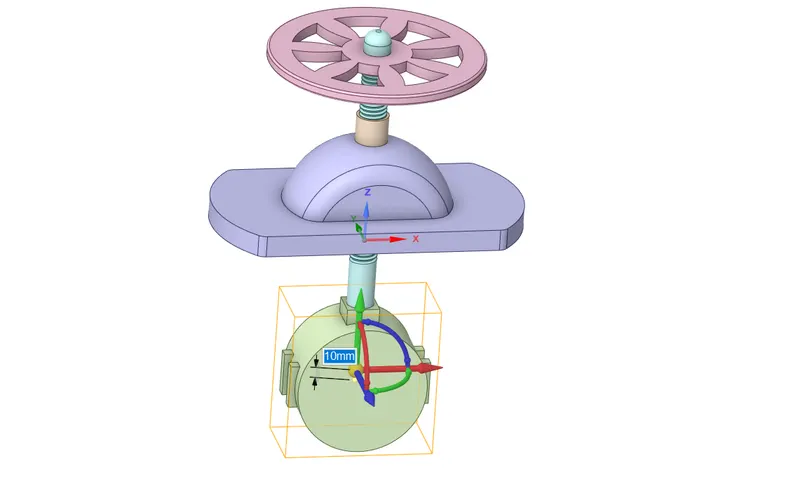
For the first, we need to select the gate with the move tool and raise it to a height of 10 mm. After raising the desired height, we need to enable parametric study.
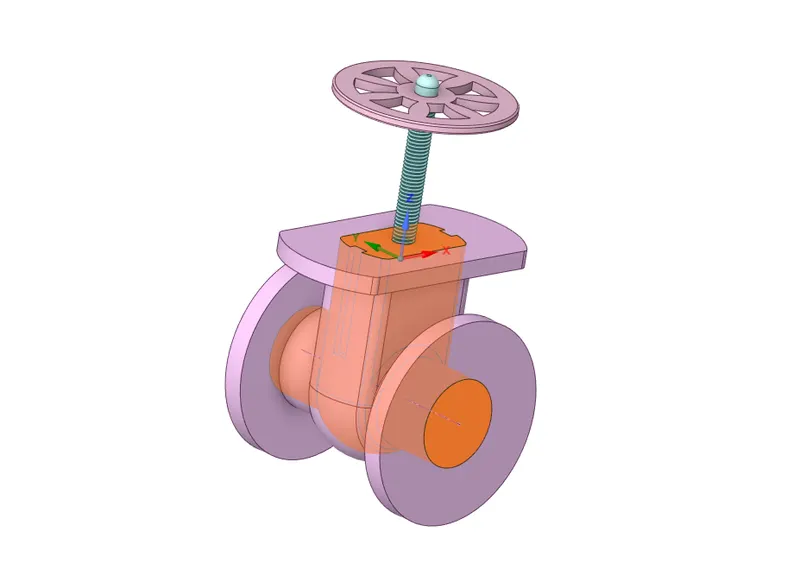
Now, we need to extract the fluid volume on three edges.
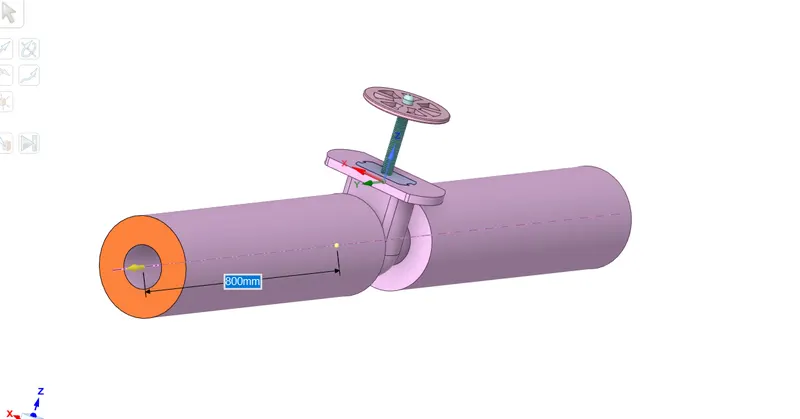
In order to study a region of fluid, we need more volume of space for the liquid, so we pull the both sides to about 800mm.
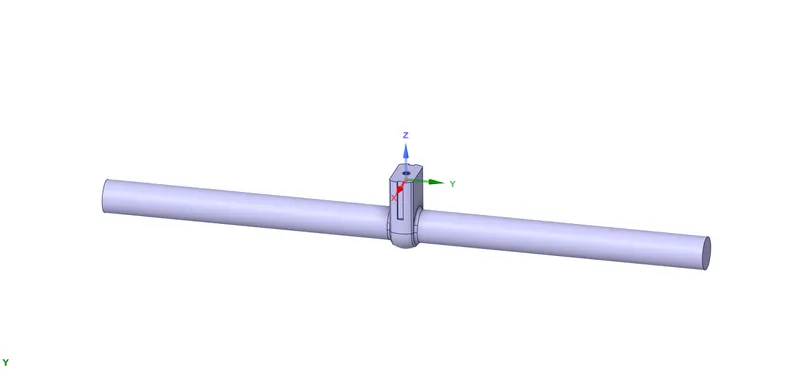
This is the final geometry, which we are going to take the study.
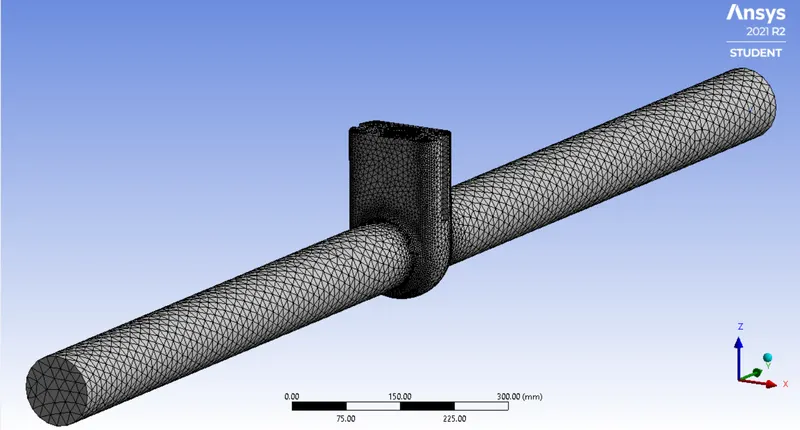
Meshing the geometry to 50mm size.
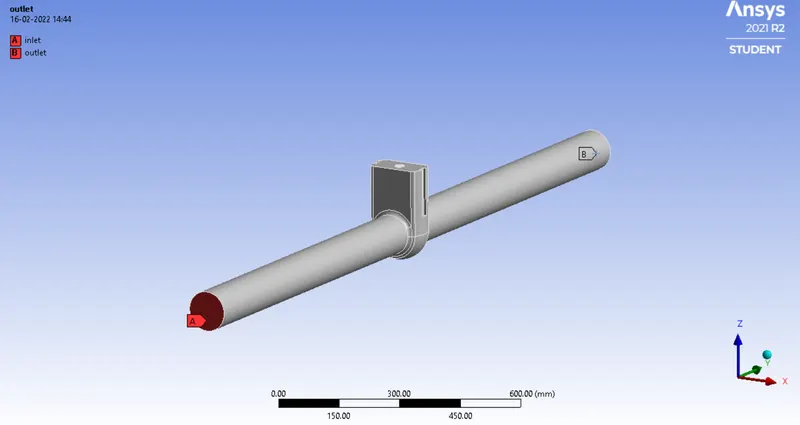
Defining the inlet and outlet.
Open Setup.
First enable gravity in the Z-direction, since the geometry faces in Z-Y plane.
Go to the material library and select water as the material and assign water in the cell_volume.
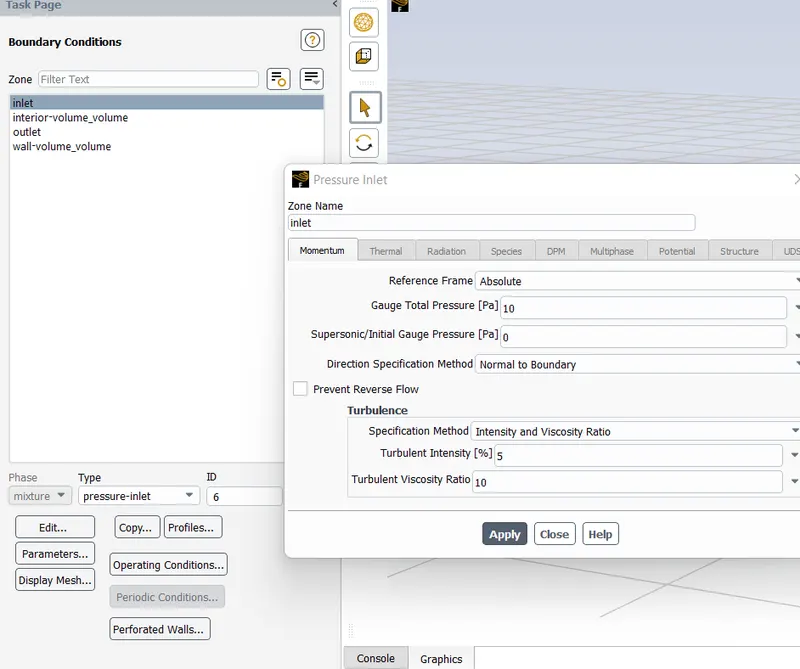
Now, open boundary conditions, and select accordingly.
make K-epsilon as the viscous model.
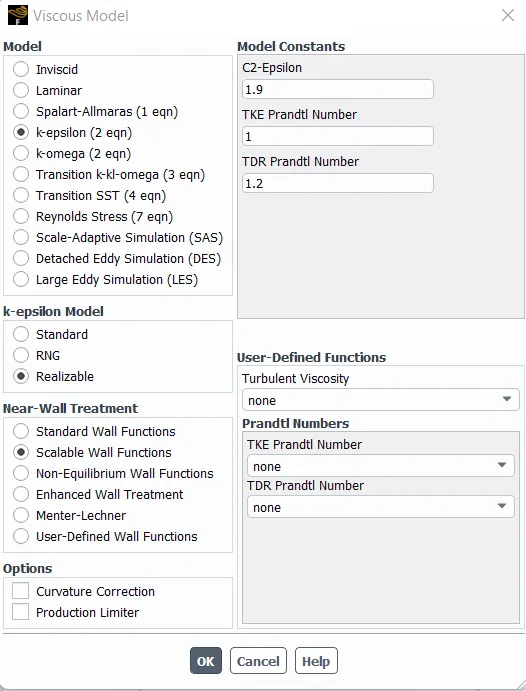
Select the report definitions accordingly.
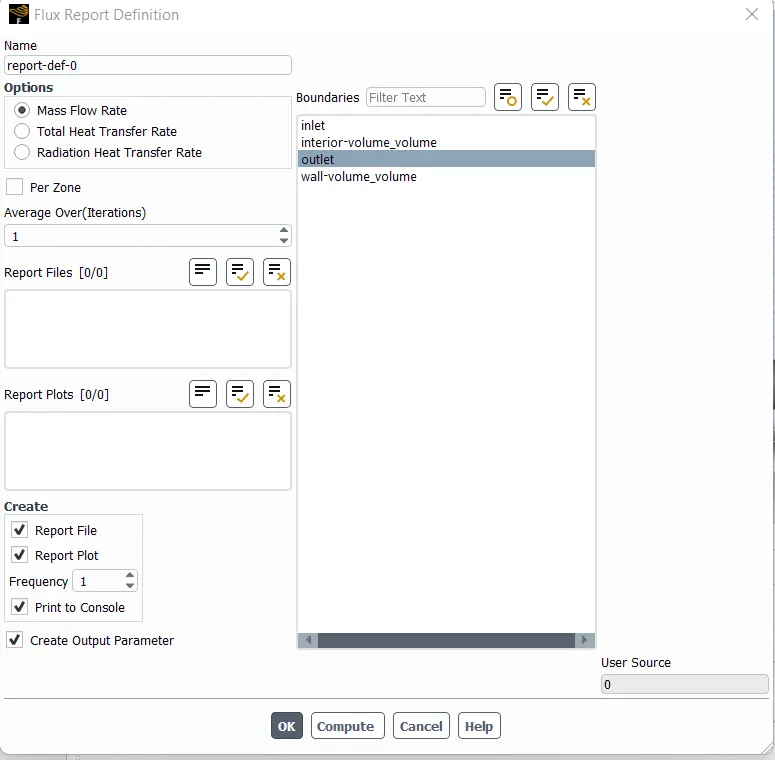
Now we run the simulation for 250 Iterations.
RESULTS
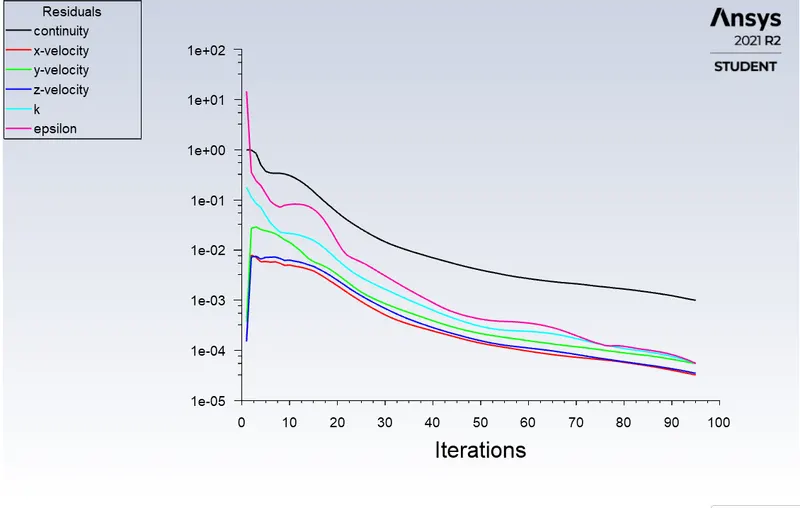
Residual plot for 10mm raise.
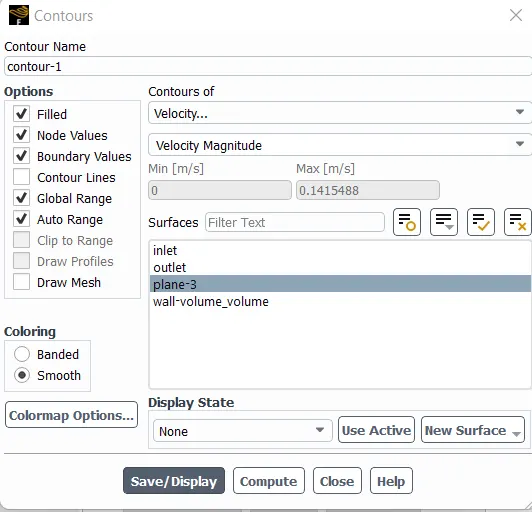
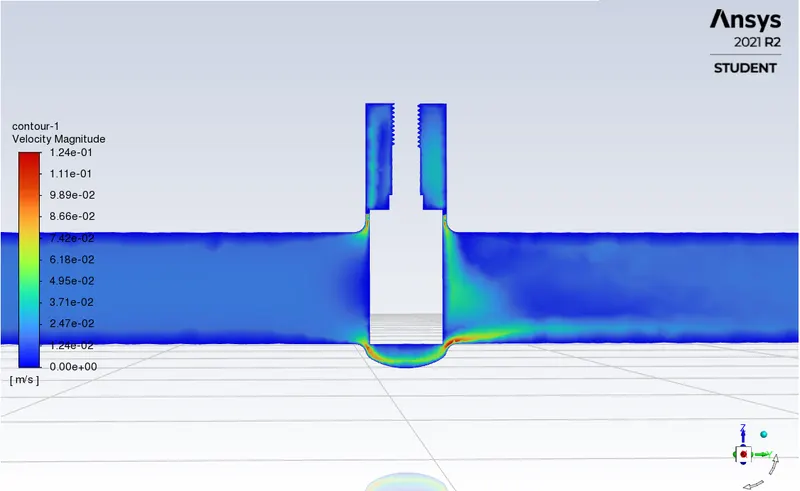
Velocity contour for 10 mm raise.
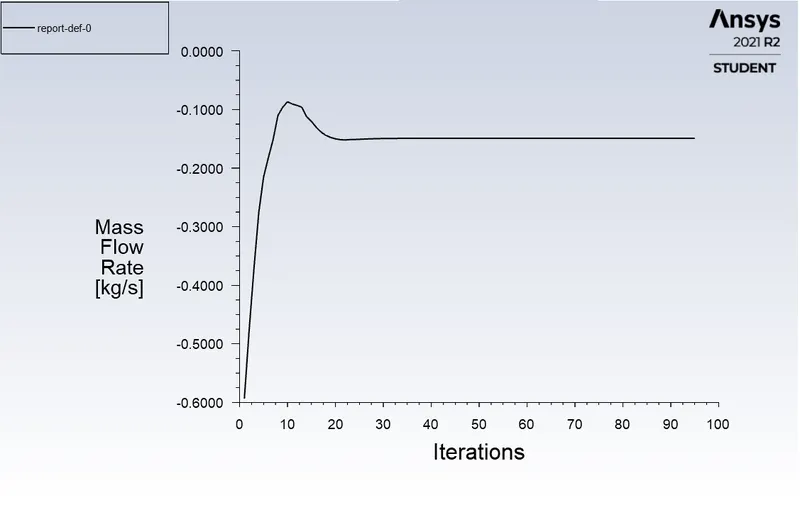
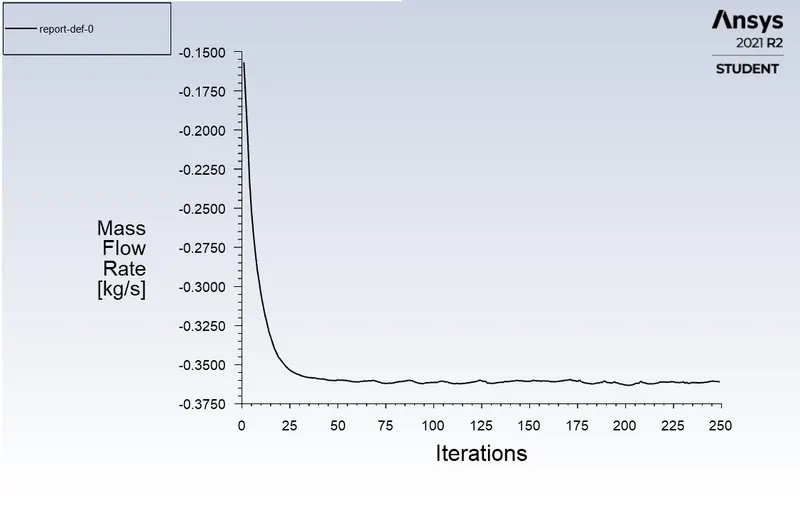
Mass flow rate plot.
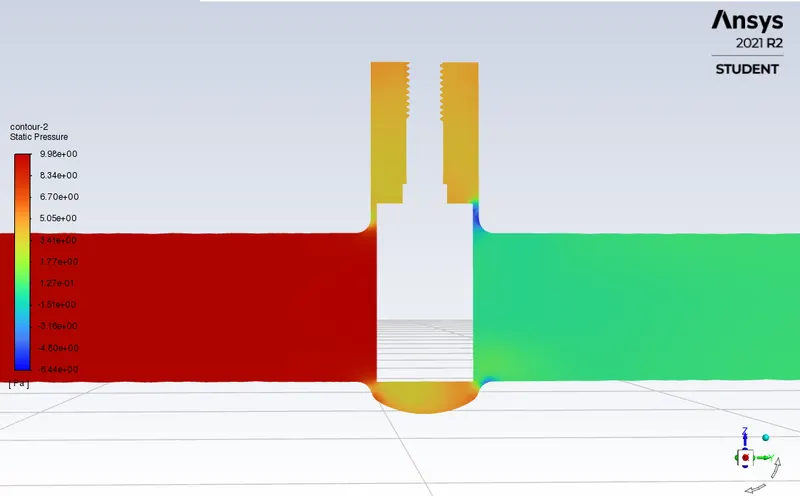
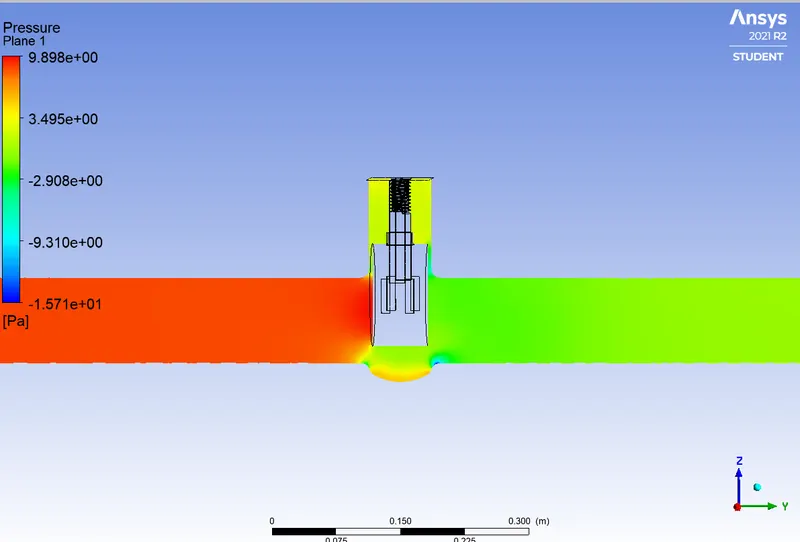
Contour showing static pressure.
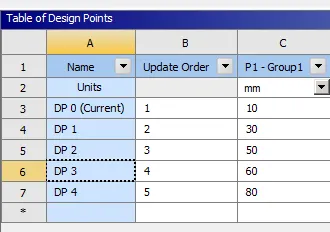
Now, we need to close the setup and open parameters. Here we set different heights for the gate valve. I have set 4 more sets of height for the gate valve and clicked the update button.
The obtained results are as follows, in which the Column D represents the Mass flow rate corresponds to each height
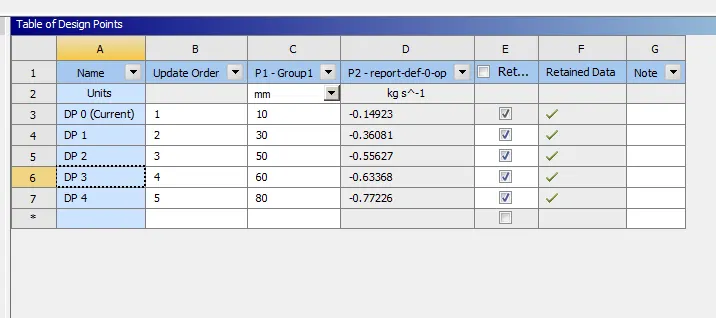
Now lets view the results for different height of gate valve.
Gate valve at 30 mm
Velocity contour
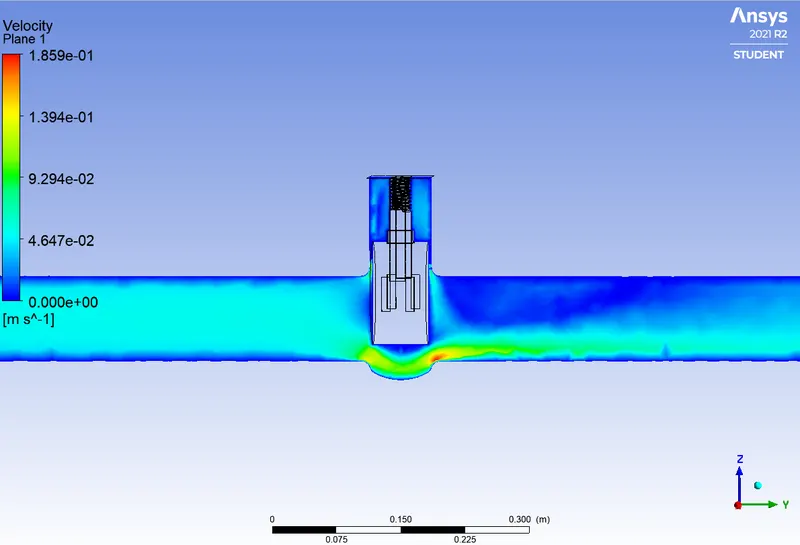
The static pressure contour
Mass flow rate plot.
Residual plot
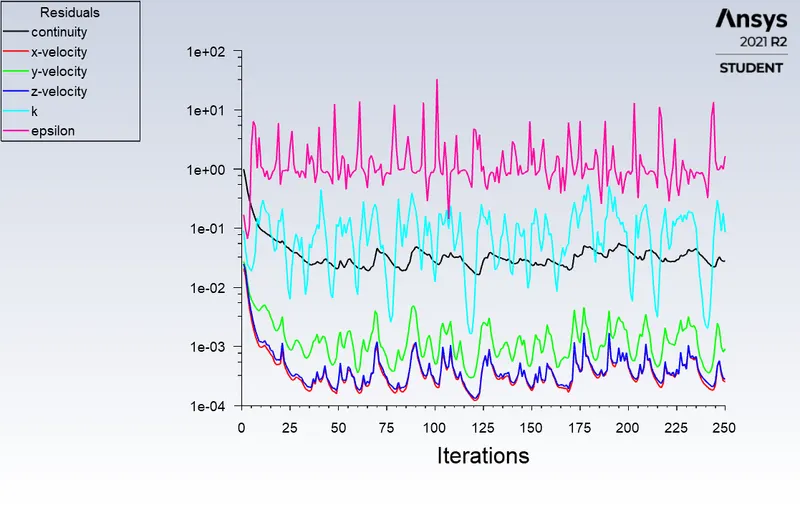
Gate valve at 50mm
Velocity contour
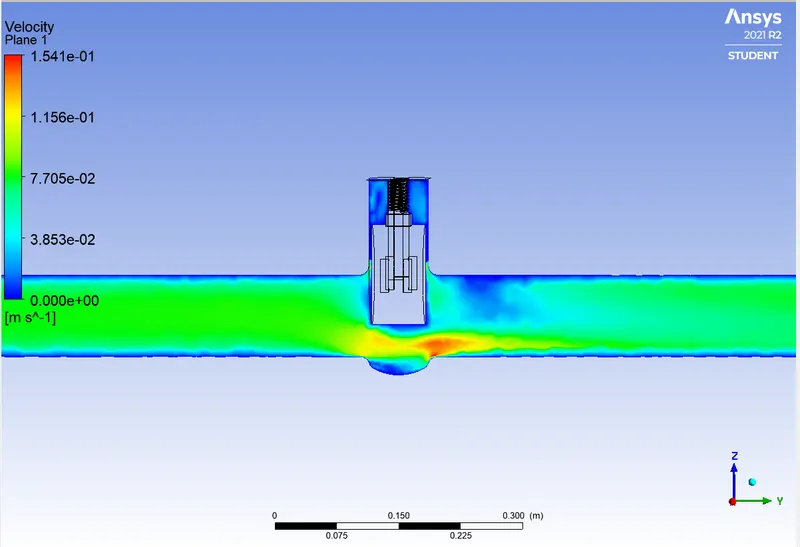
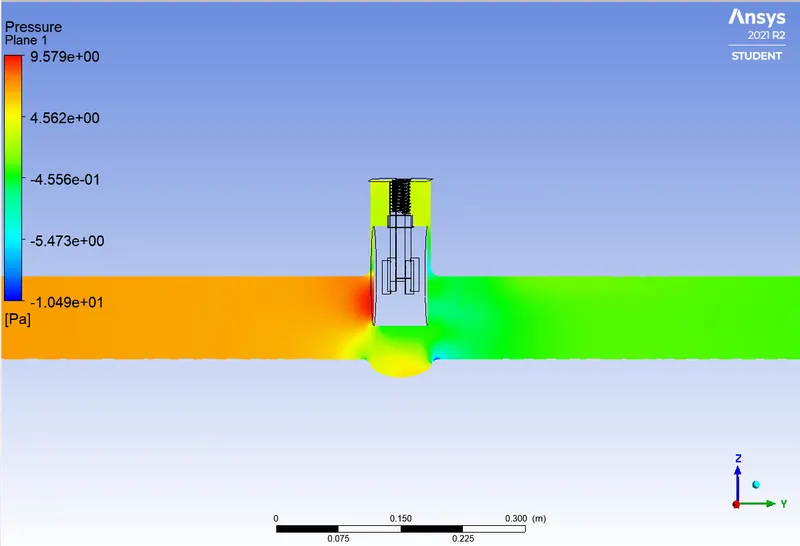
Pressure contour
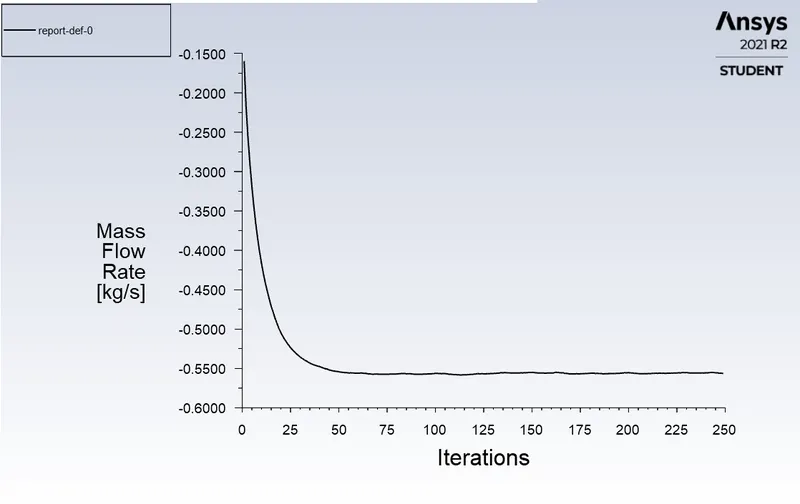
Mass Flow Rate
Residual Plot
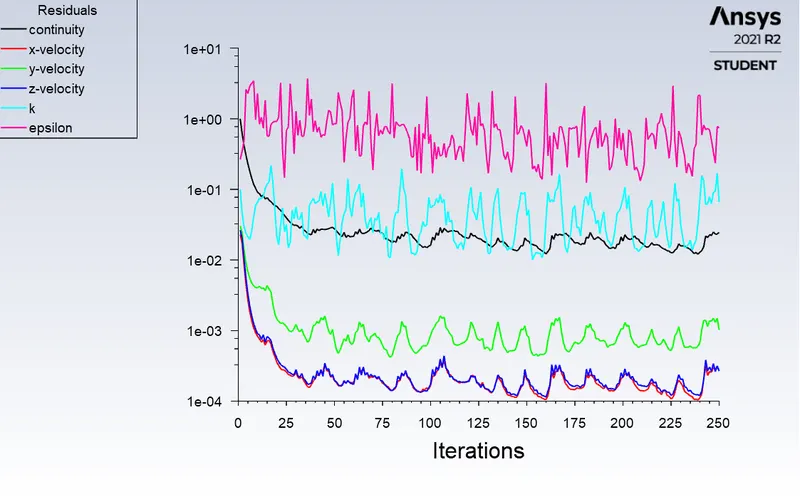
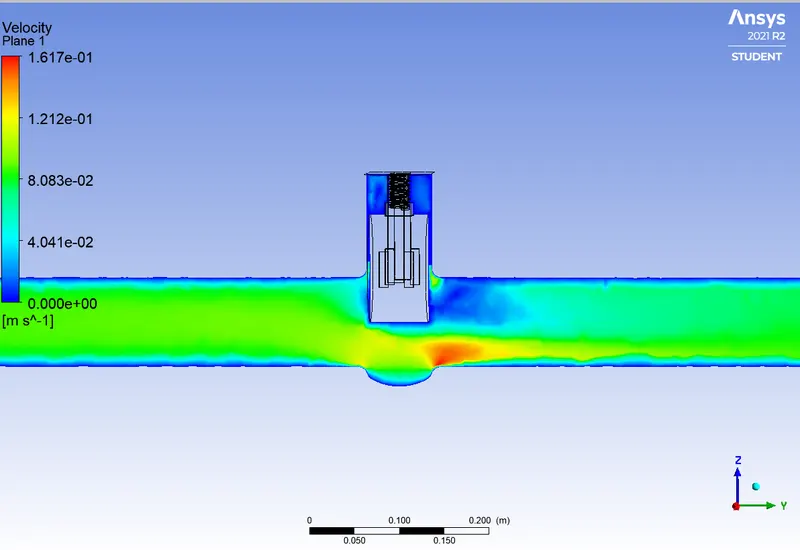
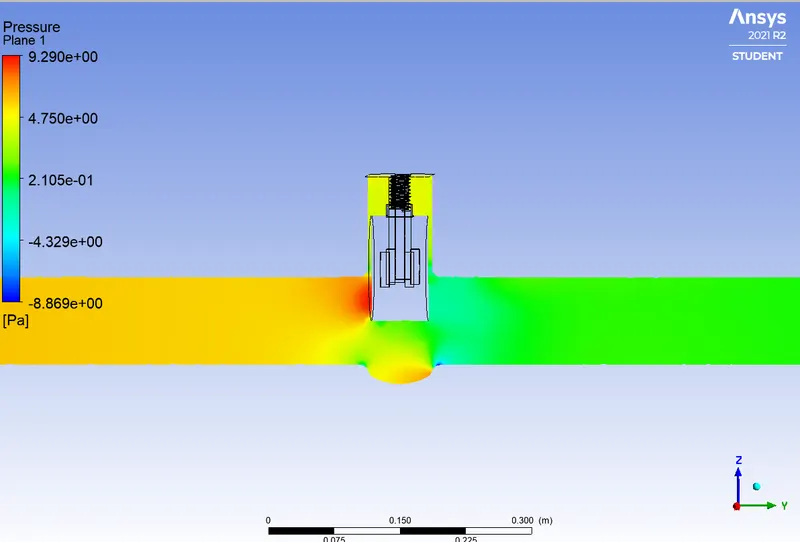
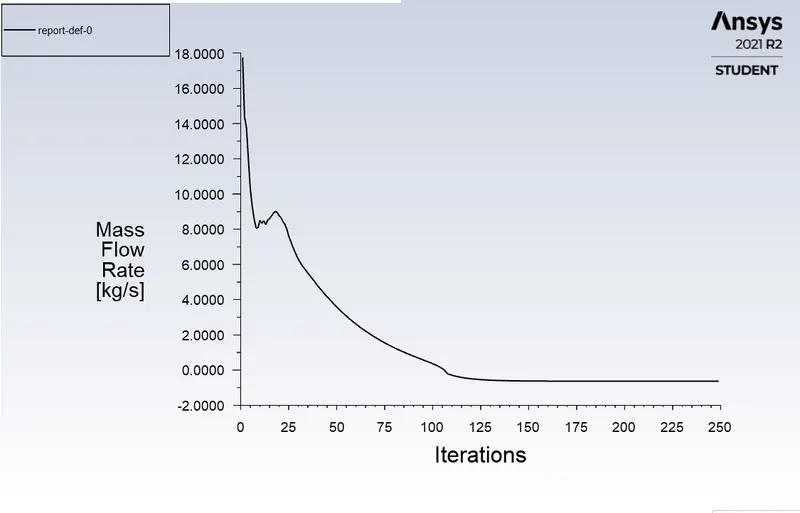
For 60mm Gate height
Velocity contour
Pressure contour
Mass flow rate
Residual plot
For 80mm Gate height
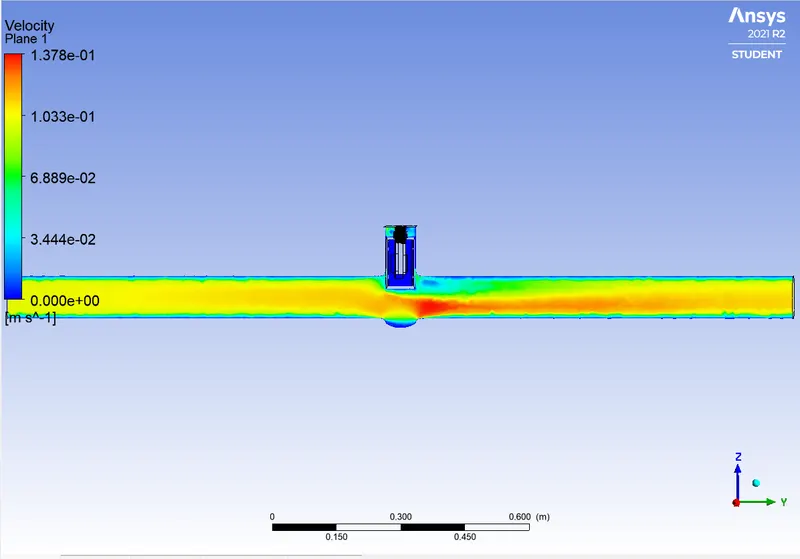
Velocity contour
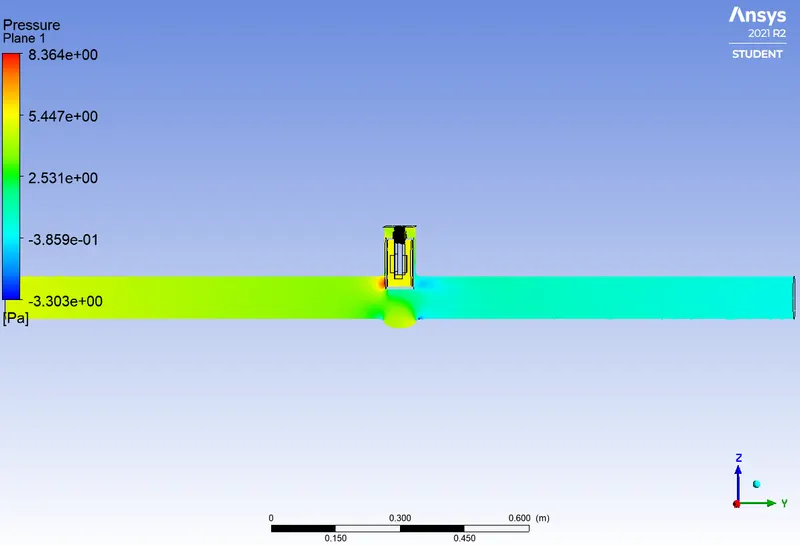
Pressure contour
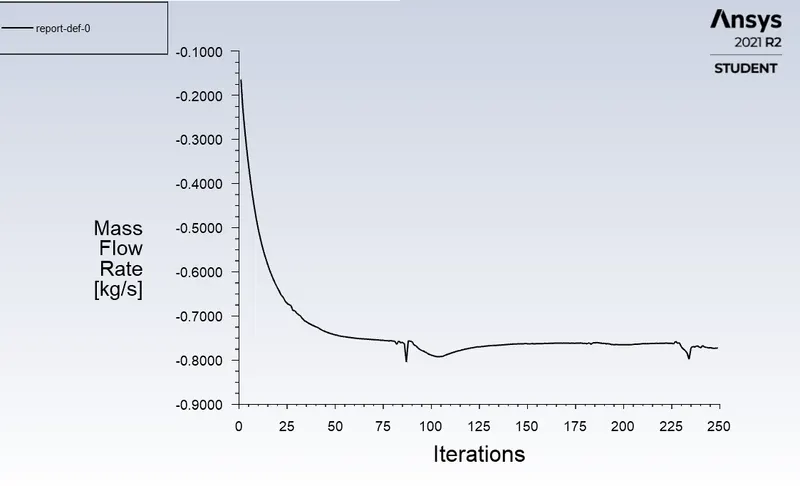
Mass flow rate
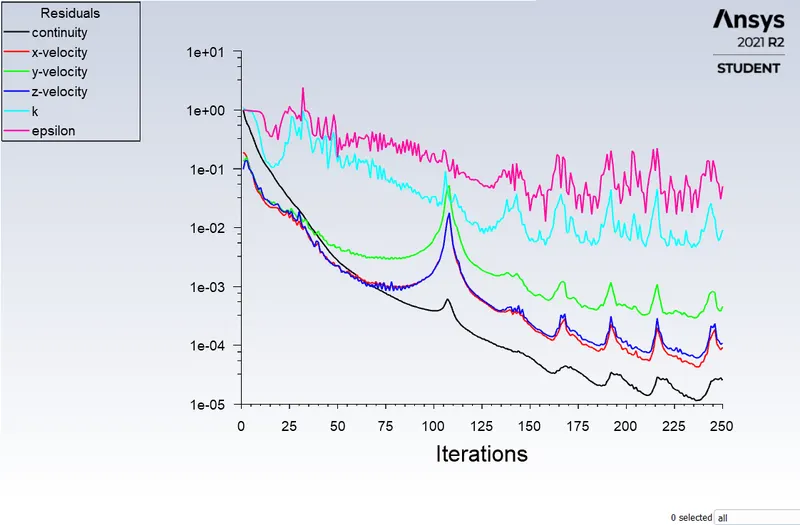
Residual plot
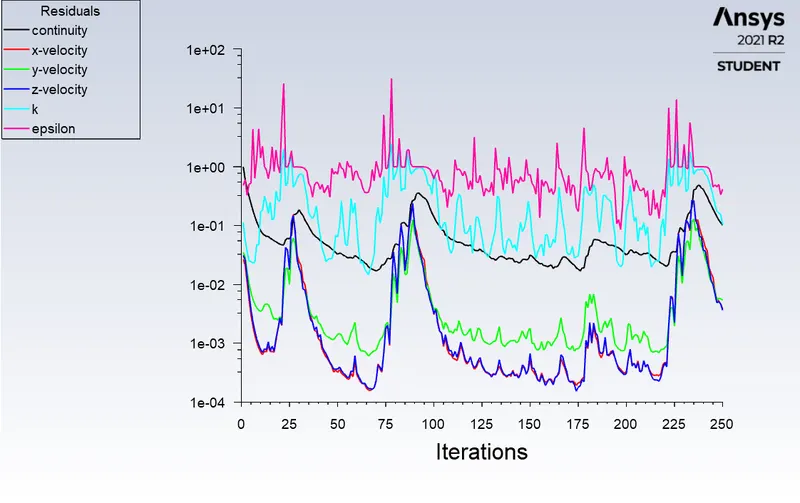
Flow Coefficient and flow factor
The flow coefficient of the valve is defined as the efficiency of the gate valve to allow the fluid with respect to the opening.
That is flow coefficient is the relation between the pressure drop inlet and the outlet and the related flow rate.
The formula for flow factor is
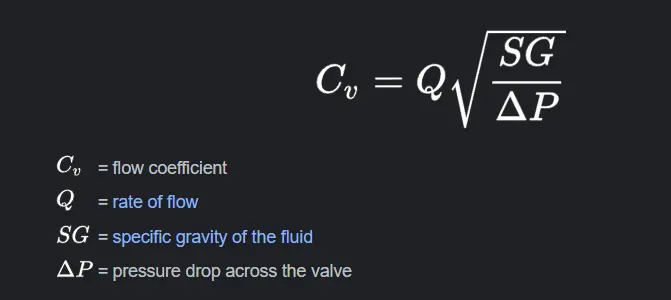
where Q is gallons per minute (1kg/s = 15.85 gpm)
Delta P = 10 ( 10-0 = 10)
for water SG = 1
The Flow factor is
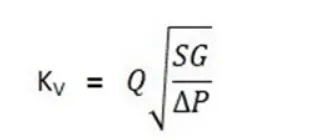
Kv = 0.865 * Cv
Results
Conclusion
. The mass flow rate increases with the increase of gate valve height, as a result, flow coefficient and flow factor too increase.