Week 9 - Parametric study on Gate valve.
Objectives
perform a parametric study on the gate valve simulation by setting the opening from 10 % to 80%.
- Obtain the mass flow rates at the outlet for each design point.
- Calculate the flow coefficient and flow factor for each opening and plot the graph.
- Discuss the results of the mass flow rate and flow coefficient.
Introduction
Gate valves work by inserting a rectangular gate or wedge into the path of a flowing fluid. They are operated by a threaded stem which connects the actuator (generally a hand wheel or motor) to the stem of the gate. If the valve has a rising stem its position can be seen just by looking at the position of the stem.
When fully open, a gate valve has no obstruction in the flow path and so has a very low pressure drop. If the fluid is very viscous a special type of gate valve known as a knife gate valve can be used.
One reason that gate valves are not normally used to regulate flow is that the flow rate of the fluid is not proportional to the amount that the valve is open. Moreover, a partially open gate valve may suffer from vibration in which the valve may move from its assigned position. Also the gate and seat may be subject to excessive wear if the valve is partially open.
Parts of a typical gate valve
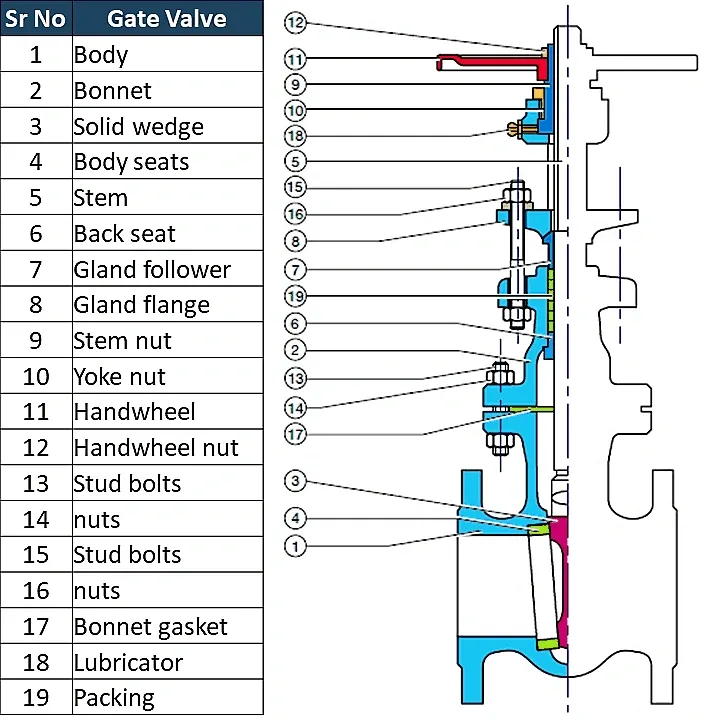
Gate valves are classified based on the following
- Types of Disk
- Solid taper wedge
- Flexible wedge
- Split wedge or Parallel disks Valve
- Types of Body Bonnet Joint
- Screwed Bonnet
- Bolted-Bonnet
- Welded-Bonnet
- Pressure-Seal Bonnet
- Types of Stem movement
- Rising Stem or OS & Y Type (Outside Stem and Screw Type)
- Non-rising Stem type
Flow coefficient,Cv
The flow coefficient of a device is a relative measure of its efficiency at allowing fluid flow. It describes the relationship between the pressure drop across an orifice valve or other assembly and the corresponding flow rate.
The flow coefficient - Cv - is based on the imperial units system and is defined as:
- the flow of water through a valve at 60 oF in US gallon/minute at a pressure drop of 1 lb/in2
Mathematically the flow coefficient Cv (or flow-capacity rating of valve) can be expressed as :
- `C_v=Qroot 2((SG)/(DeltaP)`
where:
- Q is the rate of flow (expressed in US gallons per minute),
- SG is the specific gravity of the fluid (for water = 1),
- ΔP is the pressure drop across the valve (expressed in psi).
`C_v = 1.16K_v`
Flow factor,Kv
The metric equivalent flow factor (Kv) is calculated using metric units :
- the flow of water with temperature ranging 5 - 30 oC through a valve in cubic meters per hour (m3/h) with a pressure drop of 1 bar

where
- Kv is the flow factor
 ).
). - Q is the flowrate [
 ]),
]), - SG is the specific gravity of the fluid (for water = 1),
- ∆P is the differential pressure across the device (expressed in [bar]).
Kv can be calculated from Cv using the equation:

Geometry
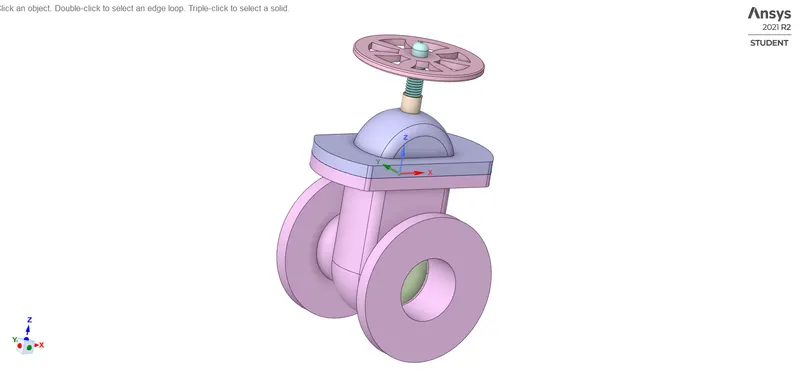
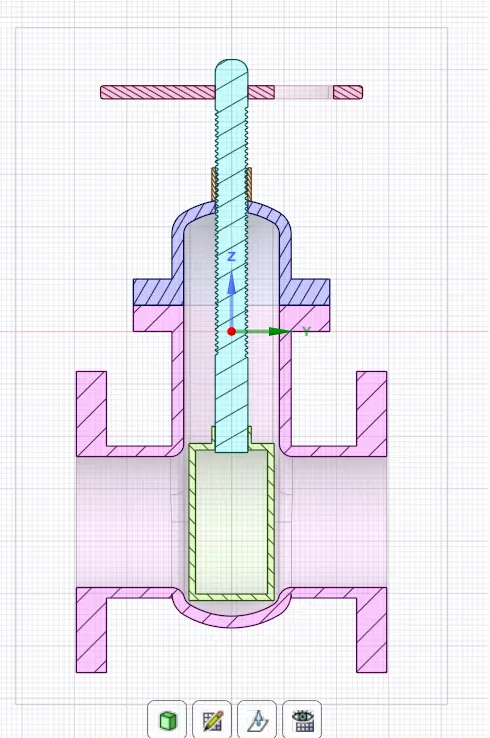
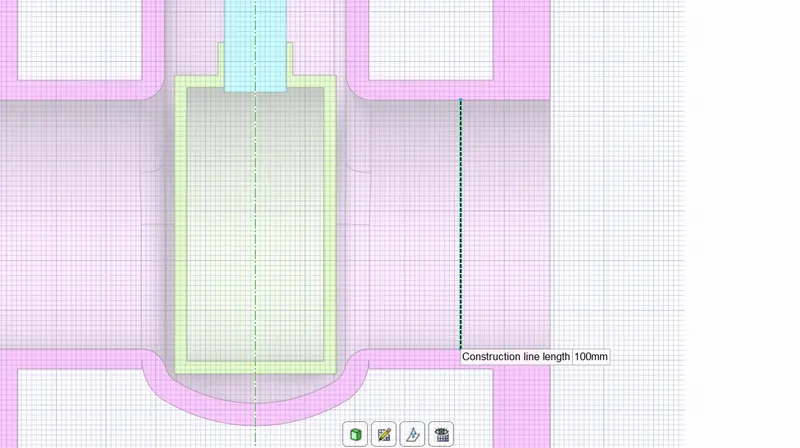
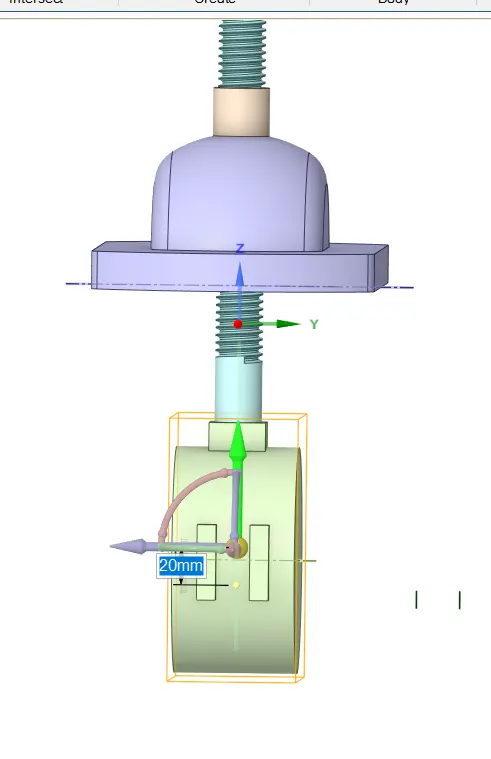
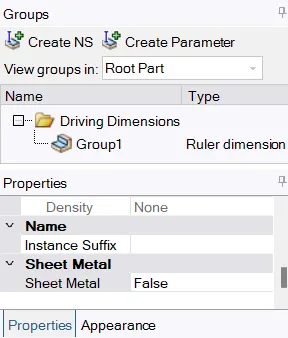
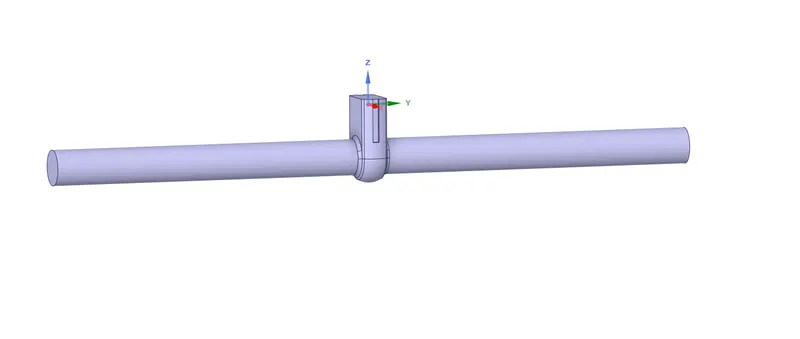
- First of all we have to input an initial lift of 10 mm (10 % of lift ) , for that Move option in y-direction is selected and 10 mm is given. Then it is parametrised by pressing P button next to the input given for lift or it can be created in the groups tab
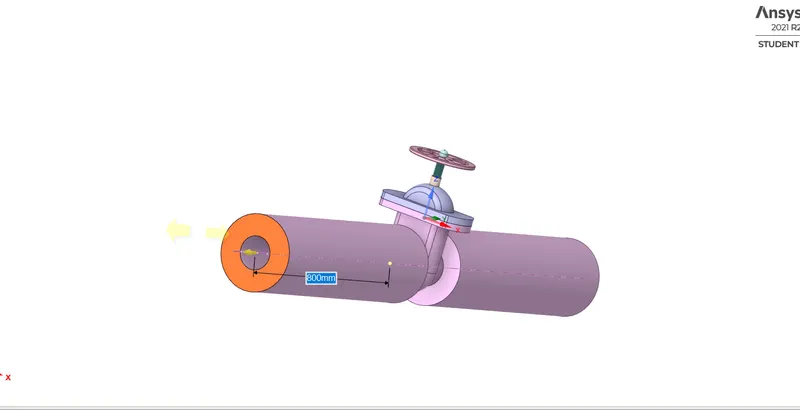
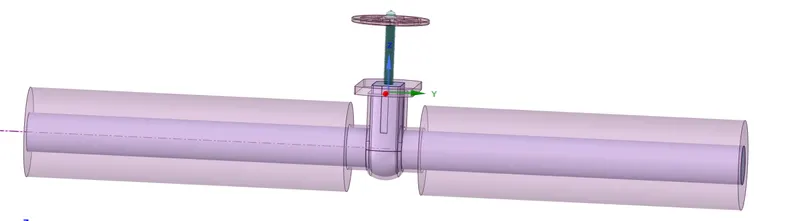
- Then fluid volume is extracted using edge selection , the bottom part is elongated upto 800mm on outlet and inlet to increase the fluid volume hence flow can be visualised in more detail
- The solid parts are then suppressed
Mesh
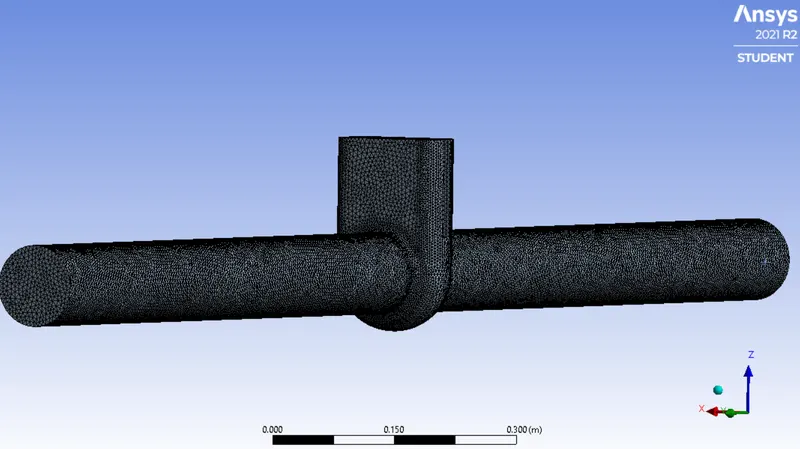
- A mesh size of 5.5e-3 m is given
- Outlet and Inlet is named accordingly
Setup
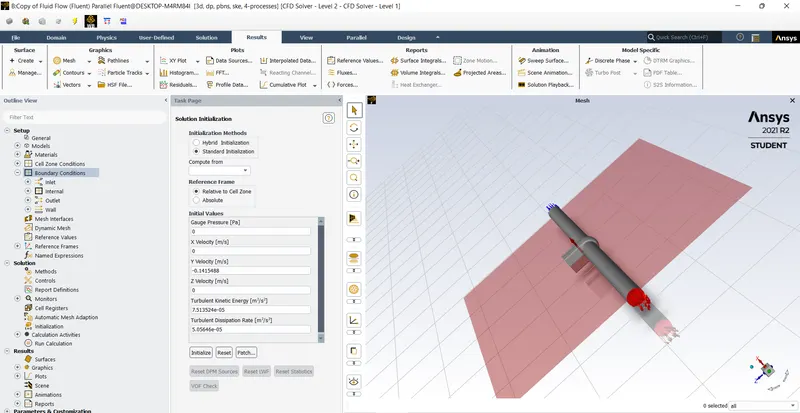
- Gravity is enabled
- Steady state analysis is chosen
- Material is set to water and the air is deleted
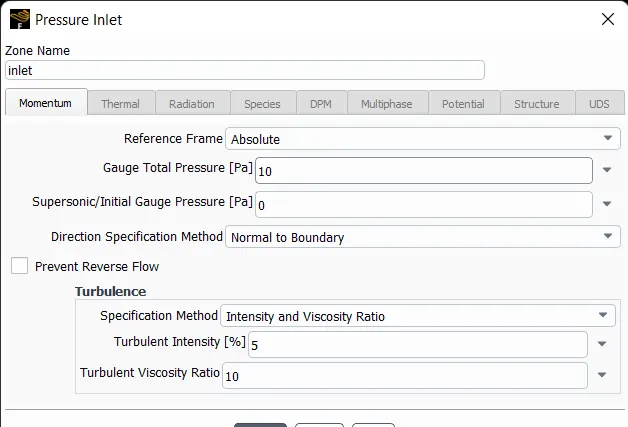
- Inlet boundary conditon is changed from Velocity-inlet type to Pressure-inlet and a 10 pa of inlet pressure is given which is an acceptable value for a flow through a pipe
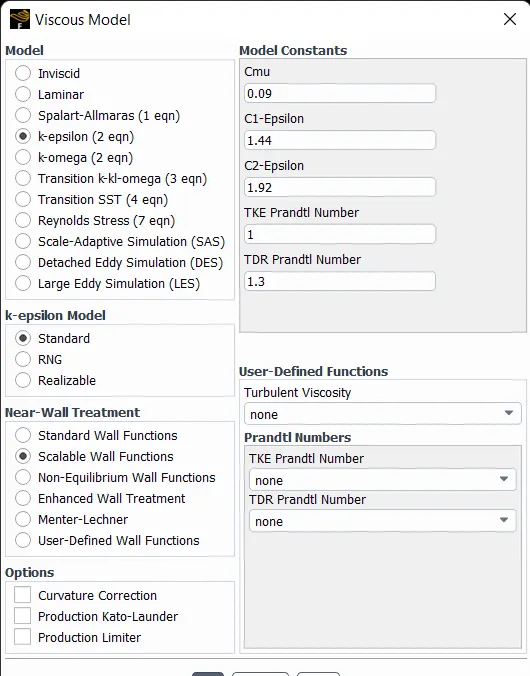
- Viscous model is set to K-epsilon - realisable-enhanced wall treatment since the flow is found to be turbulent
- For report definitions mass flow rate at outlet is monitored
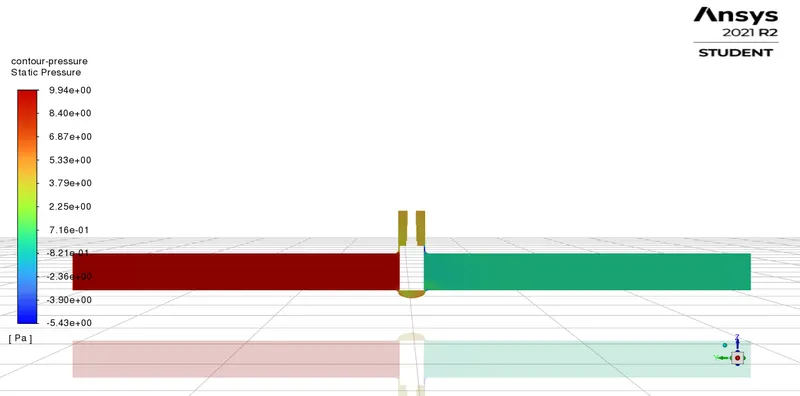
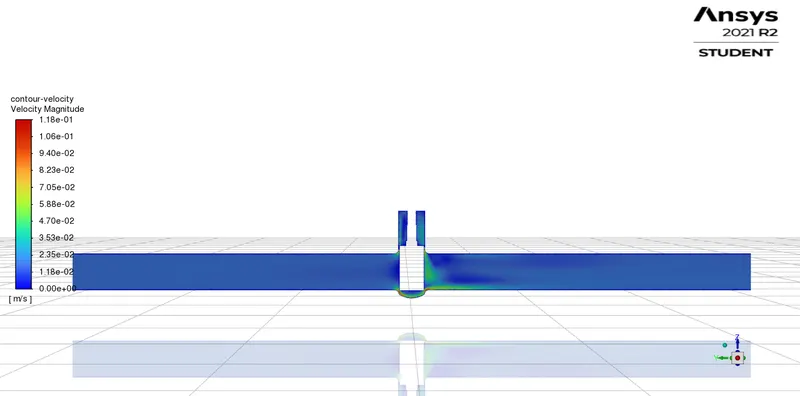
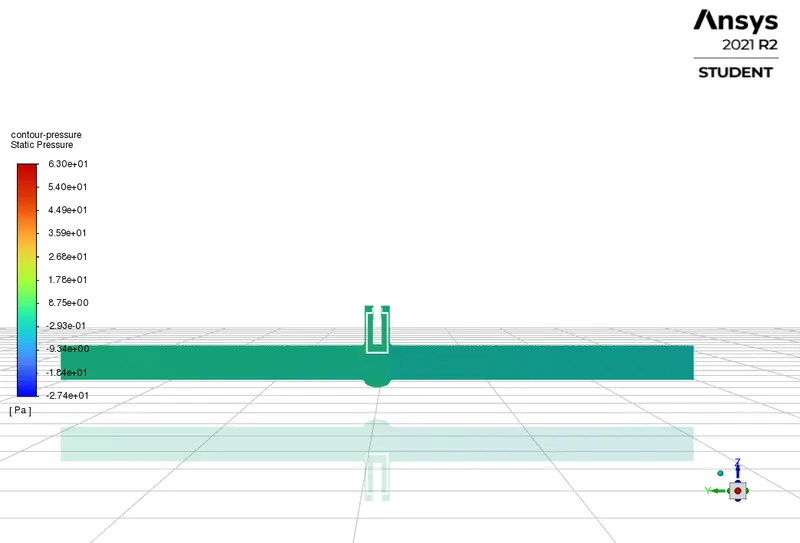
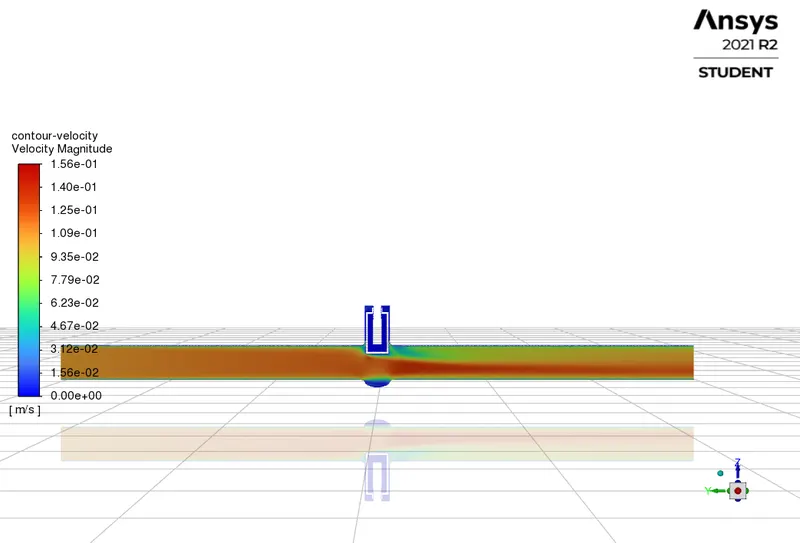
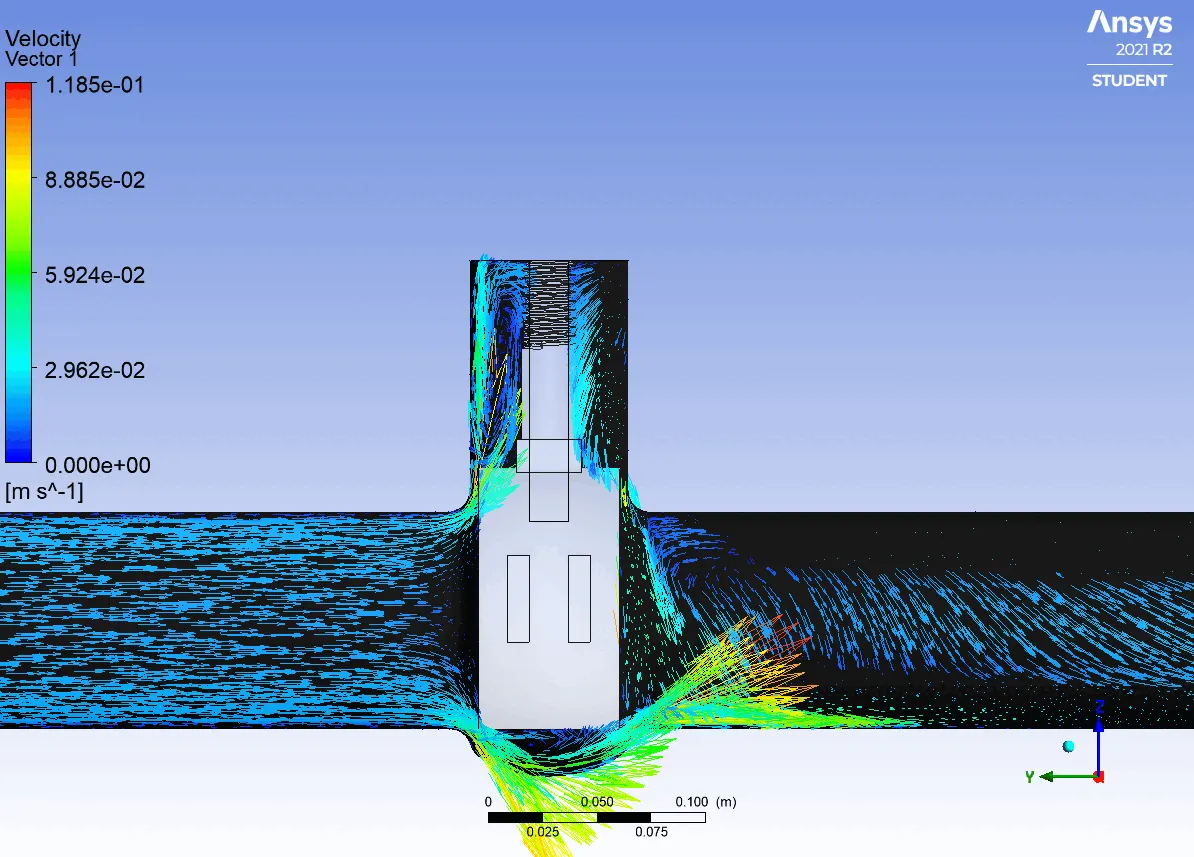
- A plane is created to create a velocity and pressure contour at the cross-section
Outputs
Case 1 :- Lift height 10% (10 mm)

Case 2 :- Lift height 20% (20 mm)
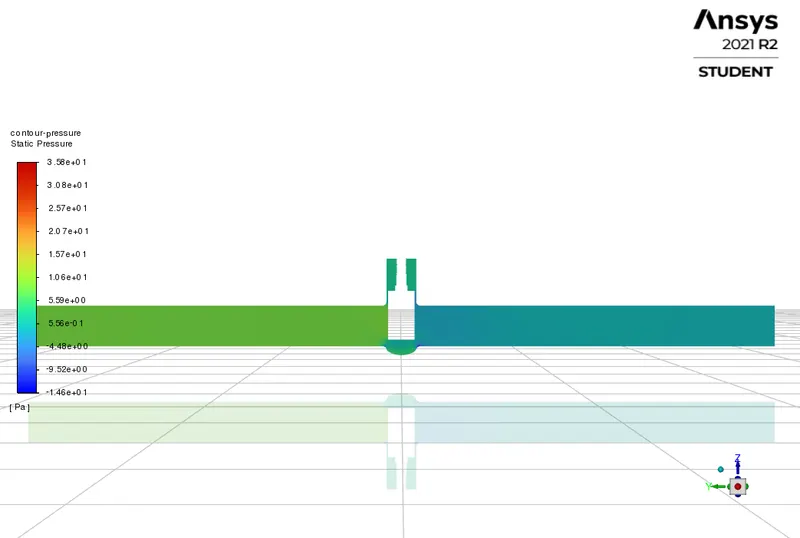
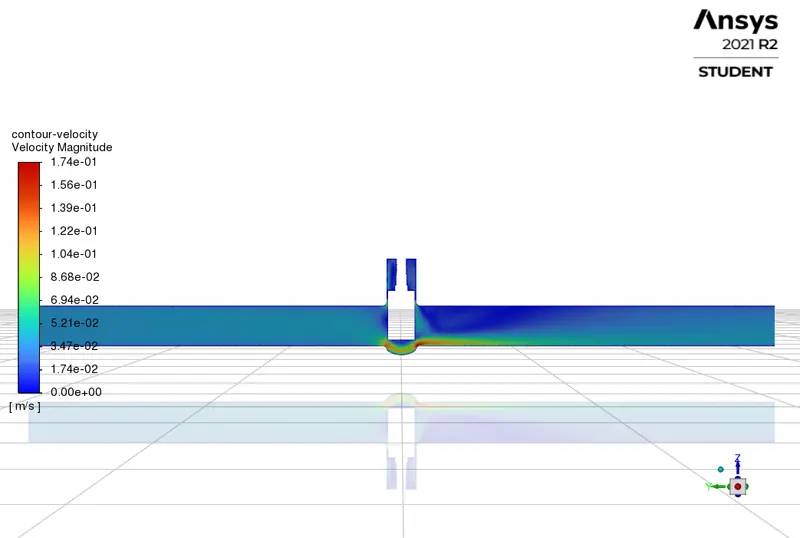

Case 3 :- Lift height 30% (30 mm)
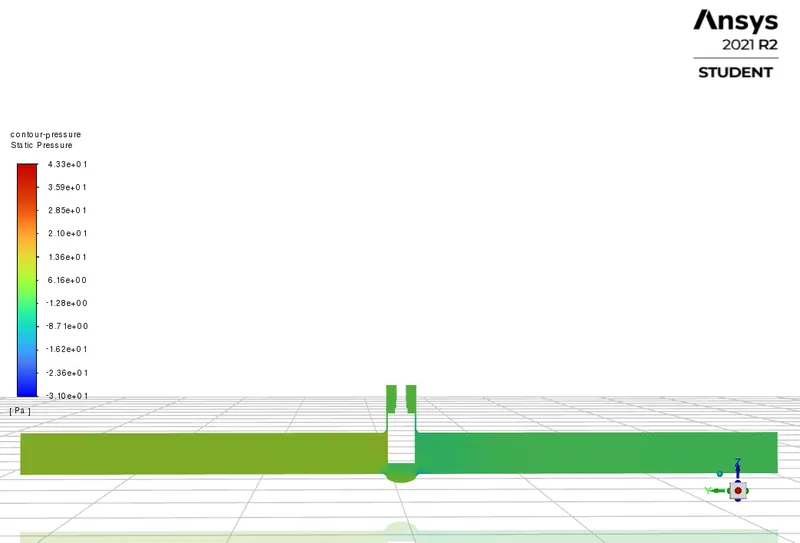
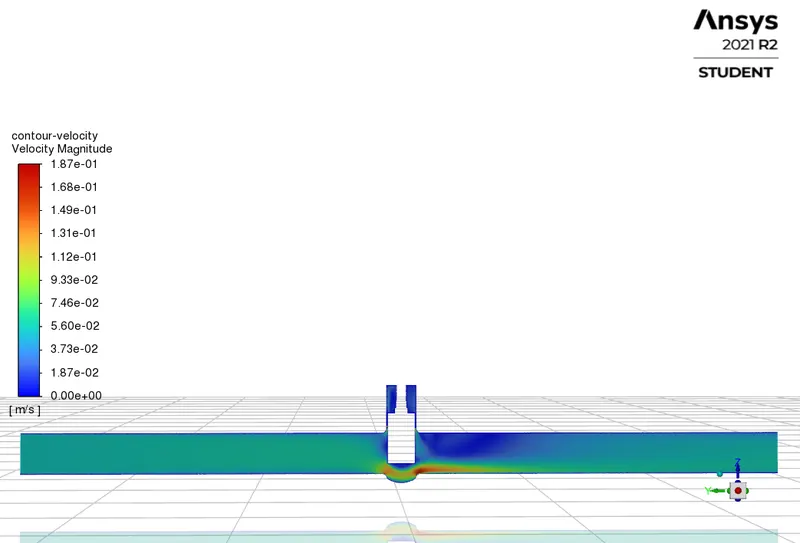

Case 4 :- Lift height 40% (40 mm)
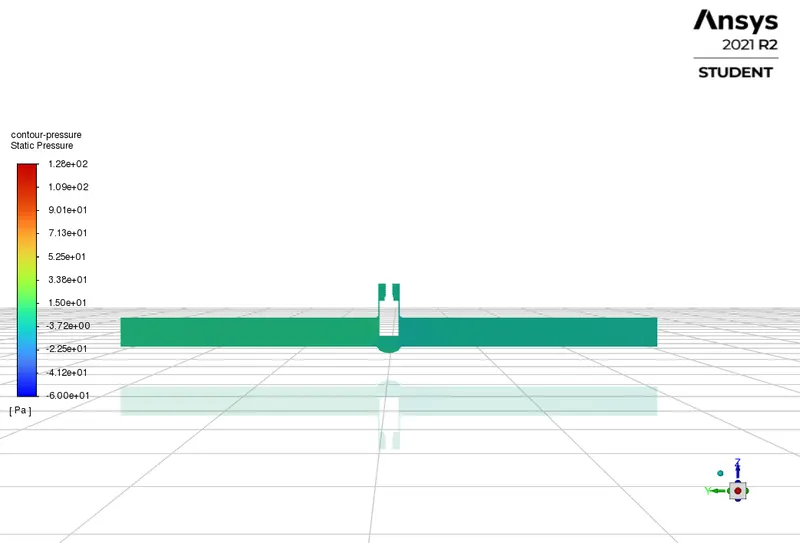
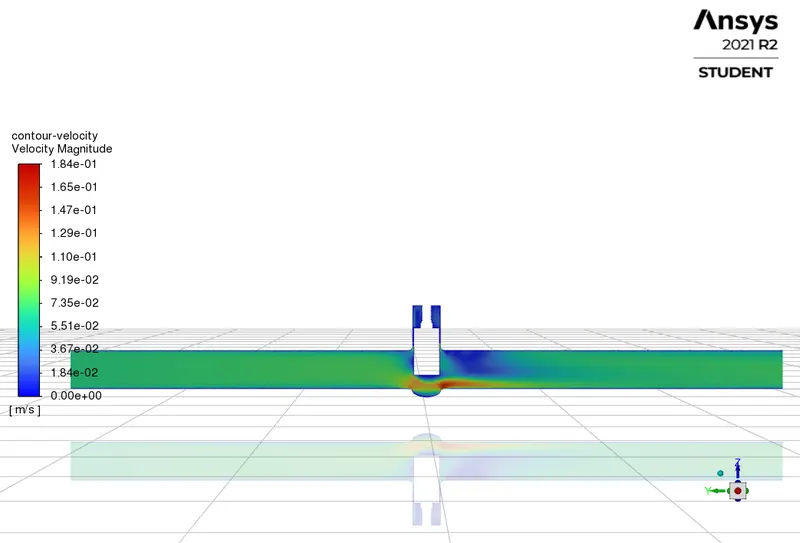

Case 5 :- Lift height 50% (50 mm)
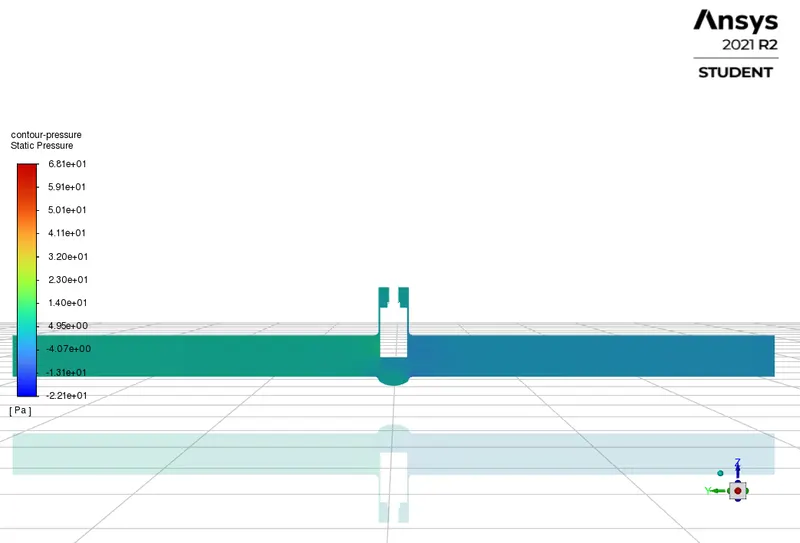
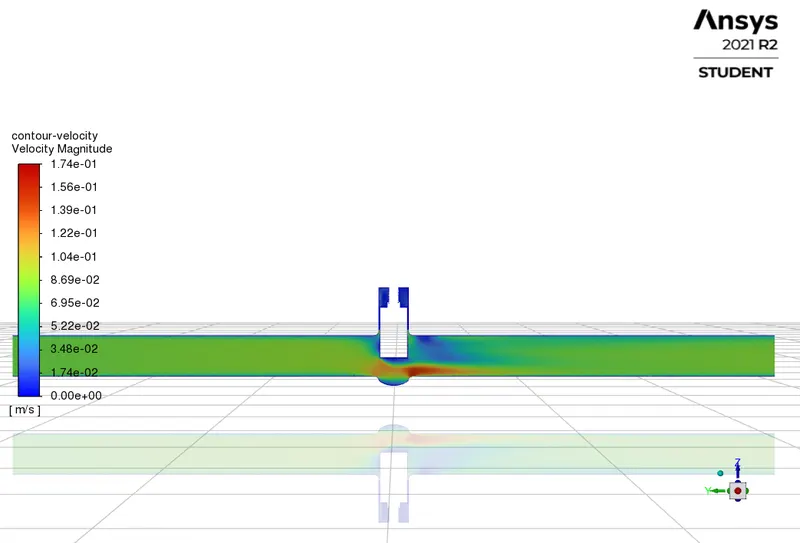

Case 6 :- Lift height 60% (60 mm)
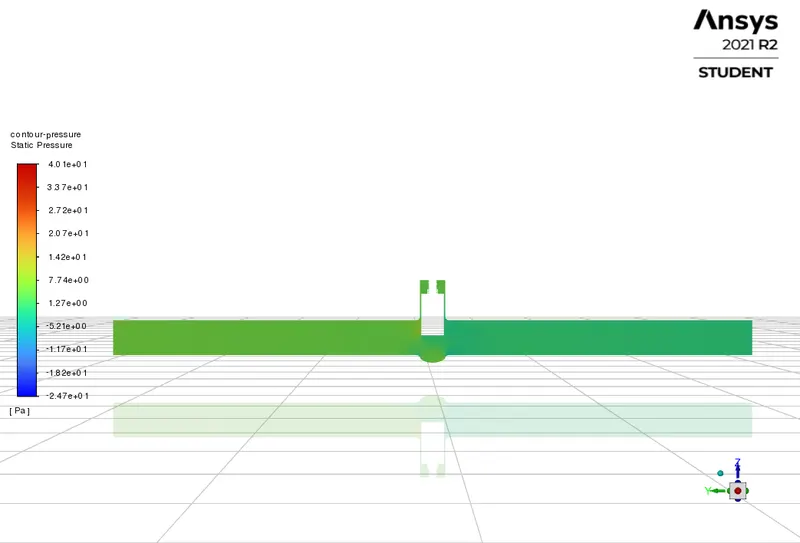
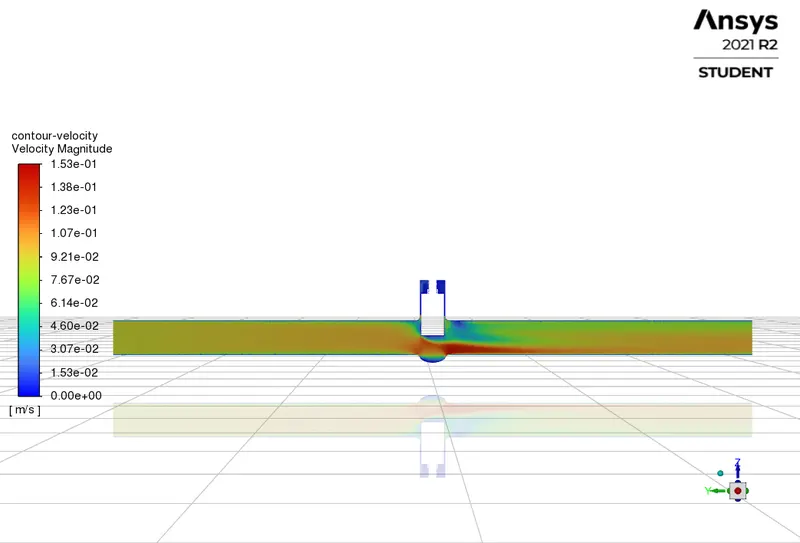

Case 7 :- Lift height 70% (70 mm)
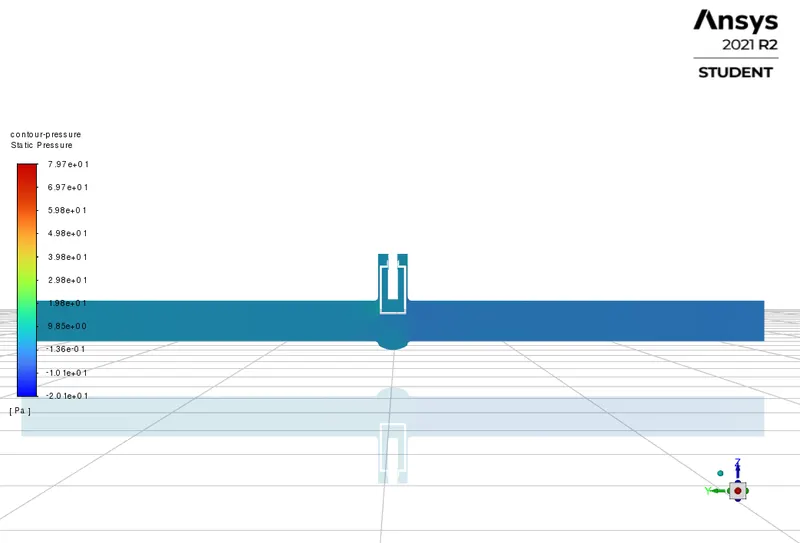
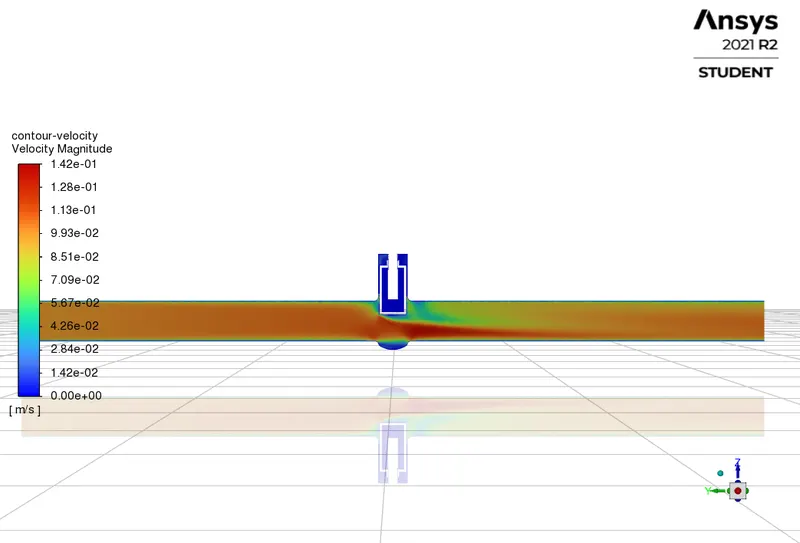

Case 8 :- Lift height 80% (80 mm)

For flow factor calculation the pressure is converted from pascals to bar
10 pa = 0.0001 bar
Since SG for water = 1
`sqrt((SG)/(Deltap)` = `root2(1/0.0001)` = 100
Now we can find the flow factor by simply multiplyng the above term with flow rate
| Lifted Height | Flow rate (`m^3/(hr)` | Flow factor,Kv | Flow coefficient,Cv |
| 10 | 0.522324 | 52.2324 | 60.5895 |
| 20 | 1.116396 | 111.396 | 129.219 |
| 30 | 1.5588 | 155.88 | 180.82 |
| 40 | 1.930248 | 193.025 | 223.909 |
| 50 | 2.2165920000000003 | 221.66 | 257.1256 |
| 60 | 2.517048 | 251.7 | 291.972 |
| 70 | 2.733984 | 273.4 | 317.144 |
| 80 | 3.0043800000000003 | 300.438 | 348.508 |
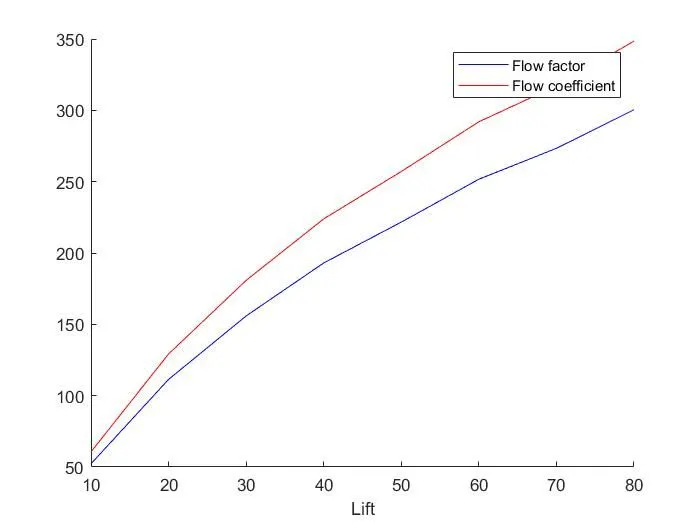
Using the above data we can plot a graph Using matlab
The code is as follows
%x -axis
 x = [10 20 30 40 50 60 70 80]
 %flow factor
 Kv = [52.2324 111.396 155.88 193.025 221.66 251.7 273.4 300.438]
 %flow coefficient
 Cv = [60.5895 129.219 180.82 223.909 257.1256 291.972 317.144 348.508]

%To plot
figure; hold on
a1 = plot(x,Kv,'color','b'); M1 = "Flow factor";
a2 = plot(x,Cv,'color','r'); M2 = "Flow coefficient";
legend([a1,a2], [M1, M2])
xlabel('Lift')
The graph
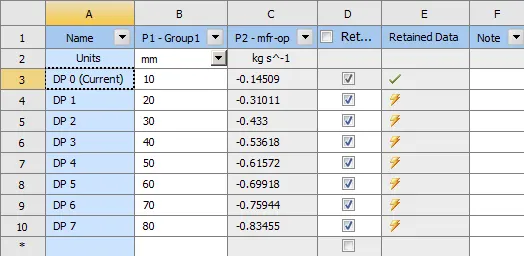
Obtained mass flow rates
- X axis in the above graph represents Lift height and Y axis represents values for Flow factor and coeffcient of flow
- Negetive sign in the mass flow rate indicates the fluid is flowing away from the geometry
- Obtained mass flow rates at different lifts
- As expected the mass flow rate is higher at high level of lift
- Similarly the Flow factor and flow coeffecients are higher levels of lifts
- So the flow factor or Flow coefficient indicates how much the pipe allows the fluid to flow through it
Conclusion
- Found the mass flow rates at different levels of lift height (10% to 80%)
- Found flow factor and flow coeffcient for all the stated cases
- A graph is plotted using Lift heigh Vs Flow factor and Flow coeffcient
- Necessory contours have been obtained
References