Week 9 - Mini project - Flow over an Airfoil
1. Introduction
An airfoil (or aerofoil) can be described as the cross-sectional shape of an object whose motion through a typically gaseous medium would lead to generating a significant amount of lift force which is usually more so than the drag force with the former (lift force) acting in a direction perpendicular with respect to the relative freestream velocity while the latter being parallel to it. Airfoils are typically constructed to be streamline in nature and have different features, depending on the travelling speeds, such that its profile can be defined on parameters including the chord length, camber and angle of attack that specifies the straight line connecting the leading and trailing edges, asymmetry between the top and bottom surfaces of the airfoil and the angle between the chord line of the airfoil and the vector representing the relative position between the airfoil and the incoming gaseous medium respectively, among many others. The National Advisory Committee for Aeronautics (NACA) series can be considered as one of the widely used schemes that particularly describes the airfoil geometries, based on purely digits like the 4-series or a combination of digits and alphabet(s) like the 7-series, and is being regularly employed to develop aircraft wings.
The aim of this challenge was to perform two-dimensional, steady-state simulations, comparing the predictions of drag and lift coefficients for four different angles of attack i.e., 1°, 5°, 10° and 15° respectively, using two different turbulence models, in this case Realizable k-`epsilon` (RKE) and k-`omega` SST (SSTKW), for a NACA 4-series airfoil viz., NACA 2412. Digits in the NACA 4-series airfoils describe different aspects wherein the first digit represents the maximum camber as a percentage of the chord length, second digit indicates the distance of maximum camber from the airfoil's leading edge as a tenth of the chord and the last two digits specifies the maximum thickness of the airfoil as a percentage of the chord length. This implies that a NACA 2412 airfoil comprises of 2% maximum camber positioned at 40% chord length (or 0.4 times the chord length) from the leading edge and a maximum thickness of 12% of the chord length. The numerical analysis of a NACA 2412 airfoil also involved computing results for a similar base grid size outlining total cell count as well as mesh quality attributes like skewness, non-orthogonality, and aspect ratio. Additionally, pressure field plots and velocity magnitude glyphs and streamlines were created in the vicinity of the airfoil that aided in the identification of separation and recirculation regions.
2. Method
The typical approach adopted to performing numerical simulations in CONVERGE CFD involves the following steps:
- Creating a new folder dedicated to running the concerned project inside a user-preferred directory.
- Setting up the relevant case file(s) in Converge Studio v3.0 that involves creation of the fluid volume domain i.e., the virtual wind tunnel surrounding the NACA 2412 airfoil, setting up the required application type, choosing material and its state (in this case gas) for which simulation is to be performed along with the requisite properties, defining simulation parameters such as solver types, monitor variables and convergence tolerances, defining region, boundary conditions and initial conditions, specifying the physical models whose equations are intended to be solved, determining and allocating the base grid size values and lastly selecting the variables for post-processing at the required cycles for steady-state along with any hidden parameters or UDF selection as part of advanced parameters.
- Saving the case file(s) and exporting the input files into the folder created for running the concerned project which typically includes 'boundary.in' for the various boundary conditions, 'material_state.dat' where material_state points to 'gas' (in this case), 'initialize.in' specifying initial conditions, 'inputs.in' defining the various input conditions and file writing intervals, 'monitor_steady_state.in' to assign monitor variables for the steady state simulation, 'turbulence.in' containing information about the turbulence model selected and its associated constants, 'post.in' for the different post-processing variables, 'solver.in' describing the solver chosen and its equations, and 'surface.dat' containing datasets about the surface while other input files with respect to the state of the material, thermal properties and species may also be part of the exporting process and should be ensured that they are selected for the simulation to run.
- Running the simulation in a Cygwin64 terminal window.
- Post-converting 3D output data by navigating to the output folder created within the same project folder during the simulation run or by clicking the 'Post-Processing 3D' button in Converge Studio v3.0.
The simulation run and post-converting processes were executed using Linux-type commands in a Cygwin64 terminal window as shown below:
i) Change directory to the project containing the relevant case file(s):
cd "PATH_TO_CONCERNED_PROJECT_FOLDER"
ii) Confirm the contents of the project for the exported input files:
ls
iii) Performing simulation run with the converge executable application on multiple processors (in this case, 4) using mpiexec executable file in the background (by adding ampersand operator) along with posting output into a logfile:
mpiexec.exe -n 4 converge.exe restricted </dev/null> logfile &
iv) Checking for simulation status with regards to completion or errors:
tail logfile
v) Post-converting the 3D output data files using the 'post_convert_30_msmpi_64' utility on multiple processors (in this case, 4) using mpiexec executable file from within the output folder of the project containing the exported input files:
cd output
mpiexec.exe -n 4 post_convert_30_msmpi_64
2.1 Modelling
The NACA 2412 airfoil and the computational domain for simulating air flow movement over it was modelled in Converge Studio v3.0. Construction of the NACA 2412 airfoil was implemented using the points data in the DAT file from Airfoil Tools [1] such that its first and second columns represented the x and y coordinates respectively traversing the length from the trailing edge to the leading edge and back to the trailing edge for different vertices. The dimensions of the computational domain (or virtual wind tunnel) were taken to be such that the position of the inlet from the leading edge of the NACA 2412 airfoil is sufficiently long, in this case 20 times the chord length, to allow the incoming velocity profile to impose on the airfoil while the outlet from its trailing edge is located to be significantly far away i.e., at 30 times the chord length, to avoid interactions of the outflow boundary conditions with respect to the airfoil that could affect the intended calculations as well as to improve numerical stability and top and bottom walls are each at 15 times the chord length away from either the leading or the trailing edges. This led to identifying the extents of the computational domain in terms of the coordinate positions for individual vertices by accessing the 'Vertex' tab when the 'Create' button is clicked on followed by patching them with the points defining the airfoil profile as an 'Ordered vertex list' and closing any open edges using the 'List of edges' item with the 'By Open Edge' option selected, both of which are present as 'Patch Options' within the 'Repair' button functionality, to create a single surface of the entire model before creating an identical copy of the same at a planar position of 0.5m along the z-axis direction and closing the space between the two surfaces using the 'Triangle Copy Type' under the 'Copy Tab' and 'Loft edges' items respectively as part of the 'Create' button feature list such that all of the operations mentioned are available under the 'Geometry' dock. The basic element entity in CONVERGE is denoted by a triangle which would be visible by clicking on any of the surfaces of the recently drawn model and in order to demarcate boundaries, the corresponding triangles need to be grouped together. The grouping and creation of new boundaries process began with clicking on the 'Boundary' button under the 'Geometry' dock which was followed by clicking on the '+' symbol from which the pop-out message would read as 'Create a new boundary.' leading to the 'Boundary definition' window to open in which the option 'Create multiple boundaries' was checked with number of boundaries as 6, in this case, followed by lastly grouping the triangles that constitute a given surface and naming them accordingly, such as 'Inlet', 'Outlet', 'Front2D', 'Back2D', 'Symmetry' and 'Airfoil' as illustrated in Fig. 1. Moreover, the normal from each of the triangular surface is required to point towards the fluid domain which was ensured by first visualising the same using the 'Normal toggle' button accessible in the 'View Toolbar' and depending on the direction along which the normal is pointing, a decision was taken by clicking on the 'Normal' tab within the 'Transform' button under the 'Geometry' dock and selecting the suitable option from one of the three 'Transform Normal Options' followed by clicking on the 'Apply' button. Angle of attack could also be altered to any specific value by entering the same in the 'Rotation Angle' placeholder when the 'Selected Boundary Entity Type' was enabled within the 'Rotate' tab as part of the 'Transform' button functionality under the 'Geometry' dock followed by choosing the relevant 'Rotation Axis' and selecting the 'Airfoil' boundary. At this stage and for the given numerical analysis, the modelling requirements were achieved, however, to validate if the model was clean i.e., it contains no intersecting edges, overlapping triangles or any other form of geometrical constraints, a check was performed by clicking on the 'Find' button in the 'Diagnosis' dock to observe for any anomalous 'Problem Triangles' and rectify the same.
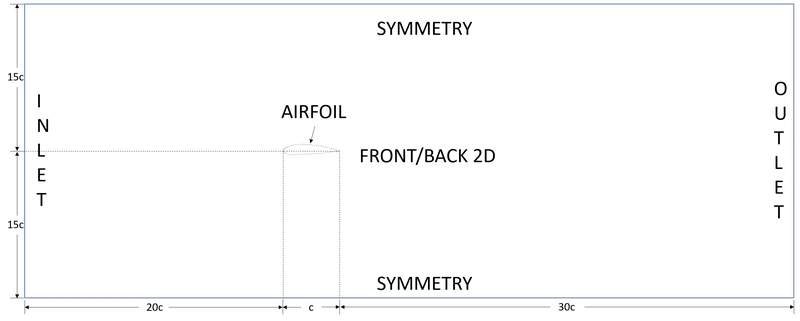
Fig. 1: Fluid Volume Model and Boundary Conditions regions in two-dimensional space where 'c' represents chord length of the NACA 2412 airfoil (Representative image not to scale)
2.2 Meshing
The meshing approach adopted for the given computational domain was developed to maintain the meshing quality attributes viz., aspect ratio, skewness, and non-orthogonality as outlined in the CONVERGE 3.0 Manual [2] provided in the following table:
|
Aspect Ratio |
1 (Ideal Value) |
||
|
Skewness |
0° (Ideal Value) |
< 70° (Acceptable) |
`>=` 90° (Likely to cause simulation failure) |
|
Non-Orthogonality |
0° (Ideal Value) |
< 70° (Acceptable) |
`>=` 90° (Likely to cause simulation failure) |
Table 1: Mesh Quality Attributes as defined in the CONVERGE 3.0 Manual [2]
The reason for pursuing the above mentioned mesh quality attributes, as specified in Table 1, can be ascertained on the fact that whether the discretized domain was likely to create convergence issues during the solution process and also to identify areas in the mesh where the statistics can be improved based on the underlying physics. In Section 2.3.4.2 Mesh Refinement approach, detailed discussion about the refined mesh that was prepared and its mesh qualities at different angles of attack has been highlighted.
2.3 CFD Simulation Setup, Boundary Conditions, Monitoring Variables, Determination of flow velocity from given Reynolds number and Solution
The simulations on a single mesh configuration for different angles of attack were performed using the Reynolds Averaged Navier-Stokes (RANS) models, in this case, the k-`epsilon` turbulence models and k-`omega` turbulence models. The use of k-`epsilon` turbulence models and k-`omega` turbulence models, more specifically the RKE and the SSTKW turbulence models respectively, is attributed to the fact that the Reynolds number, based on the given flow conditions, lies in the turbulence flow region with the former more suitable for high Reynolds number attached flows while the latter for low Reynolds number flows, however, both being similarly capable of predicting the physics involved for fluid flows exhibiting boundary layer separation, vortex shedding and also stalling conditions. A brief description into the working of the RKE and SSTKW turbulence models is provided below:
2.3.1 RKE turbulence model
The RKE turbulence model proposed by Shih et al., 1995 [3] is considered as an upgrade to the standard k-`epsilon` turbulence model while sharing the similarities of consisting two transport equations, one for the turbulent kinetic energy (k) to evaluate the energy in turbulence and the other for the turbulent dissipation (`epsilon`) to calculate the rate of dissipation of turbulent kinetic energy (k), however notable differences are present as mentioned below:
- The turbulent viscosity term is formulated differently in the RKE turbulence model.
- The dissipation rate `epsilon` in the transport equation has been modified and developed from the exact equation for transport of mean-square vorticity fluctuation.
The RKE turbulence model is able to satisfy some of the mathematical constraints of the Reynolds's stresses such as the positive values of normal stresses when the eddy viscosity definition is used in the Boussinesq relationship and Schwarz inequality for shear stresses even when the main strain rate is large which otherwise would be negative. These formulations in the RKE turbulence model have made them more popular to use over the other k-`epsilon` turbulence models especially when flow features include the presence of strong streamline curvature, vortices, rotation, boundary layers under the influence of strong and adverse pressure gradients, separation and recirculation.
2.3.1.1 Setup of the RKE turbulence model:
To use the RKE turbulence model in Converge Studio v3.0, we navigate to Physical Models option in the Case Setup tree followed by checking the 'Turbulence modeling' box to enable inclusion of turbulence terms in the solution of governing fluid equations and then selecting the Reynolds Averaged Navier-Stokes (RANS) item in the 'Turbulence modeling' window available under the Physical Models option with 'Turbulence model' drop-down menu set to 'Realizable k-`epsilon`' and 'Near Wall treatment' switched to 'Scalable wall function' while all other variables/parameters and constants remained unaltered with respect to their original values.
2.3.2 SSTKW turbulence model
The k-`omega` turbulence model consists of two transport equations to measure the convection and diffusion properties of turbulent energy viz., the turbulent kinetic energy (k) term, similar to the one in the k-`epsilon` turbulence models, to evaluate the energy in turbulence and `omega` to determine the turbulence scale. The `omega` equation in the standard k-`omega` turbulence model has a major downside in the form of a high sensitivity of the solution dependent on the freestream values of k and `omega` outside the shear layer. This drawback has been addressed particularly well by the SSTKW turbulence model, developed by Menter et al., 2003 [4], wherein it combines terms of the `omega` and `epsilon` equation. Within the freestream, the SSTKW turbulence model makes use of the `epsilon` equation which is where the `omega` equation is most sensitive to while in the rest of the region the `omega` equation is made use of. This switching behaviour of the SSTKW turbulence model makes it particularly effective in dealing with adverse pressure gradient and separating flow related applications. Also, when compared with the k-`epsilon` turbulence model, the effects of turbulence in stagnation and strong acceleration zones are relatively smaller. The SST model in the SSTKW turbulence model deals with the calculation of the principal shear stress in adverse pressure gradient boundary layers.
2.3.1.2 Setup of the SSTKW turbulence model:
The k-`omega` model is available under the same Physical Models option in the Case Setup tree when the 'Turbulence modeling' box is checked on followed by selecting the Reynolds Averaged Navier-Stokes (RANS) item in the 'Turbulence modeling' window available under the Physical Models option with 'Turbulence model' drop-down menu set to 'k-`omega` SST' and 'Near Wall treatment' retained at its default selection of 'Automatic wall function' while all other variables/parameters and constants remained unaltered with respect to their original values.
2.3.3 Boundary Conditions and Monitoring Variables
The different boundary conditions for the computational domain wherein the NACA 2412 airfoil is subjected to external air flow is described in the following table:
|
Names |
Inlet |
Front2D |
Back2D |
Symmetry |
Airfoil |
Outlet |
|
Type |
INFLOW |
TWO_D |
TWO_D |
-- |
WALL |
OUTFLOW |
|
Pressure Boundary Condition |
Zero normal gradient (NE) |
-- |
-- |
-- |
-- |
Specified Value (DI) |
|
Pressure Magnitude (Pa) |
-- |
-- |
-- |
-- |
-- |
101325 |
|
Velocity Boundary Condition |
Specified Value (DI) |
-- |
-- |
-- |
-- |
Zero normal gradient (NE) |
|
Velocity Magnitude (m/s) |
(u v w) `-=` (31.5655 0 0) |
-- |
-- |
-- |
-- |
-- |
|
Temperature Boundary Condition |
Specified Value (DI) |
-- | -- | -- |
Zero normal gradient (NE) |
-- |
|
Temperature Backflow |
-- |
-- | -- | -- |
-- |
Specified Value (DI) |
|
Temperature Magnitude (K) |
300 |
-- |
-- |
-- |
-- |
300 |
|
Species Boundary Condition |
Specified Value (DI) |
-- |
-- |
-- |
-- |
Specified Value (DI) |
|
Species Name: `O_2` |
0.23 |
-- |
-- |
-- |
-- |
0.23 |
|
Species Name: `N_2` |
0.77 |
-- |
-- |
-- |
-- |
0.77 |
|
Wall motion type |
-- |
-- |
-- | -- |
Stationary |
-- |
|
Surface Movement |
-- |
-- |
-- | -- |
Fixed, Law of wall |
-- |
|
Turbulent Kinetic Energy (tke) |
Intensity, 0.01 fraction |
-- |
-- | -- |
Zero normal gradient (NE) |
-- |
|
Turbulent Dissipation (eps) |
Length scale, 0.00043916m |
-- |
-- | -- |
Wall model |
-- |
|
Turbulent Kinetic Energy (tke) Backflow |
-- |
-- | -- | -- | -- | Intensity, 0.01 fraction |
|
Turbulent Dissipation (eps) Backflow |
-- |
-- | -- | -- | -- | Length scale, 0.00043916m |
|
Near wall treatment |
-- |
-- | -- | -- |
Standard wall function (RKE) Automatic wall function (SSTKW) |
-- |
|
Law of wall roughness parameters; Absolute roughness |
-- |
-- | -- | -- | 0.0m | -- |
|
Law of wall roughness parameters; Roughness constant |
-- |
-- | -- | -- | 0.5 | -- |
Table 2: Boundary Conditions for the computational domain wherein the NACA 2412 airfoil model is subjected to external air flow defined using the 'Boundary' sub-option of the 'Boundary Conditions' under the 'Case Setup' tree
For the given problem, the simulation was chosen as 'Gas simulation' enabled in the 'Materials' option in the 'Case Setup' tree with 'Predefined mixtures' set to 'Air' and 'Species (not in mech.dat)' option enabled to utilise the mass fraction values of `O_2` and `N_2` as they represent the major constituting species in air by mass fraction. Since, 'Gas simulation' option was checked in the 'Materials' option, an equation of state was required to be defined that formulates a coupling relationship between the different state variables such as density and physical conditions such as pressure and temperature to depict the state of matter. In the given numerical analysis, the Redlich-Kwong (RK) cubic equation of state was set to in the 'Equation of state' drop-down menu with its default values of critical temperature (`T_c`) and critical pressure (`p_c`) retained at '133.0 K' and '3770000.0 Pa' respectively as it is a simpler form of representation in comparison to the Redlich-Kwong-Soave and Peng-Robinson set of equations but more accurate than the ideal gas law which works best for gases at low pressures, however, at higher pressures tends to report huge deviations in its predictions as it assumes that the molecular volume is very small and that neither attraction or repulsion exists between the molecules which is not true in the case of real gases. Additionally, the real gas properties would behave as a function of temperature which was again set to as the default option in the 'Gas simulation' window. The values of 'Turbulent Prandtl number' and 'Turbulent Schmidt number' were left unchanged at their default values of 0.9 and 0.78 respectively.
In regards to specifying the turbulence intensity and turbulence length scale values, it was decided to choose a low turbulence intensity value of 1% and length scale of 0.4 times the boundary layer thickness as part of an external flow simulation setup. During the solution process, a monitor variable was created to observe the behaviour of flow-field variables viz., velocity and pressure, by selecting 'AVG_VELOCITY' from the list of 'Monitor Variables' available by default with 'Target Type' and 'Target' set to 'Boundary' and 'Outlet' respectively and file name' as 'mass_avg_flow.out' from the 'File Name' drop-down menu. The settings of the remaining parameters for the reporting of the monitor plots included entering values of 'Minimum number of cycles to be executed for the steady-state solver' and 'Sample size, cyc' such that the given solution would run for at least 18000 cycles regardless of whether a state of convergence would have been achieved prior to it and 1000 number of samples to decide if the concerned variable has reached steady-state condition with 'Monitor start delay, cyc' having a value of 0 before clicking on the 'Validate' and 'OK' buttons. Additionally, the 'Boundaries only' option was selected under the 'Wall Output' list of the 'Output files' sub-option of the 'Output/Post-Processing' item under the 'Case Setup' tree to visualise the drag and lift forces acting on the surface of the NACA 2412 airfoil.
2.3.4 Determination of flow velocity from Reynolds number, Boundary layer thickness and First Cell Height
2.3.4.1 Determination of flow velocity from Reynolds number
Reynolds number (based on chord length of the NACA 2412 airfoil):
`Re = (U*L*rho)/mu`; where (Eq. 1)
`U` is the freestream velocity,
`L` is the characteristic length, in this case, the chord length,
`rho` is density of fluid, and
`mu` is the dynamic viscosity of fluid
Substituting the value of characteristic length as chord length of 0.1m, and density and dynamic viscosity of air at 1atm or 101235 Pa and 300K (or 26.85°C) as 1.1766 `(kg)/(m^3)` and `1.857*10^-5 (kg)/(m.s)` [5] respectively into (Eq. 1), a corresponding flow velocity for Reynolds number of 200000 was estimated as 31.5655m/s. The reason for determining the flow velocity at the inlet of the given computational domain was to supply the value obtained as an input for the velocity boundary condition at the same surface.
2.3.4.2 Mesh Refinement approach
Boundary layer thickness, in case of turbulent flow, is usually dependent on experiments and/or empirical relations as it difficult to predict the same because of the intense mixing of different layers involved within it. Since, the value of Reynolds number based on the characteristic length for the chord length indicates that the flow is in the transitional regime but the nature of the boundary layer is laminar as the given Reynolds number does not exceed the engineering critical Reynolds number of `5*10^(5)` with respect to smooth flat plate geometrical considerations, the corresponding boundary layer thickness can be determined using the mathematical expression shown below:
`(delta/L) = 4.91/(Re_L)^(1/2)`; where (Eq. 2)
`delta` is the boundary layer thickness, and
`Re_L` is the local Reynolds number at a point, in this case simply the Reynolds number based on the chord length
For the given Reynolds number and chord length dimensional value, the turbulent boundary layer thickness using Eq. 2 is determined to be 0.0010979m. To perform calculations for `y^+` value, the values of wall shear stress and frictional velocity were required to be calculated as shown below:
Wall Shear Stress:
`tau_w=(1/2)⋅C_f⋅rho⋅(U_∞)^2`; where (Eq. 3)
`tau_w` is Wall shear stress,
`C_f` is Skin Friction coefficient,
`U_∞` is the freestream velocity, in this case the calculated value of inlet boundary velocity
Skin Friction Coefficient (`C_f`), according to Blasius [6], for external flows can be related to the Reynolds number as shown below:
`C_f = 0.664/(sqrt (Re_x))`, where (Eq. 4)
`Re_x` represents Reynolds number at a distance 'x' from the leading edge in the direction of flow
Frictional velocity (`U_tau`) can be computed mathematically as:
`U_tau=sqrt(tau_w/rho)` (Eq. 5)
For local Reynolds number of 200000 with the previously mentioned values of dynamic viscosity, density and free-stream velocity, the skin-friction coefficient (`C_f`), wall shear stress (`tau_w`) and friction velocity (`U_tau`) values were calculated using (Eq. 4), (Eq. 3) and (Eq. 5) respectively as shown in the following table:
|
Local Reynolds Number |
Skin-friction Coefficient (`C_f`) |
Wall Shear Stress (`tau_w`)[kg m^-1 s^-2] |
Friction Velocity (`U_tau`)[m s^-1] |
|
200000 |
`1.485*10^(-3)` |
0.8705 |
0.8601 |
Table 3: Skin-friction coefficient, wall shear stress and friction velocity values for the governing flow conditions of the computational domain wherein the NACA 2412 airfoil model is subjected to external air flow
Calculation of cell-centroid size (`y_P`), First Cell Height (`Delta_y`) and embed scale with respect to Base Grid Size:
`y^+` is defined as the non-dimensional wall distance for a wall bounded flow that can be expressed mathematically as:
`y^+=(ρ*U_tau*y_P)/mu`; where (Eq. 6)
`y_P` is distance from the cell-centroid 'P' to the wall
Simplifying (Eq. 6) to determine `y_P`, we get;
`y_P=(y^+*mu)/(U_tau*rho)` (Eq. 7)
Since, `y^+` is computed at the cell-centroid, the first cell height (`Delta_y`) can accordingly be mathematically expressed as:
`Delta_y = 2*y_P` (Eq. 8)
The initial approach adopted for evaluating the distance from the cell-centroid 'P' to the wall (`y_P`) and correspondingly the first cell height (`Delta_y`) was to target a `y^+` value such that the first grid cell would lie in the range of 30<`y^+`<300 for the RKE turbulence model and `y^+<=`1 for the SSTKW turbulence model respectively so as to implement the wall modelling strategy for the log-law layer using the standard wall function approach in case of the former (RKE turbulence model) while wall resolving for the viscous sublayer in case of the latter. However, due to constraints in computational resources, including limitations in number of mesh cells to 500000, and only 4 cores available on the author's PC, each steady-state simulation was estimated to take upwards of 2 hours of actual run time, derived from a single run for a coarse mesh, and therefore, it was decided to prepare a single mesh wherein the empirically estimated `y^+` value was computed to be less than 30 implying the use of Scalable wall function for the RKE turbulence model and Automatic wall function in case of the SSTKW turbulence model so as to accommodate for the appropriate relaxation of the log-law assumption.
From the CONVERGE 3.0 Manual [2], the mathematical formulation relating the embed size with the base grid size based on embed scale can be given by:
`embed = (base grid)/(2^(EMBED SCALE))`; where (Eq. 9)
`base grid` is the Base Grid Size defined for every element across the domain,
`EMBED SCALE` is the scaling parameter by which the base grid size is to be refined either at the selected boundary, geometrical shape or region, and
`embed` is the scaled down or refined grid size, in this case also equal to the First Cell Height i.e., `Delta_y`,
The missing variable in (Eq. 9) is `EMBED SCALE` and therefore equating for the same variable was required with regards to the given grid size.
|
Turbulence Model |
Mesh |
dx(m) |
dy(m) |
dz(m) |
|
RKE |
1 |
0.0125 |
0.0125 |
0.0125 |
|
SSTKW |
1 |
0.0125 | 0.0125 | 0.0125 |
Table 4: Mesh size representing spatial grid discretization values across each of the three-directional axes
|
Turbulence Model |
Mesh |
`EMBED SCALE` |
Embed Layers |
Initial First Cell Height (`Delta_y`)[m] |
Initial Target `y^+` (`y_P`) |
|
RKE |
1 |
3.644 |
1.0979 |
0.001 |
~27.248 |
| SSTKW |
1 |
3.644 |
1.0979 |
0.001 |
~27.248 |
Table 5: Base Grid and its transition w.r.t initial First Cell Height (`Delta_y`), `EMBED SCALE`, Target `y^+`(`y_P`) and Embed Layers for mesh 1 configuration of the computational domain wherein the NACA 2412 airfoil model is subjected to external air flow
It should be noted that the value of `EMBED SCALE` is required to be a positive integer and therefore the values indicated in Table 5 above were rounded off and consequently new first cell height (`Delta_y`) and target `y^+` were evaluated as is reported in Table 6 below. Similarly, the number of embed layers was initially determined based on the ratio of the calculated boundary layer thickness to the initial first cell height (`Delta_y`) and then recalculated based on the new first cell height (`Delta_y`) which subsequently was rounded off as here too only positive integer values were allowed.
|
Turbulence Model |
Mesh |
`EMBED SCALE` |
Embed Layers |
New First Cell Height (`Delta_y`)[m] |
New Target `y^+` (`y_P`) |
|
RKE |
1 |
4 |
1.4 ~ 2 |
0.00078125 |
~21.287 |
| SSTKW |
1 |
4 |
1.4 ~ 2 |
0.00078125 |
~21.287 |
Table 6: Base Grid and its transition w.r.t First Cell Height (`Delta_y`) for rounded-off `EMBED SCALE` and Embed Layers values, and new Target `y^+`(`y_P`) for mesh 1 configuration of the computational domain wherein the NACA 2412 airfoil model is subjected to external air flow
Mesh 1 for 1° Angle of Attack:
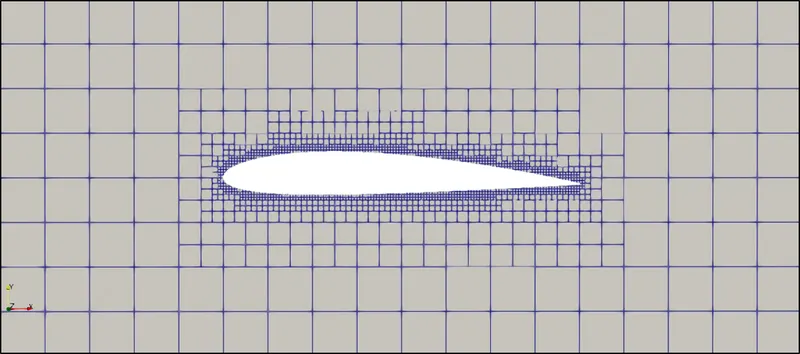
Fig. 2: Mesh 1 for 1° Angle of Attack
Mesh 1 for 5° Angle of Attack:
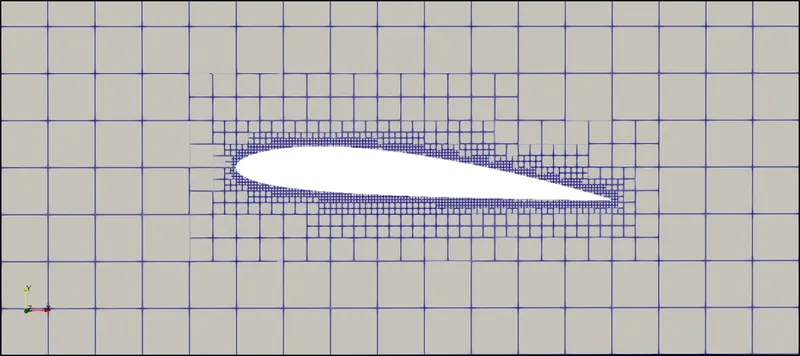
Fig. 3: Mesh 1 for 5° Angle of Attack
Mesh 1 for 10° Angle of Attack:
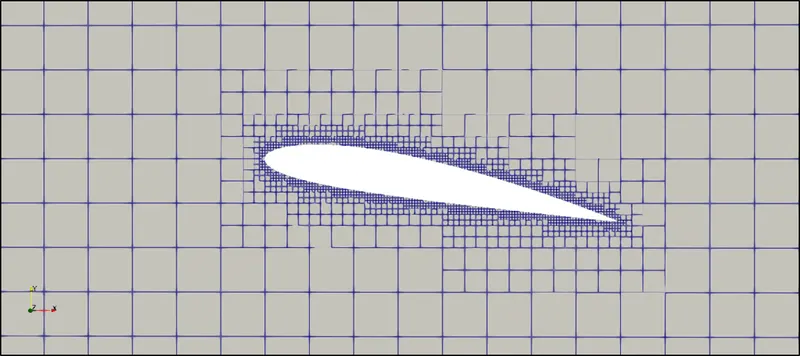
Fig. 4: Mesh 1 for 10° Angle of Attack
Mesh 1 for 15° Angle of Attack:
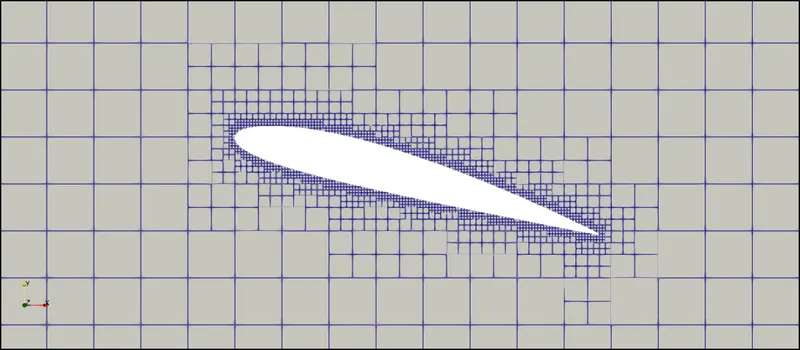
Fig. 5: Mesh 1 for 15° Angle of Attack
Mesh and time statistics, and pressure force values along the longitudinal and transverse directions on the NACA 2412 airfoil for different angles of attack on the same mesh configuration:
|
Mesh |
Turbulence Model |
AoA (°) |
Cells |
Run Time [s] |
Average `y^+` on the airfoil |
Minimum `y^+` on the airfoil |
Pressure Force (Drag) [N] |
Pressure Force (Lift) [N] |
|
1 |
RKE |
1 |
99151 |
7266.605 |
41.567 |
13.8038 | 1.06218 | 17.9001 |
|
1 |
SSTKW |
1 |
99151 |
8710.7152 |
52.7651 |
2.00488 |
0.616874 | 17.9234 |
|
1 |
RKE | 5 |
99166 |
12081.9053 |
41.4156 |
11.7764 |
2.04895 | 41.9763 |
|
1 |
SSTKW | 5 |
99166 |
8729.6517 |
52.002 |
13.0588 |
1.23169 | 43.5357 |
|
1 |
RKE | 10 |
99225 |
11249.738 |
31.9811 |
6.70582 |
5.05163 | 64.869 |
|
1 |
SSTKW | 10 |
99225 |
10198.3432 |
39.1741 |
2.31466 |
3.892 | 66.2735 |
|
1 |
RKE | 15 |
99192 |
11282.6123 |
25.4359 |
4.85279 |
11.0397 | 38.9433 |
|
1 |
SSTKW | 15 |
99192 |
10502.457 |
33.3225 |
6.98487 |
13.4859 | 42.4383 |
Table 7: Mesh and time statistics, and pressure force values along the longitudinal and transverse directions on the NACA 2412 airfoil for different angles of attack on the same mesh configuration
Mesh quality attributes for mesh 1 configuration of the computational domain wherein the NACA 2412 airfoil model is subjected to external air flow:
|
Mesh |
AoA (°) |
Max Aspect Ratio |
Max Skewness |
Max Non-Orthogonality |
|
1 |
1 |
3.0212 |
1.17578e-38 |
42.318 |
|
1 |
5 |
3.0198 |
1.17578e-38 |
44.4487 |
|
1 |
10 |
2.7215 |
1.17578e-38 |
48.1301 |
|
1 |
15 |
2.9093 |
1.17578e-38 |
43.1204 |
Table 8: Mesh quality attributes depicting the maximum values of aspect ratio, skewness and non-orthogonality for mesh 1 configuration of the computational domain wherein the NACA 2412 airfoil model is subjected to external air flow at different angles of attack
From Table 7, it can be seen that the prediction of drag and lift forces on the surface of NACA 2412 airfoil increases with the angle of attack from 1° to 10° while at 15° only the drag forces continues to rise but the lift forces drops for both turbulence models using the same mesh configuration implying the arrival of stalling conditions. It can also be observed that the minimum `y^+` values estimated for the same mesh configuration largely lies in the buffer region justifying the use of Scalable and Automatic wall functions as the near wall treatment modeling approach for both the RKE and SSTKW turbulence models respectively with respect to the given problem, however, they differ at different angles of attack, as is the slightly varying number of cells, and this may be attributed to the cells cut at the boundary using the cartesian cut-cell approach. Additionally, mesh quality attributes of the same mesh configuration for different angles of attack prepared in Table 8 indicates that they lie in the range of acceptable value for skewness, as previously stated in Table 1, with aspect ratio initially decreasing with increase in angle of attack until 10° before increasing for 15° but deteriorates for non-orthogonality as the maximum angle made between the vector connecting two cell centers and the normal of the shared face, especially close to the airfoil, increases with increase in angle of attack.
2.5 Post-Processing
The extended part of the solution process using Converge Studio v3.0 included selecting the variables of interest whose quantitative and qualitative aspects would highlight the behaviour of the flow, in this case within the given fluid domain and over the NACA 2412 airfoil at different angles of attack, and they can be chosen by clicking on the 'Post variable selection' sub-option of the 'Output/Post-Processing' setting under the 'Case Setup' tree and checking the boxes 'Density', 'Mesh Quality', 'Pressure', 'Temperature' and 'Velocity' in the 'Typical Variables' section and 'Region ID' in the 'Geometry/Location' section of the 'Typical Variables/Geometry' tab, 'Turbulent Kinetic Energy', 'Turbulent Length Scale', 'Turbulent Viscosity', 'Dissipation Rate of tke (eps)', 'Specific Dissipation Rate of tke (omega)' and '`y^+`' in the 'Turbulence' section of the 'Combustion/Turbulence' tab, and adding 'Mass Fraction' under 'Species' section of the 'Species/Passive' tab for `O_2` and `N_2` species with respect to the concerned numerical analysis. Visualising the different flow variable quantities for a two-dimensional flow problem in ParaView required the creation of a slice of the given fluid domain by using the "Slice" tool in the 'Commons' toolbar typically located above the 'Pipeline Browser' window based on default layout settings and choosing 'Z Normal' under 'Plane Parameters' section to align the plane normal to the x-axis direction such that the entire domain was viewed in the direction of flow followed by unchecking the 'Show Plane', 'Triangulate the slice' and 'Merge duplicated points in the slice' boxes for disabling the viewing of the plane borders, production of triangles in the output and overlapping data points respectively. In order to evaluate the drag and lift coefficients of the NACA 2412 airfoil at different angles of attack, following expressions were created, before plotting them as seen in Fig. 18 and Fig. 19 respectively.
Expressions:
chord_length: 0.1
rho: 1.1766
U: 31.5655
C_D: drag_force/(0.5*rho*U^2*chord_length)
C_L: lift_force/(0.5*rho*U^2*chord_length)
Additionally, pressure (p) field plots were created to view the development of the flow field characteristics across the fluid domain and Stream Tracer was added for identifying the separation and recirculation regions around the NACA 2412 airfoil at different angles of attack. Legends, titles, and x and y labels were added for better understanding of the graphical representations.
2.6 Convergence Level
In the given numerical analysis, a steady-steady simulation was performed using a Density-based solver of type modified Pressure Implicit with Splitting of Operator (PISO) which is an iterative pressure-velocity coupling algorithm involving a predictor step for predicting solution of the momentum equation from which a pressure equation is obtained and solved whose correction is then consequently reapplied to the momentum equation such that this process continues until the desired level of accuracy is achieved. At the end of the momentum predictor and first corrector step, remaining transport equations are solved in series. In other words, momentum and pressure are solved at the first PISO iteration which enables calculation for velocity terms required by other transport equations and at the end of each iteration in the PISO loop, convergence criterion is checked for which in this case requires the density correction error term to be less than the value of PISO tolerance which remains unchanged for the given numerical simulation at its default value of 1e-03. The selection of solver types for the different equations within 'Solver parameter [Steady-state]' sub-option in the 'Simulation Parameters' settings under the 'Case Setup' tree included assigning SOR to Momentum, Density, Energy, Turbulent Kinetic Energy (tke), Turbulent dissipation rate (eps) (for the RKE turbulence model) and 'Specific Dissipation Rate (omega)' (for the SSTKW turbulence model) equations, and 'CONVERGE BiCGSTAB' to the Pressure equation. The SOR solver type is a generally preferred algorithm owing to its advantage in being computationally less expensive than the different forms of biconjugate gradient stabilized (BiCGSTAB) algorithms or HYBRID (wherever applicable) except for the pressure equation unless the number of iterations for this equation (pressure) is less than 15 on average making it suitable for cases that contains a compressible flow with smaller value of time-steps. However, for the concerned numerical simulation, the default 'CONVERGE BiCGSTAB' algorithm option was retained as it was difficult to estimate whether or not the pressure equation would always result in less than 15 iterations on average for the same mesh configuration but with the NACA 2412 airfoil at different angles of attack. BiCGSTAB algorithm works best in scenarios for which simulations approach convergence at a slower rate making it more suitable for multiphase flow simulations like volume of fluid (VOF). Also, as previously mentioned in Section 2.3.3 Boundary Conditions and Monitoring Variables, the behaviour of pressure forces (drag and lift) on the surface of the airfoil were being monitored as the quantities of interest to observe the variation in their values over successive cycles. The solver types, convergence tolerance limits, and minimum and maximum iterations defined for the equations corresponding to the RKE and SSTKW turbulence models and the monitor variable plots corresponding to the same mesh configuration but different angles of attack for the NACA 2412 airfoil are shown in the table and figures below:
|
Equations |
Solver Type |
Convergence Tolerance |
Minimum Iterations |
Maximum Iterations |
Preconditioner |
|
Momentum |
SOR |
1e-05 |
2 |
50 |
None |
|
Pressure |
CONVERGE BiCGSTAB |
1e-08 |
2 |
500 |
None |
|
Density |
SOR |
1e-04 |
2 |
20 |
None |
|
Energy |
SOR |
1e-04 |
2 |
20 |
None |
|
Turbulent Kinetic Energy (tke) |
SOR (pre-defined) |
1e-03 |
2 |
50 |
None (pre-defined) |
|
Turbulent dissipation rate (eps) |
SOR (pre-defined) | 1e-03 | 2 | 50 | None (pre-defined) |
|
Specific Dissipation Rate (omega) |
SOR (pre-defined) | 1e-03 | 2 | 50 | None (pre-defined) |
Table 9: Solver Types, Convergence Tolerance Values, Minimum and Maximum Iterations and Preconditioners of the different equations used in the RKE and SSTKW turbulence models
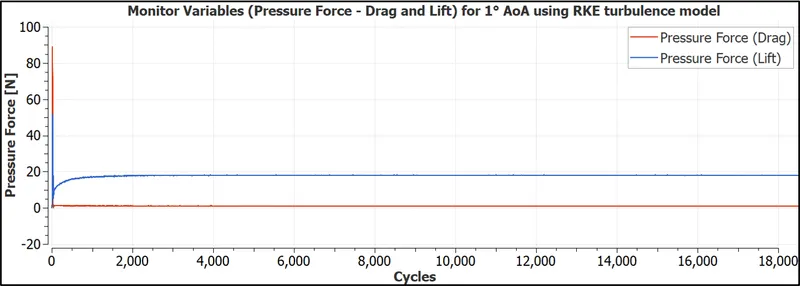
Fig. 6: Plots of pressure forces boundary variables on the NACA 2412 airfoil at 1° AoA for steady-state simulation using RKE turbulence model for mesh 1
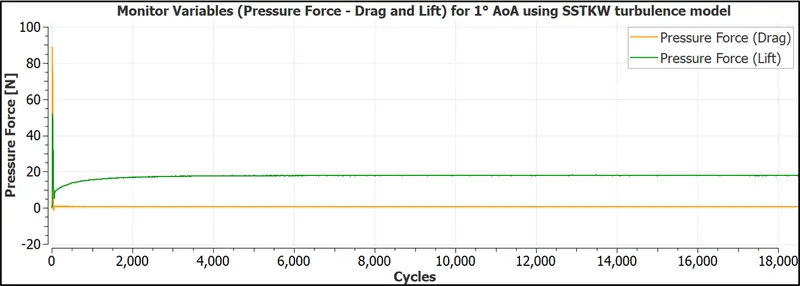
Fig. 7: Plots of pressure forces boundary variables on the NACA 2412 airfoil at 1° AoA for steady-state simulation using SSTKW turbulence model for mesh 1
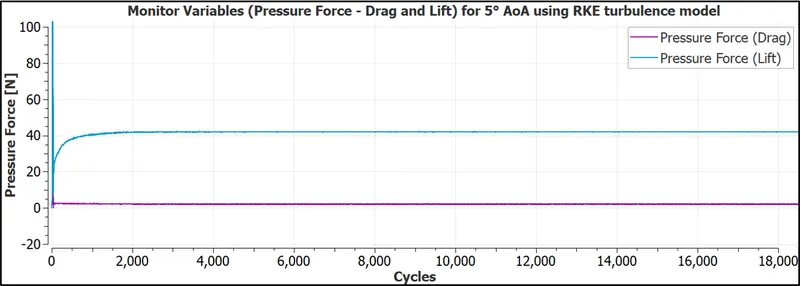
Fig. 8: Plots of pressure forces boundary variables on the NACA 2412 airfoil at 5° AoA for steady-state simulation using RKE turbulence model for mesh 1
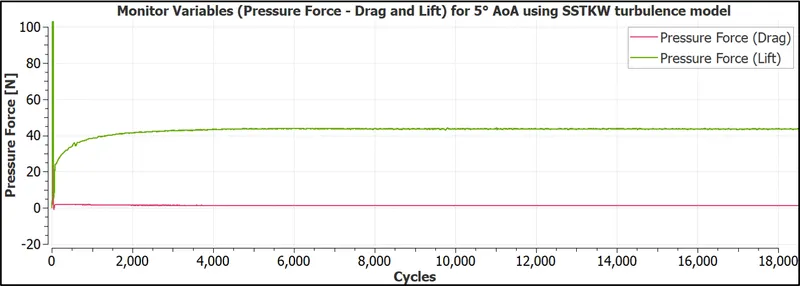
Fig. 9: Plots of pressure forces boundary variables on the NACA 2412 airfoil at 5° AoA for steady-state simulation using SSTKW turbulence model for mesh 1
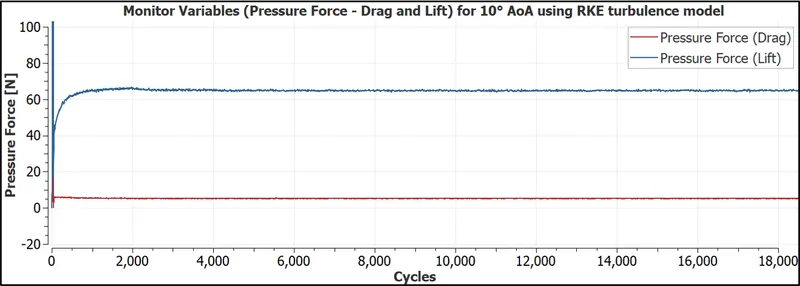
Fig. 10: Plots of pressure forces boundary variables on the NACA 2412 airfoil at 10° AoA for steady-state simulation using RKE turbulence model for mesh 1
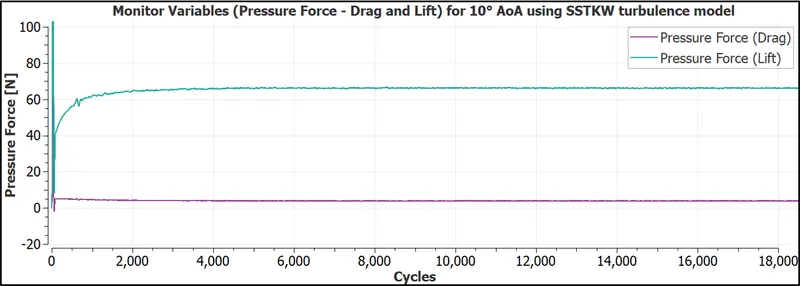
Fig. 11: Plots of pressure forces boundary variables on the NACA 2412 airfoil at 10° AoA for steady-state simulation using SSTKW turbulence model for mesh 1
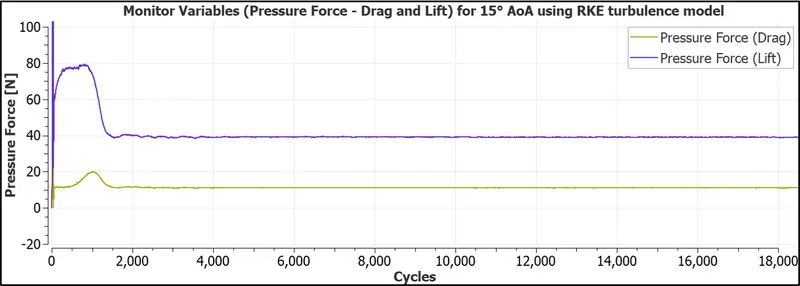
Fig. 12: Plots of pressure forces boundary variables on the NACA 2412 airfoil at 15° AoA for steady-state simulation using RKE turbulence model for mesh 1
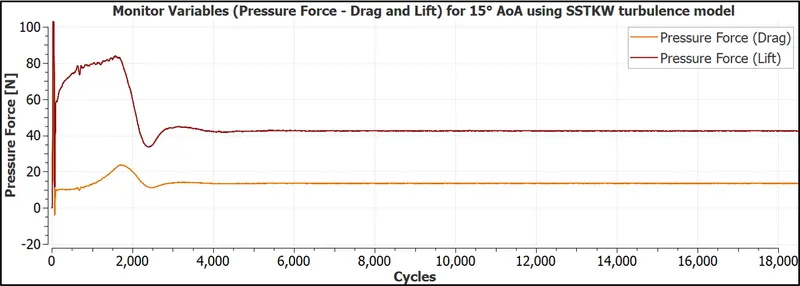
Fig. 13: Plots of pressure forces boundary variables on the NACA 2412 airfoil at 15° AoA for steady-state simulation using SSTKW turbulence model for mesh 1
From Fig. 6 to Fig. 13, we can notice that the monitor variables show a highly stable output with almost negligible variations well before they reach the end of total number of cycles specified in the 'End time' parameter under the 'General' tab of 'Simulation Parameters' settings under the 'Case Setup' tree as 18000 indicating that a steady-state solution has been obtained.
3. Results
3.1 Pressure field plots and identification of separation and recirculation regions using Stream Tracer
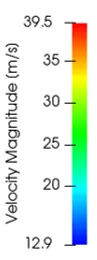
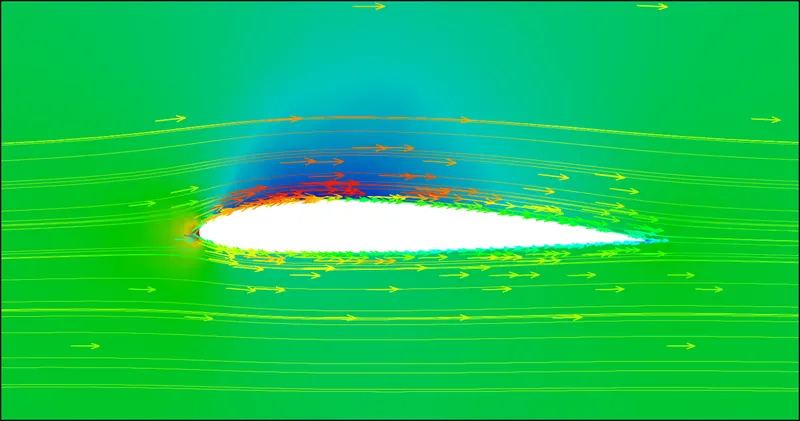
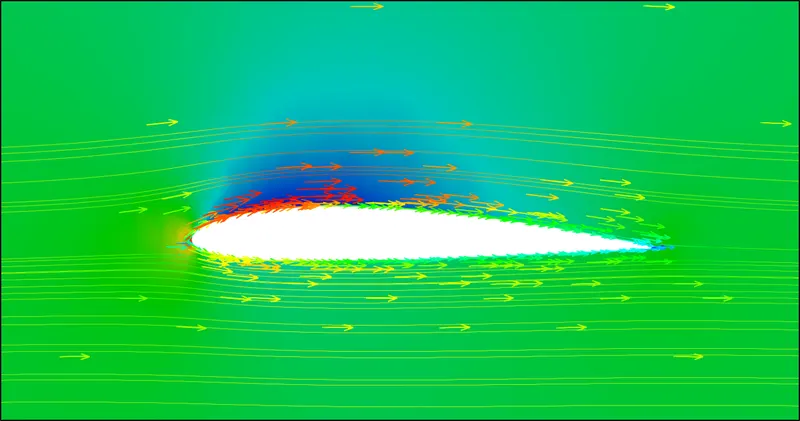
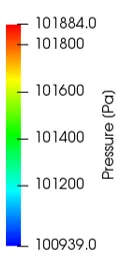
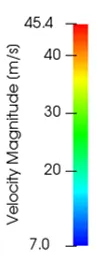
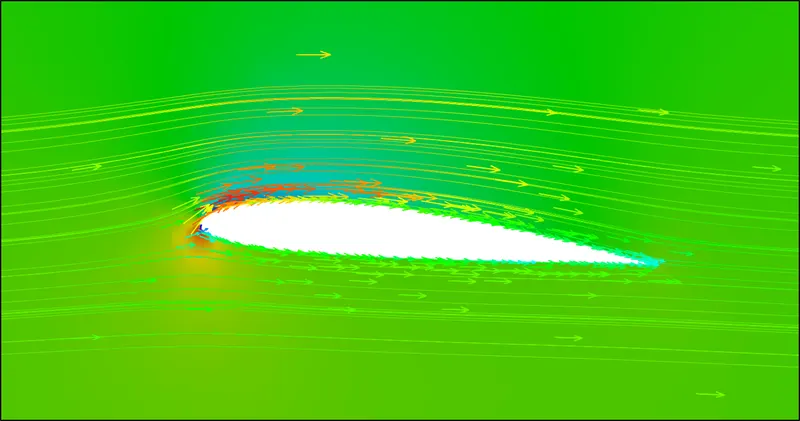
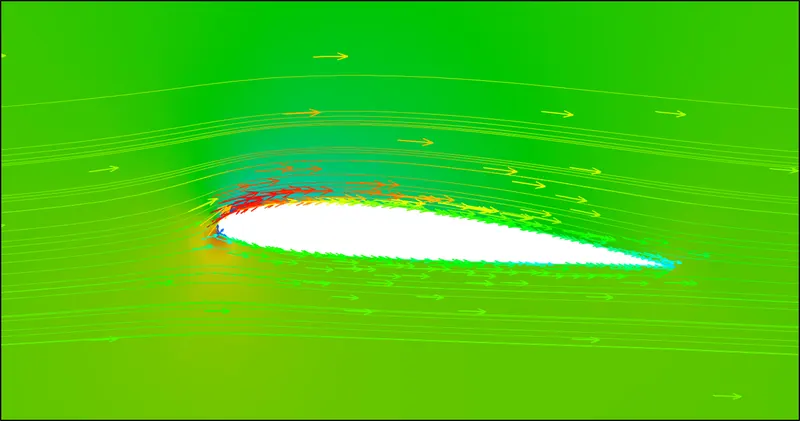
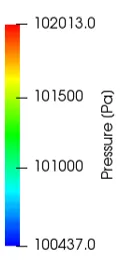
Fig. 14, Fig. 15, Fig. 16 and Fig. 17 below shows the comparison between pressure field plots at the slice region created by orienting the plane normal to the flow direction as was specified in Section 2.4 Post-Processing with streamlines and glyphs coloured using velocity magnitude values for mesh 1 configuration using two different turbulence models wherein the NACA 2412 airfoil is positioned at different angles of attack. It can be clearly visualised that with increase in the angle of attack from 1° to 10°, the average pressure on the top surface reduces while the same quantity increases at the lower or bottom surface which consequently increases the lift force on the airfoil. Also, the high and low pressure regions across the surface of the airfoil can be identified by slowly and rapidly moving fluid medium respectively which also indicates that at lower angles of attack the impingement is more direct as opposed to at higher angles of attack wherein the fluid medium attempts to follow the curvature of the airfoil. There is, however, the exception in case of the 15° angle of attack wherein flow separation occurs over the top surface of the airfoil leading to the formation of a wake region behind it. It should be noted that the post-processing techniques employed are consistent between the two turbulence models at different angles of attack and that their pressure and velocity magnitude scales are ensured to be the same for a given angle of attack to provide appropriate comparisons. This also leads to an interesting examination in the identification of the separation and recirculation zones behind the airfoil at 15° angle of attack wherein the differences is notable between the RKE and SSTKW turbulence models such that the former (RKE turbulence model) predicts the flow separation to occur slightly ahead of the latter on the same top surface with a smaller recirculation zone.
a) RKE turbulence model b) SSTKW turbulence model
Fig. 14: Comparison between pressure field plots with streamlines and glyphs coloured using velocity magnitude values for mesh 1 configuration using two different turbulence models wherein the NACA 2412 airfoil is positioned at 1° angle of attack
a) RKE turbulence model b) SSTKW turbulence model
Fig. 15: Comparison between pressure field plots with streamlines and glyphs coloured using velocity magnitude values for mesh 1 configuration using two different turbulence models wherein the NACA 2412 airfoil is positioned at 5° angle of attack
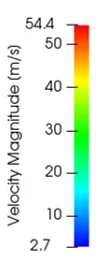
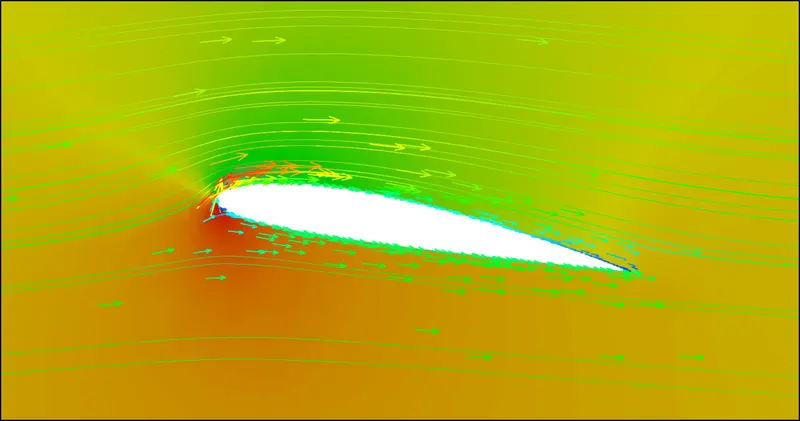
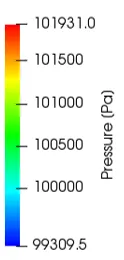
a) RKE turbulence model b) SSTKW turbulence model
Fig. 16: Comparison between pressure field plots with streamlines and glyphs coloured using velocity magnitude values for mesh 1 configuration using two different turbulence models wherein the NACA 2412 airfoil is positioned at 10° angle of attack
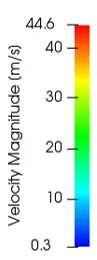
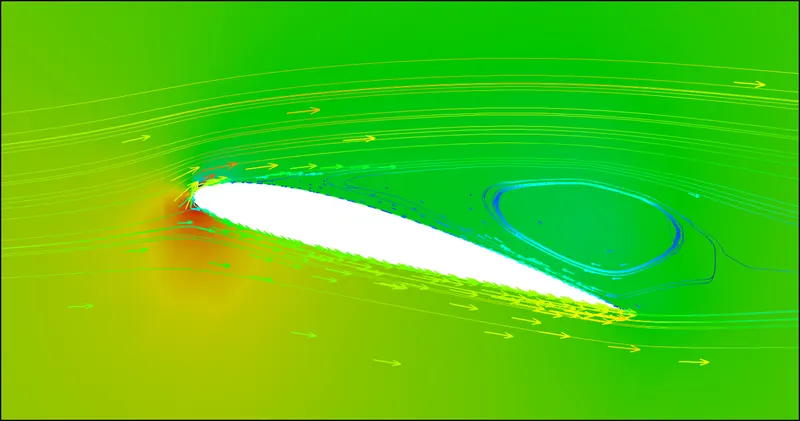
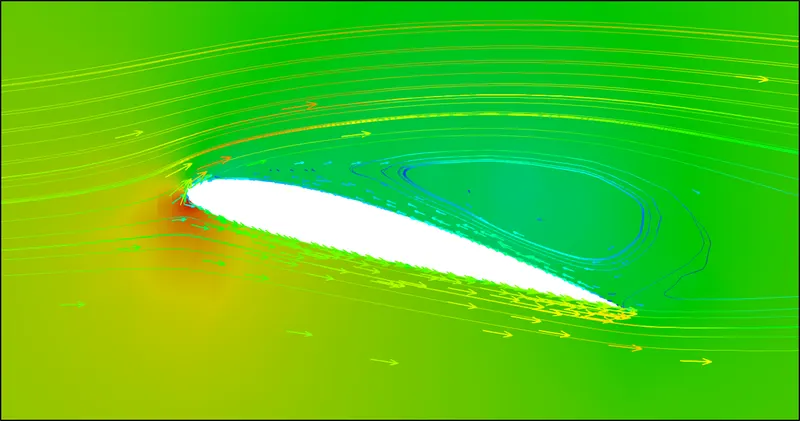
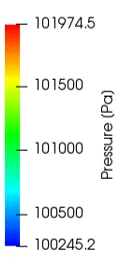
a) RKE turbulence model b) SSTKW turbulence model
Fig. 17: Comparison between pressure field plots with streamlines and glyphs coloured using velocity magnitude values for mesh 1 configuration using two different turbulence models wherein the NACA 2412 airfoil is positioned at 15° angle of attack
3.2 Drag and Lift co-efficient vs Angle of Attack for RKE and SSTKW turbulence models
The figures below i.e., Fig.18 and Fig. 19, shows the comparison between predictions by the RKE and SSTKW turbulence models for the drag and lift coefficients respectively at different angles of attack. It can be observed that the trends are similar for both the aforementioned turbulence models and that at 10° angle of attack, the maximum value of lift coefficient is achieved for either case, based on the governing flow conditions, beyond which the same quantity sharply decreases indicating stall which is a result of flow separation and presence of a significantly enlarged wake region on the top surface of the airfoil, as was also observed in Fig. 17, consequently leading to increase in the drag coefficient.
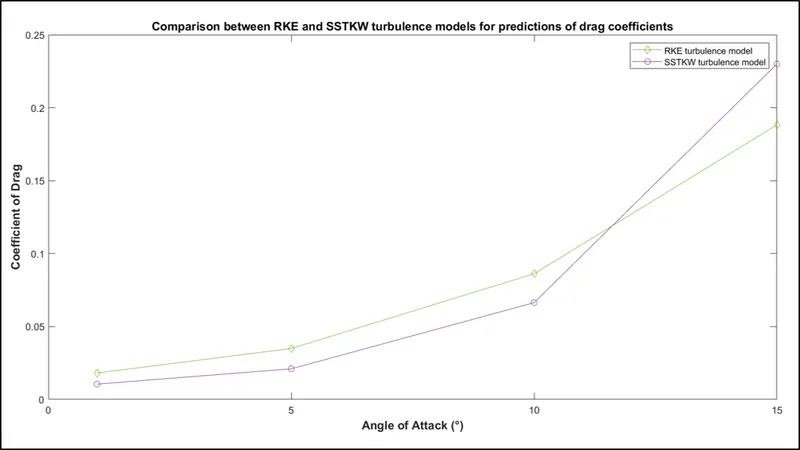
Fig. 18: Plot of comparison of Coefficient of Drag vs Angle of Attack (AoA) for RKE and SSTKW turbulence models
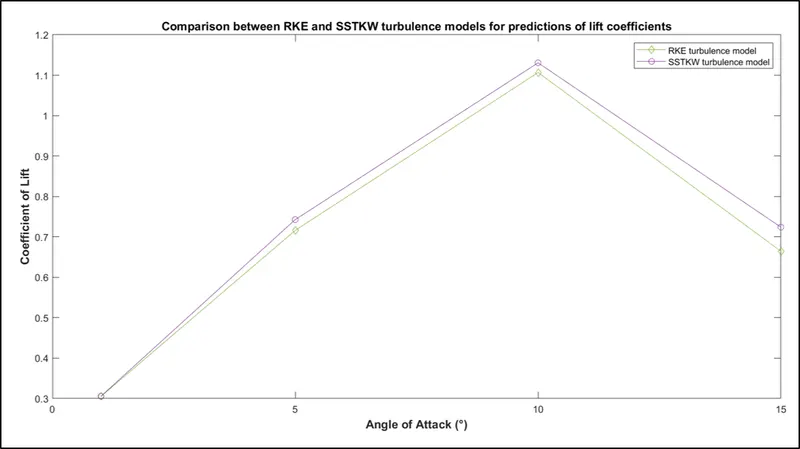
Fig. 19: Plot of comparison of Coefficient of Lift vs Angle of Attack (AoA) for RKE and SSTKW turbulence models
4. Discussion
Air, containing a mixture of two major contributing gas species `O_2` and `N_2` by mass fraction, enters at the inlet of the given cross-section of the computational domain consisting of a NACA 2412 airfoil, an asymmetrical or non-symmetric airfoil, as a turbulent flow which at 0° angle of attack offers a non-zero positive value for lift force and hence, lift coefficient, due to the resulting pressure difference between the airfoil's top and bottom surfaces with the air flow remaining largely attached over them before separating towards the end or what is also called as the trailing edge. The behaviour of fluid flow associated with respect to the airfoil is such that the viscous effects is practically negligible, as a result of its streamline profile, and therefore, the major contributions can be deemed to be the pressure distribution over it with the objective in this case being increasing the lift force. This behaviour of the lift force increasing holds true as the angle of attack increases until it reaches a critical point beyond which there is a sharp decline in the same followed by the rise in drag force. The critical point at which the lift force begins to decrease is known as stall which consequently leads to flow separation and formation of wake, identified with reverse flow or as a low-pressure region, such that the developed boundary layer with an almost fuller turbulent profile is essentially disrupted but can go on to form a reattachment point further downstream, depending on the length of the domain.
5. Conclusion
The two-dimensional numerical analysis for external air flow over a NACA 2412 airfoil model under steady-state conditions using RKE and SSTKW turbulence models in Converge Studio v3.0 and executed using the Cygwin64 terminal was well understood. It was realised that using appropriate wall modelling approaches of using a wall function for the aforementioned turbulence models with respect to the empirically estimated `y^+` values, the drag and lift coefficients predicted by each of them resembled similar trends while also highlighting the presence of stalling conditions after 10° angle of attack. The variation in pressure values using field plots and velocity magnitude quantity with glyphs and/or streamlines at different angles of attack provided enhanced visualisation of the flow features involved including separation and recirculation.
References
[1] Airfoil Tools © 2021. All rights reserved. NACA 4 digit airfoil generator (NACA 2412 AIRFOIL), www.airfoiltools.com, viewed 26 August 2021, <http://airfoiltools.com/airfoil/naca4digit>
[2] CONVERGE 3.0 Manual. © 2020 Convergent Science. All rights reserved. July 15, 2020.
[3] Shih, T.-H., Liou, W.W., Shabbir, A., Yang, Z., and Zhu, J., "A New k-ε Eddy Viscosity Model for High Reynolds Number Turbulent Flows—Model Development and Validation," Computers & Fluids, 24(3), 227-238, 1995. DOI: 10.1016/0045-7930(94)00032-T
[4] Menter, F.R., Kuntz, M., and Langtry, R., "Ten Years of Industrial Experience with the SST Turbulence Model," Turbulence, Heat and Mass Transfer 4, eds: Hanjalic, K., Nagano, Y., and Tummers, M., Begell House, Inc., 2003.
[5] Engineers Edge, LLC, Viscosity of air, Dynamic and Kinematic, www.engineersedge.com, viewed 26 August 2021, <https://www.engineersedge.com/physics/viscosity_of_air_dynamic_and_kinematic_14483.htm#:~:text=The%20viscosity%20of%20air%20depends,2%20%2Fs%20or%2014.8%20cSt.>
[6] Blasius, H. (1908). "Grenrschichten in Flussgkeiten mit Kleiner Reibung". Zeitschrift für Angewandte Mathematik und Physik, 56, pp. 1-37