Week - 9 Material Modeling from Raw Data
Aim:
By using the diagram of the true stress-strain curve given for graphite iron casting and creating a material model for the dog bone specimen by using LS-prepost and Validating the material.
Procedure:
1. The material curve image is provided in PNG format, Convert it into JPG file. Open the JPG file in GetData Graph Digitizer.
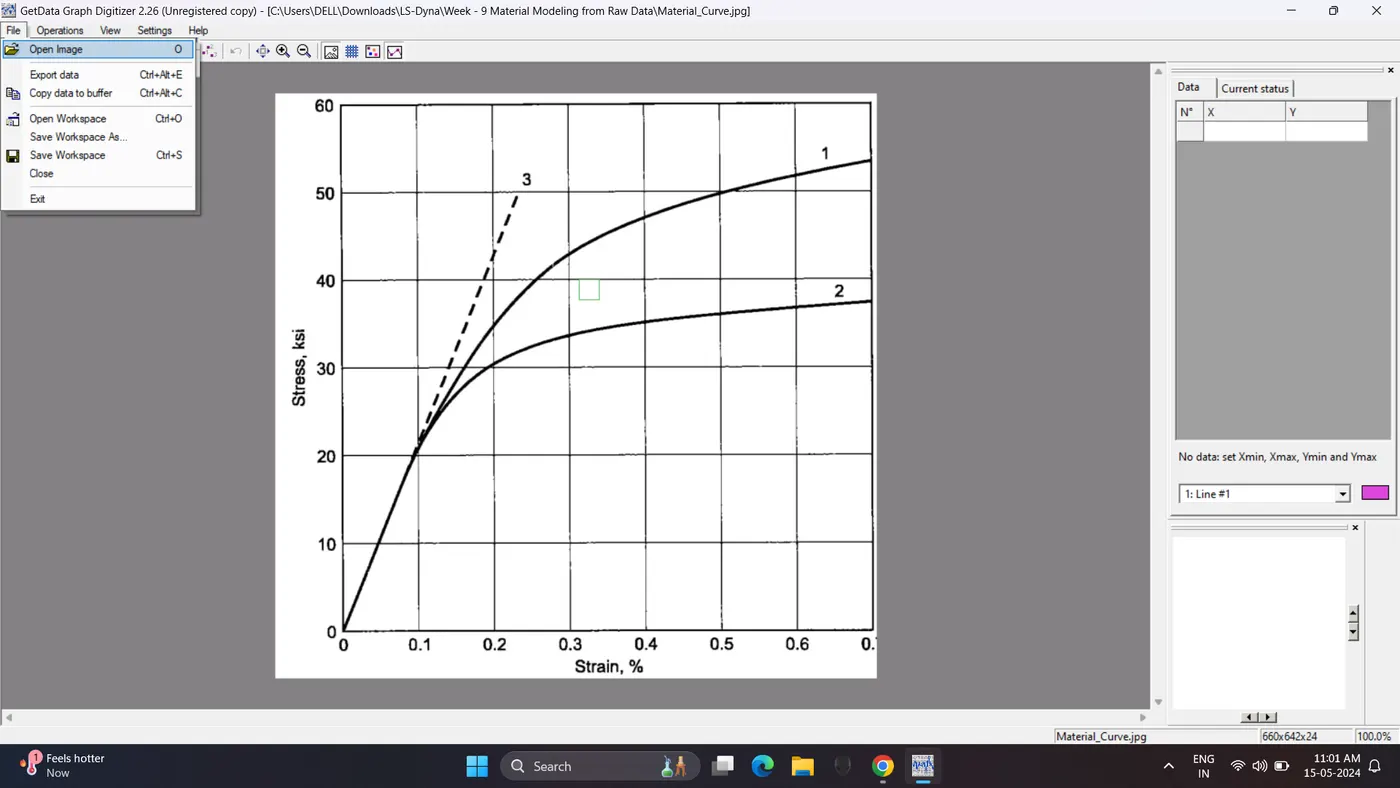
2. Go to Operation - Set Scale. Select the X and Y axis.
Note: X axis = Strain, Y axis = Stress.
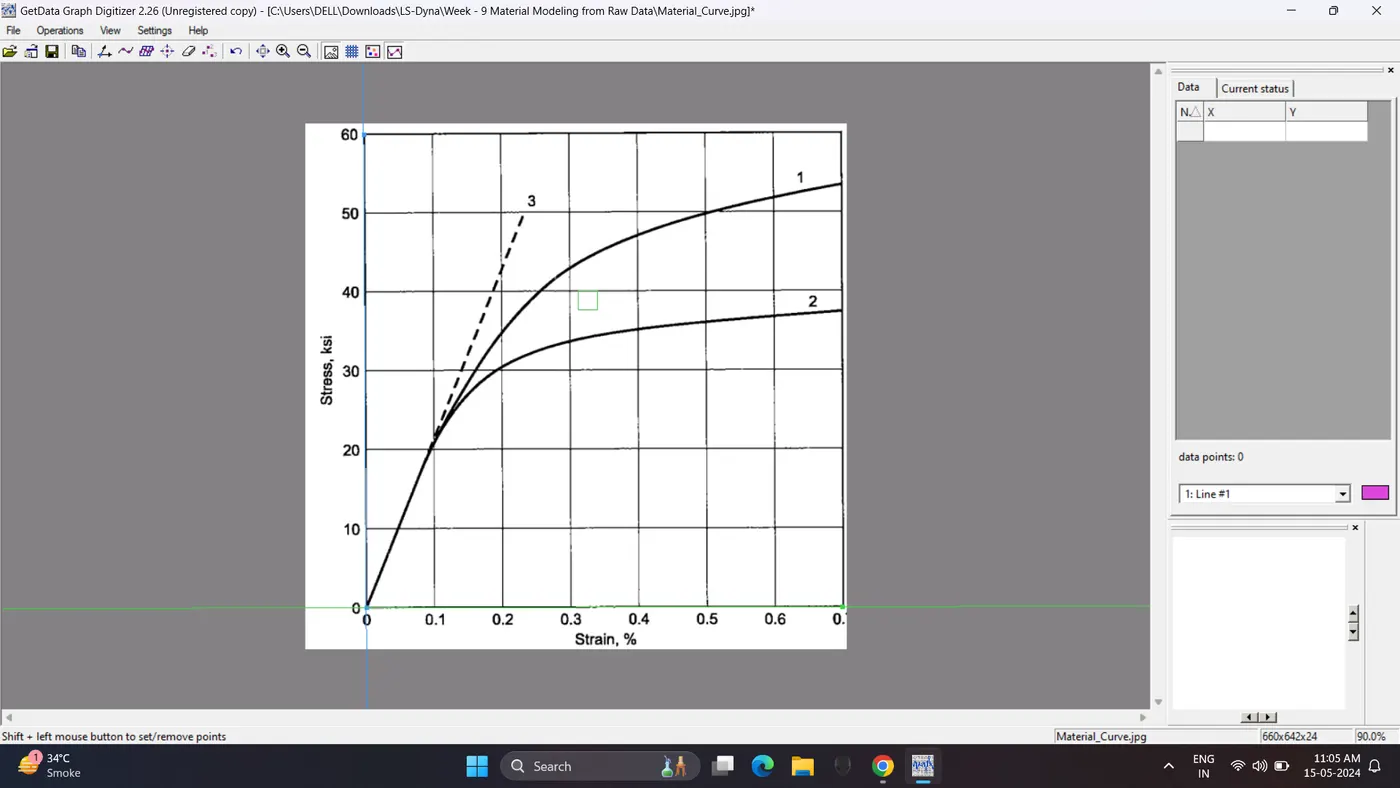
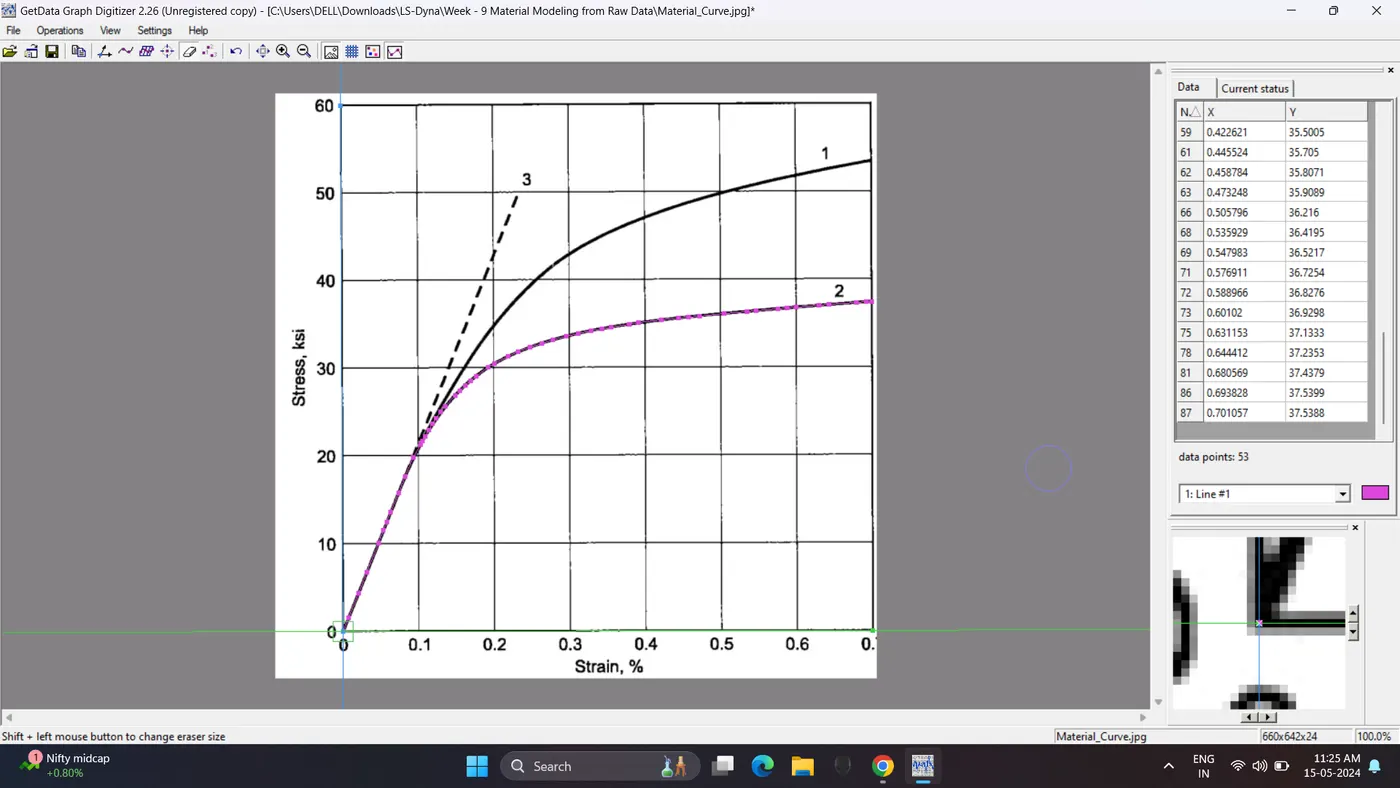
3. I am selecting the second graph for material modelling. Go to Operation - Point Capture Mode. Click on the curve to get the reading.
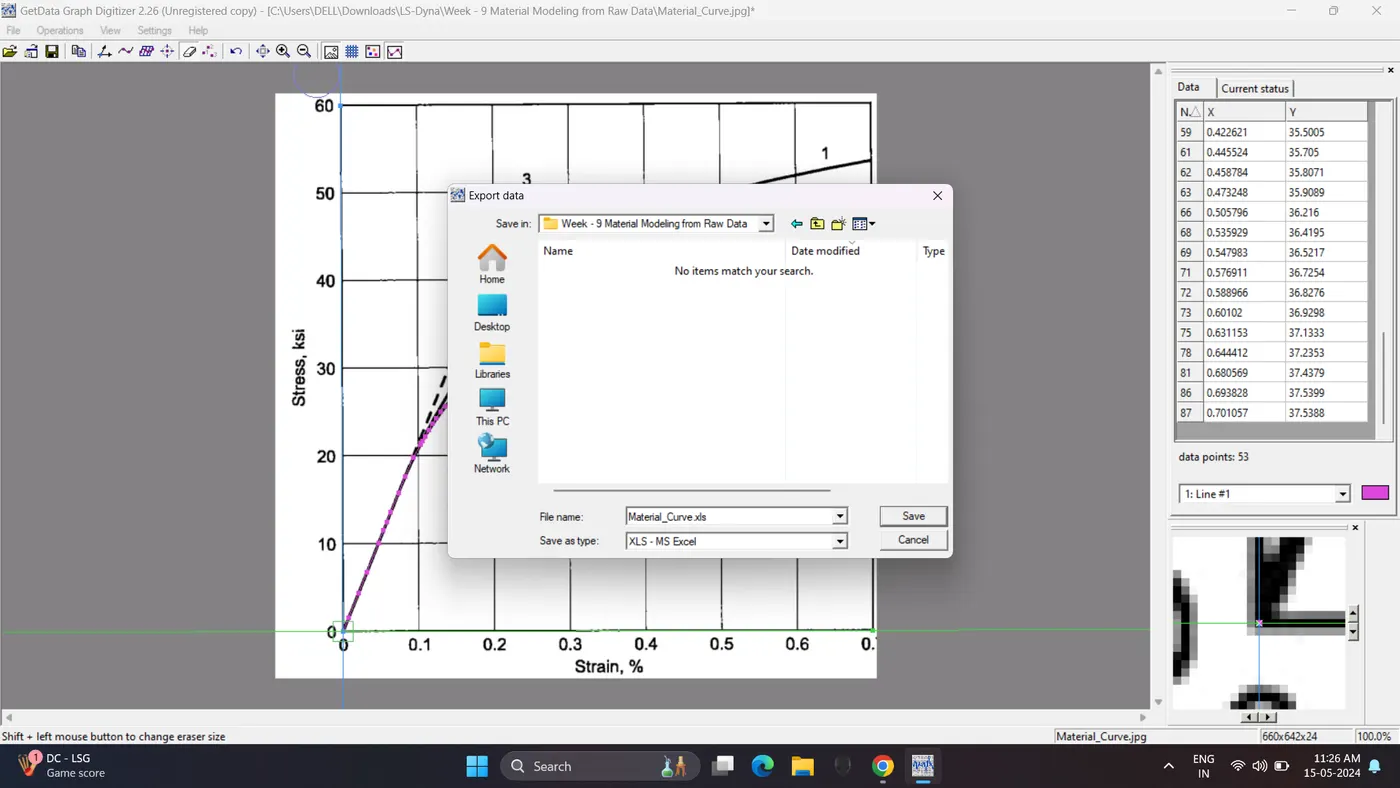
4. Export the data in Excel file. Go to File - Export.
5. Open the Excel file.
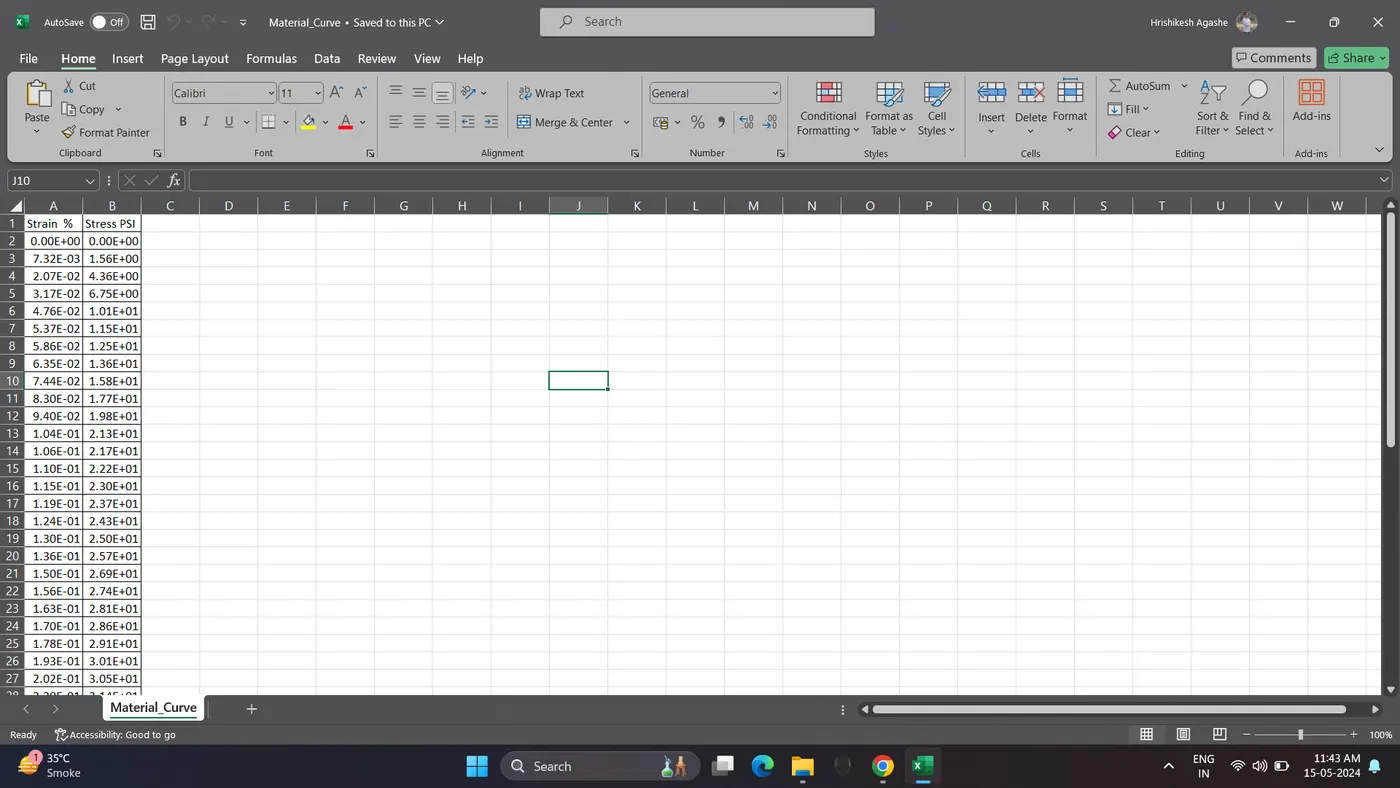
6. As per the graph and Elastic Modulus that are provided. True Stress and True Strain are given in PSI and Percentage.
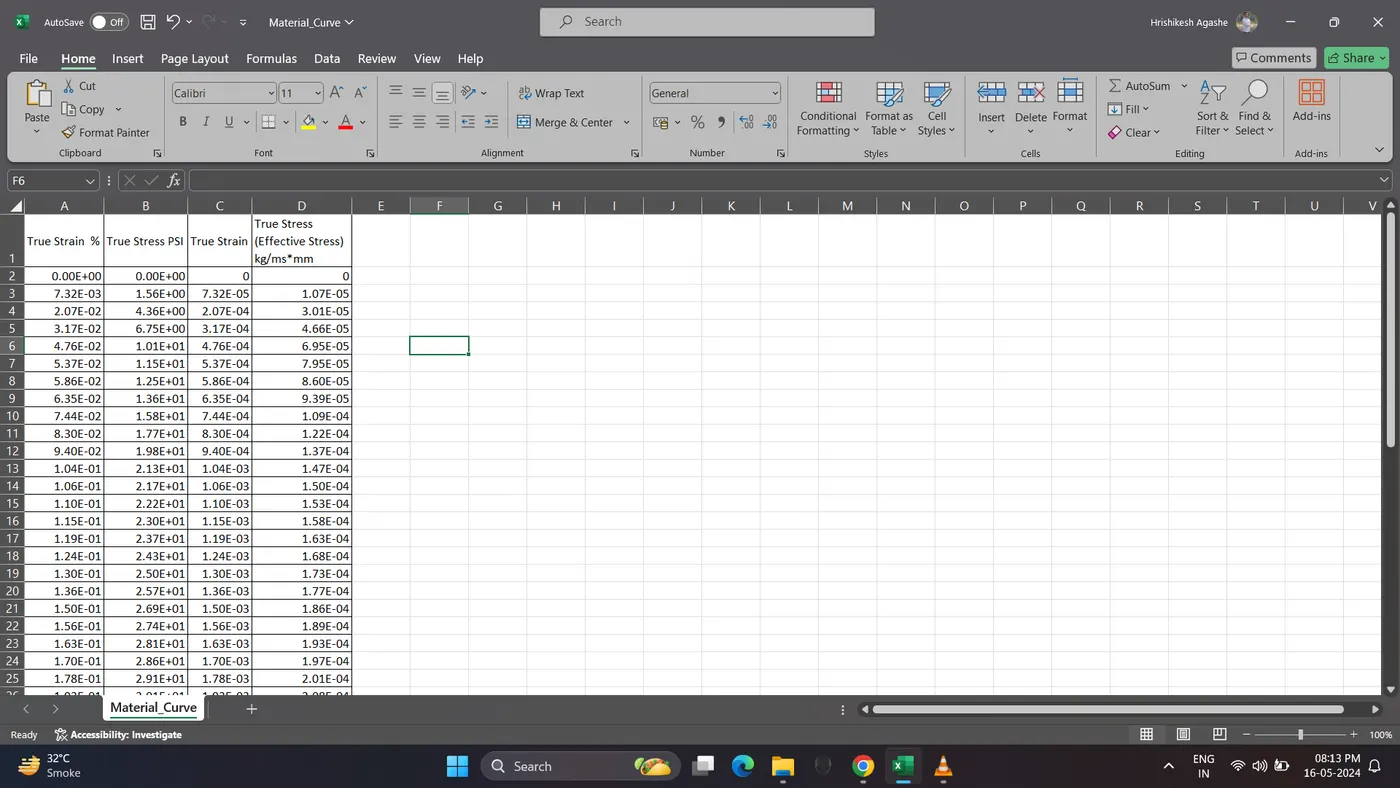
Convert the above as per Kg - mm - ms unit system.
True Strain = True Strain % / 100
True Stress kg/ms*mm = True Stress PSI * 0.00000689476.
7. Create a Stress vs Strain Graph.
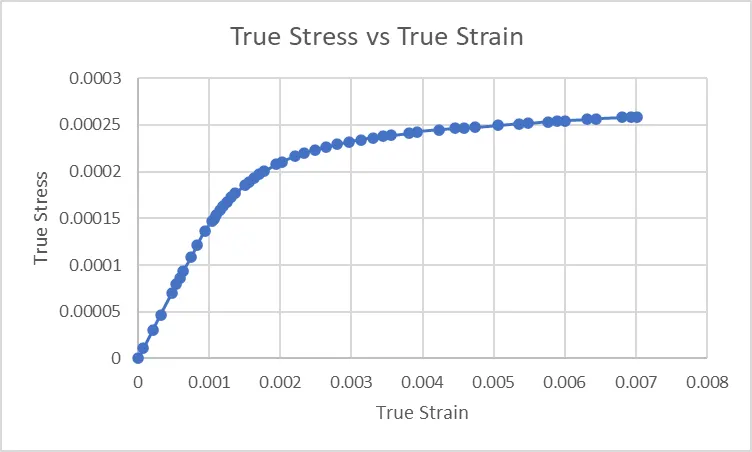
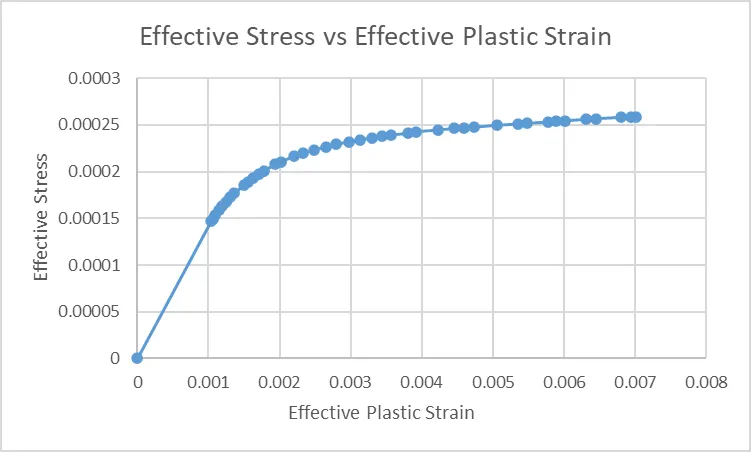
8. In Graph select the Yield Point and from the yield point use effective stress, plastic effective strain value for the curve.
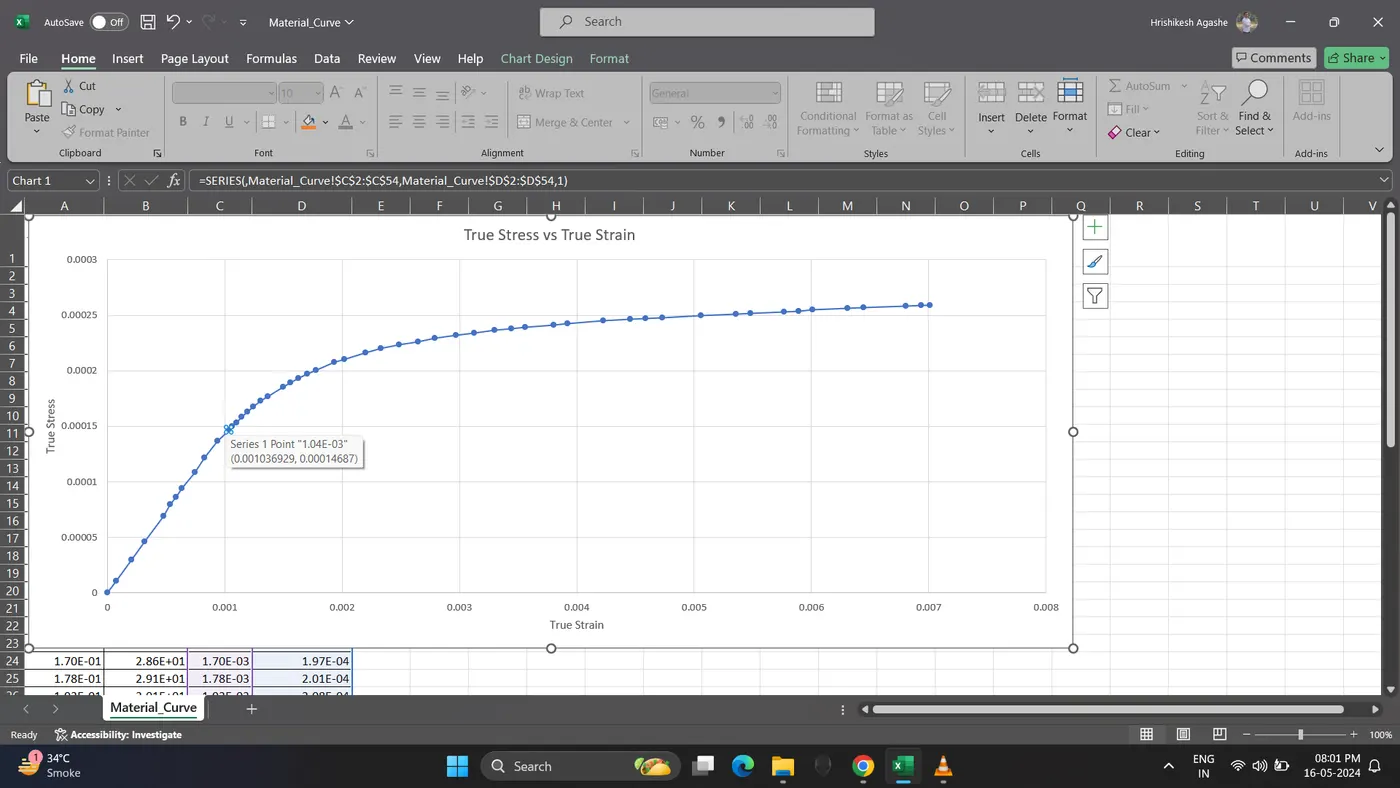
| Effective Plastic Strain | Effective stress (kg/ms*mm) |
| 1.04E-03 | 1.47E-04 |
| 1.06E-03 | 1.50E-04 |
| 1.10E-03 | 1.53E-04 |
| 1.15E-03 | 1.58E-04 |
| 1.19E-03 | 1.63E-04 |
| 1.24E-03 | 1.68E-04 |
| 1.30E-03 | 1.73E-04 |
| 1.36E-03 | 1.77E-04 |
| 1.50E-03 | 1.86E-04 |
| 1.56E-03 | 1.89E-04 |
| 1.63E-03 | 1.93E-04 |
| 1.70E-03 | 1.97E-04 |
| 1.78E-03 | 2.01E-04 |
| 1.93E-03 | 2.08E-04 |
| 2.02E-03 | 2.11E-04 |
| 2.20E-03 | 2.16E-04 |
| 2.33E-03 | 2.20E-04 |
| 2.49E-03 | 2.23E-04 |
| 2.65E-03 | 2.26E-04 |
| 2.79E-03 | 2.29E-04 |
| 2.97E-03 | 2.32E-04 |
| 3.13E-03 | 2.34E-04 |
| 3.30E-03 | 2.36E-04 |
| 3.44E-03 | 2.38E-04 |
| 3.56E-03 | 2.39E-04 |
| 3.80E-03 | 2.41E-04 |
| 3.92E-03 | 2.43E-04 |
| 4.23E-03 | 2.45E-04 |
| 4.46E-03 | 2.46E-04 |
| 4.59E-03 | 2.47E-04 |
| 4.73E-03 | 2.48E-04 |
| 5.06E-03 | 2.50E-04 |
| 5.36E-03 | 2.51E-04 |
| 5.48E-03 | 2.52E-04 |
| 5.77E-03 | 2.53E-04 |
| 5.89E-03 | 2.54E-04 |
| 6.01E-03 | 2.55E-04 |
| 6.31E-03 | 2.56E-04 |
| 6.44E-03 | 2.57E-04 |
| 6.81E-03 | 2.58E-04 |
| 6.94E-03 | 2.59E-04 |
| 7.01E-03 |
2.59E-04 |
9. Open the Dogbone specimen material model.
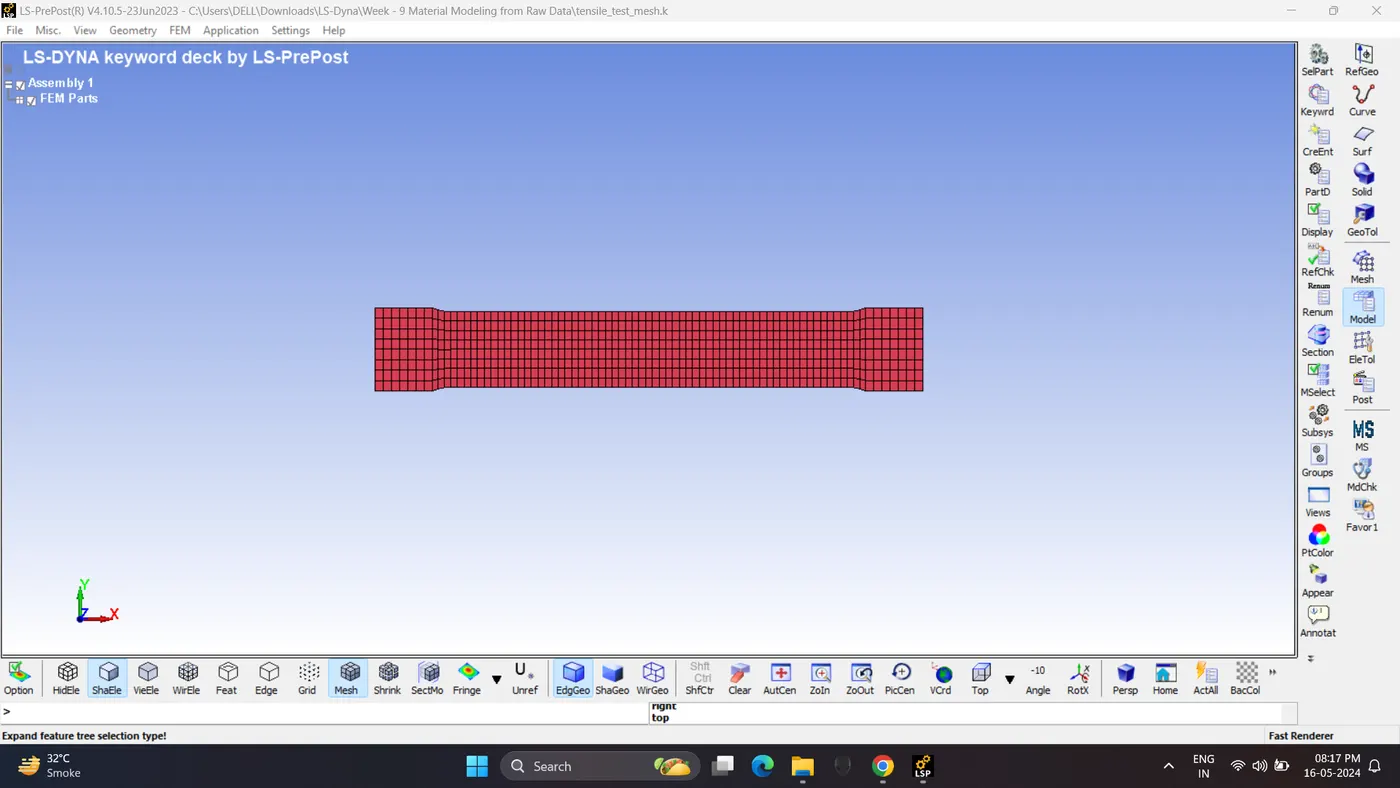
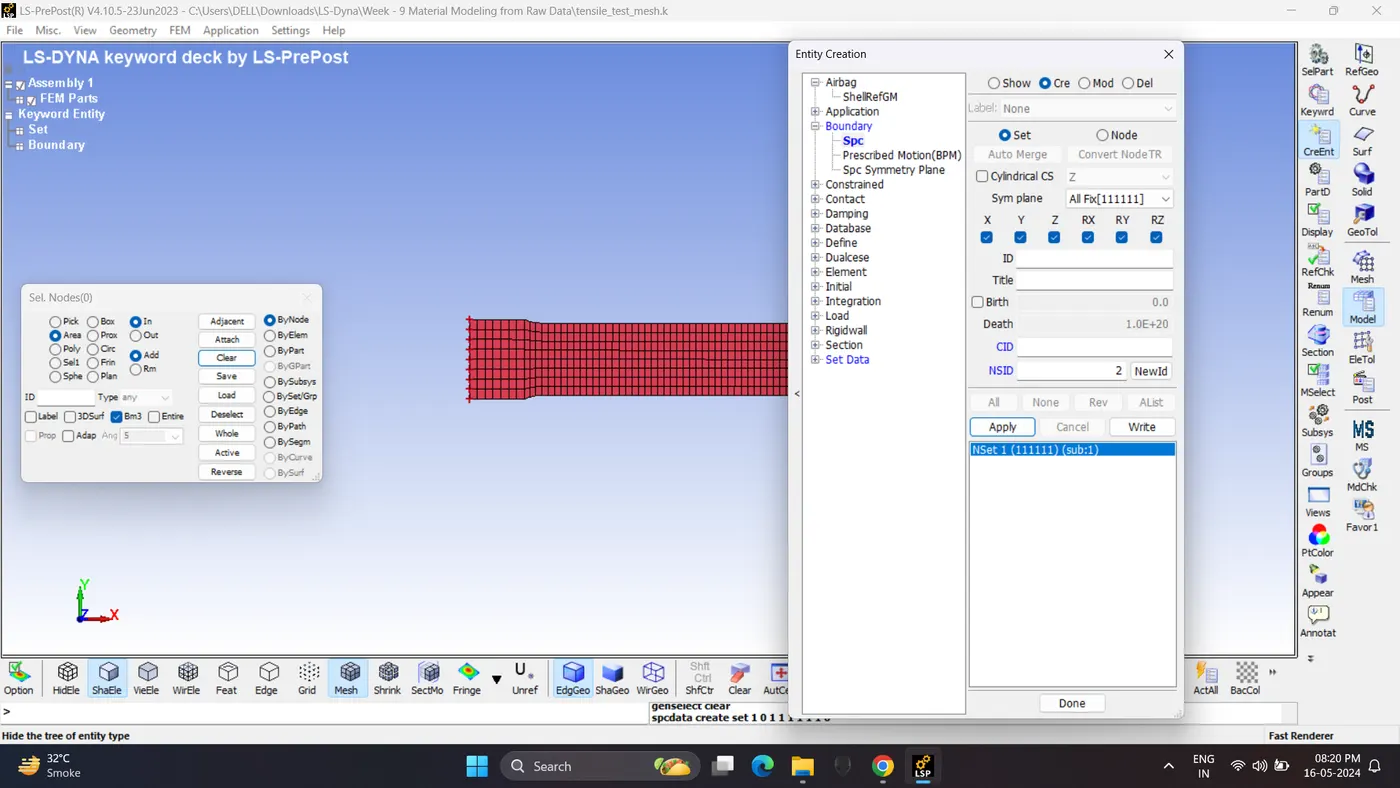
10. Lock all the DOF of left side of specimen.
Go to Model - Create entity - Boundary - SPC.
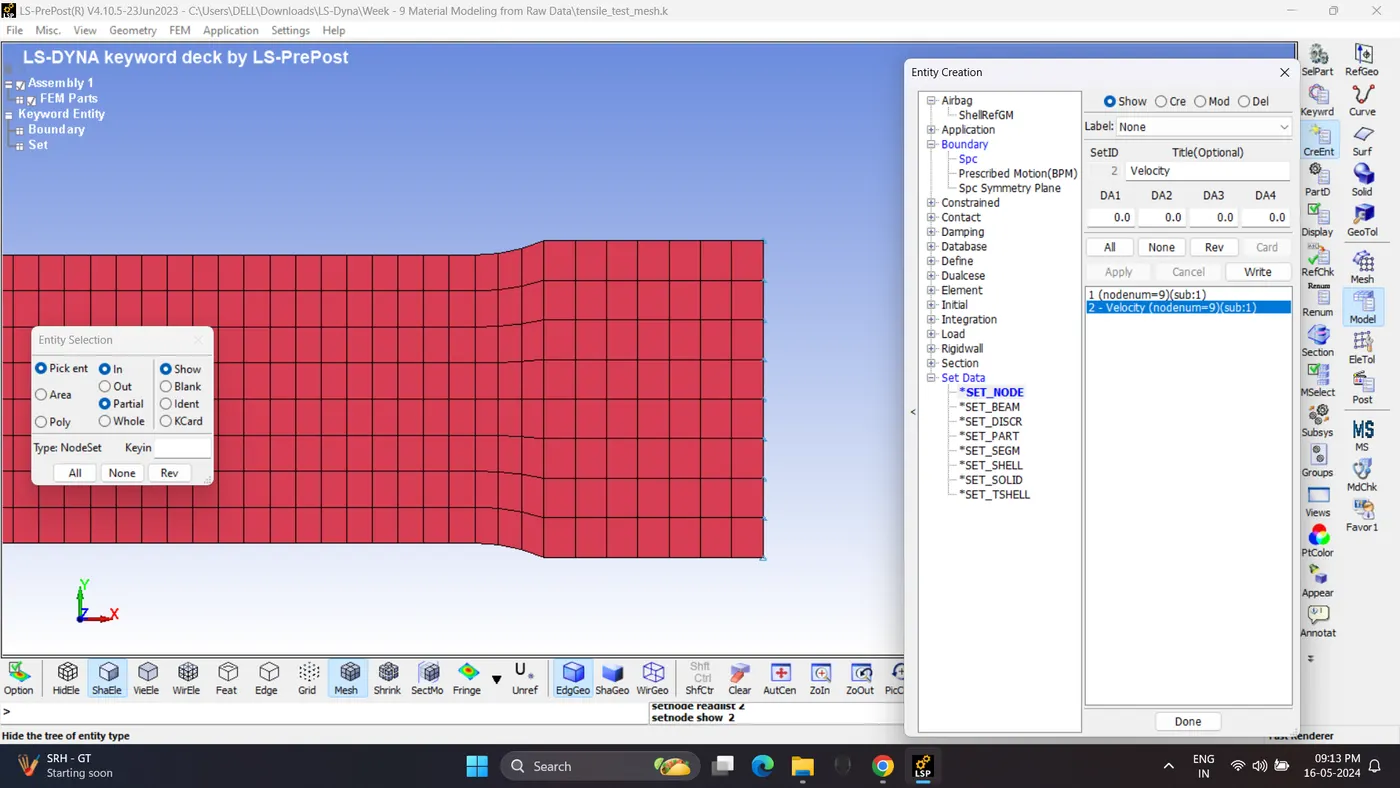
11. Create a node set for the other end.
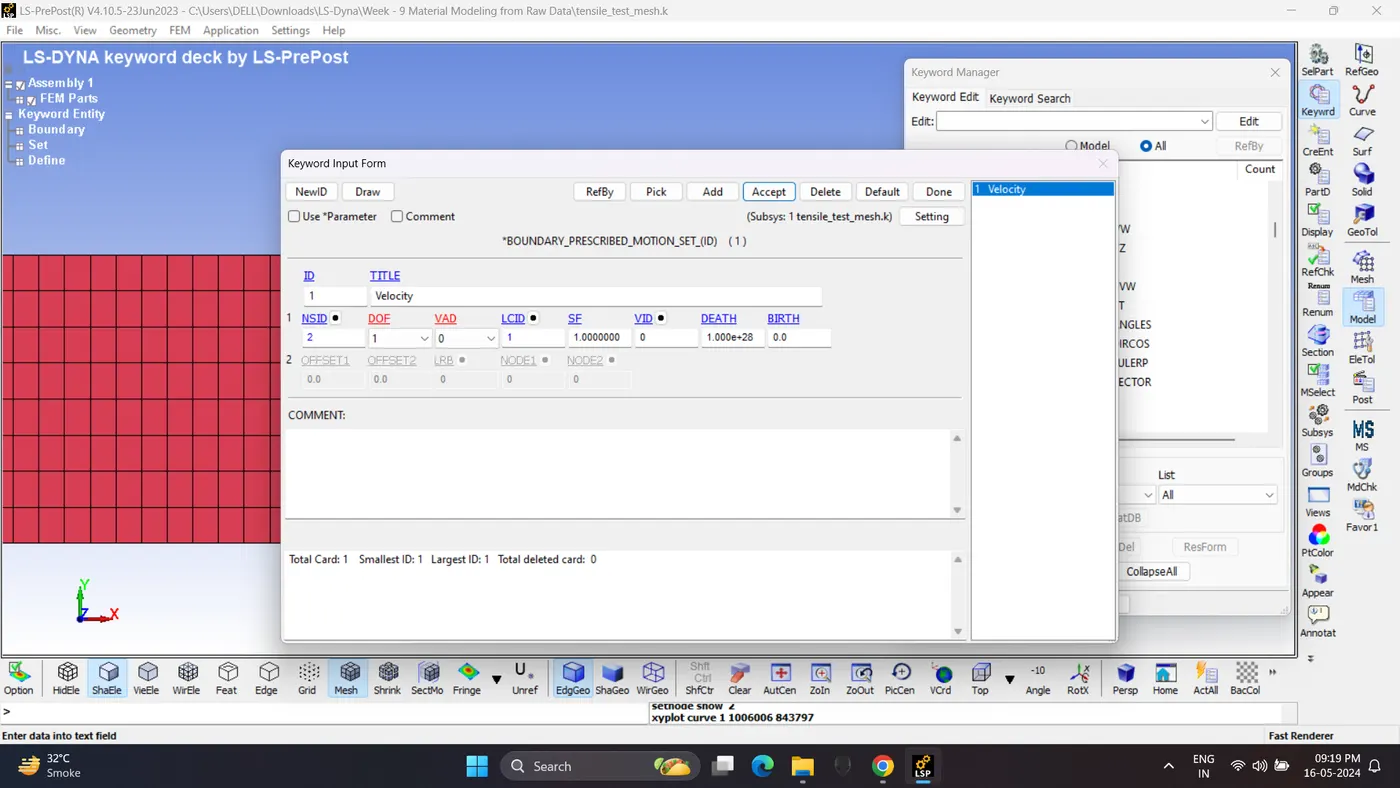
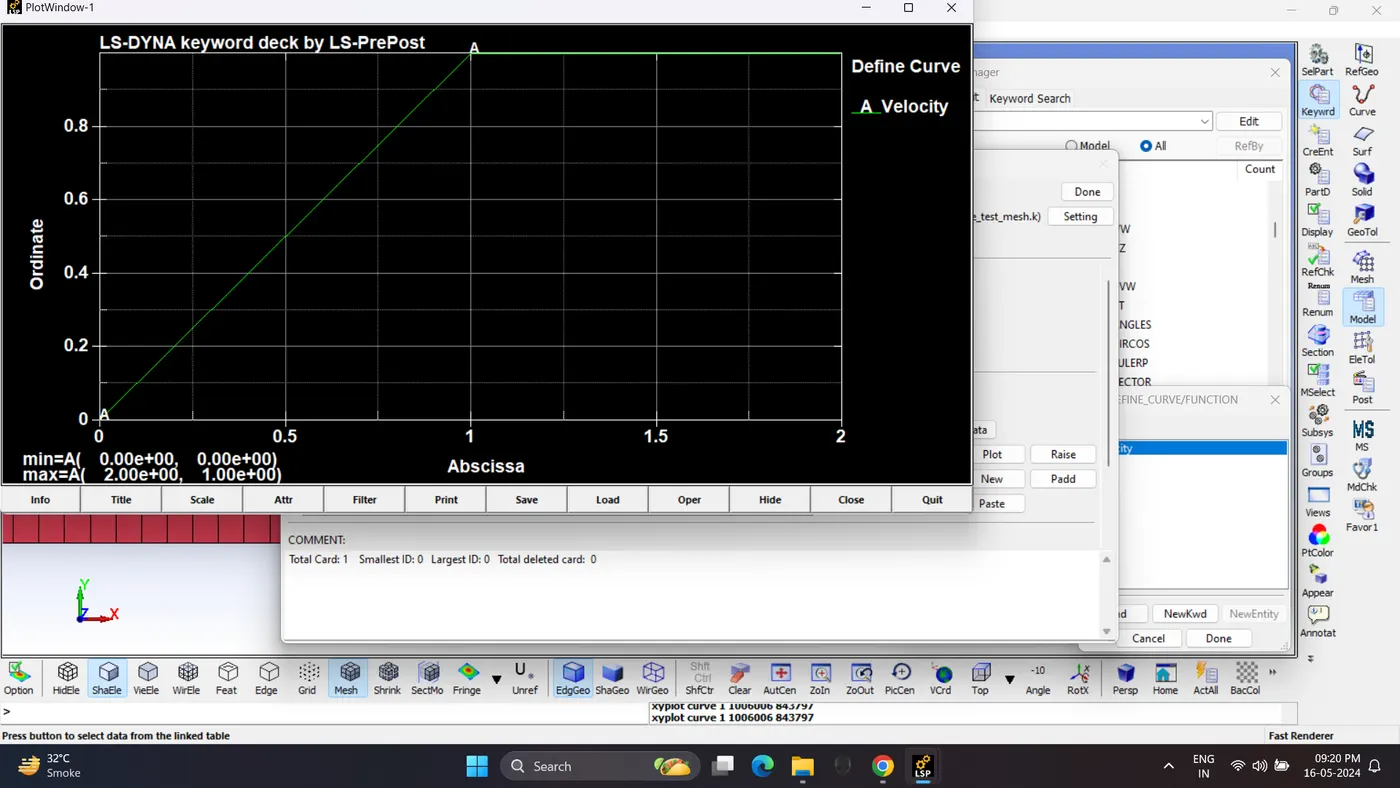
12. Create a Velocity card. Go to Model - Keyword Manager - Boundary - Prescribed Motion Set.
Give 1 mm/ms velocity.
13. Create a Curve for material.
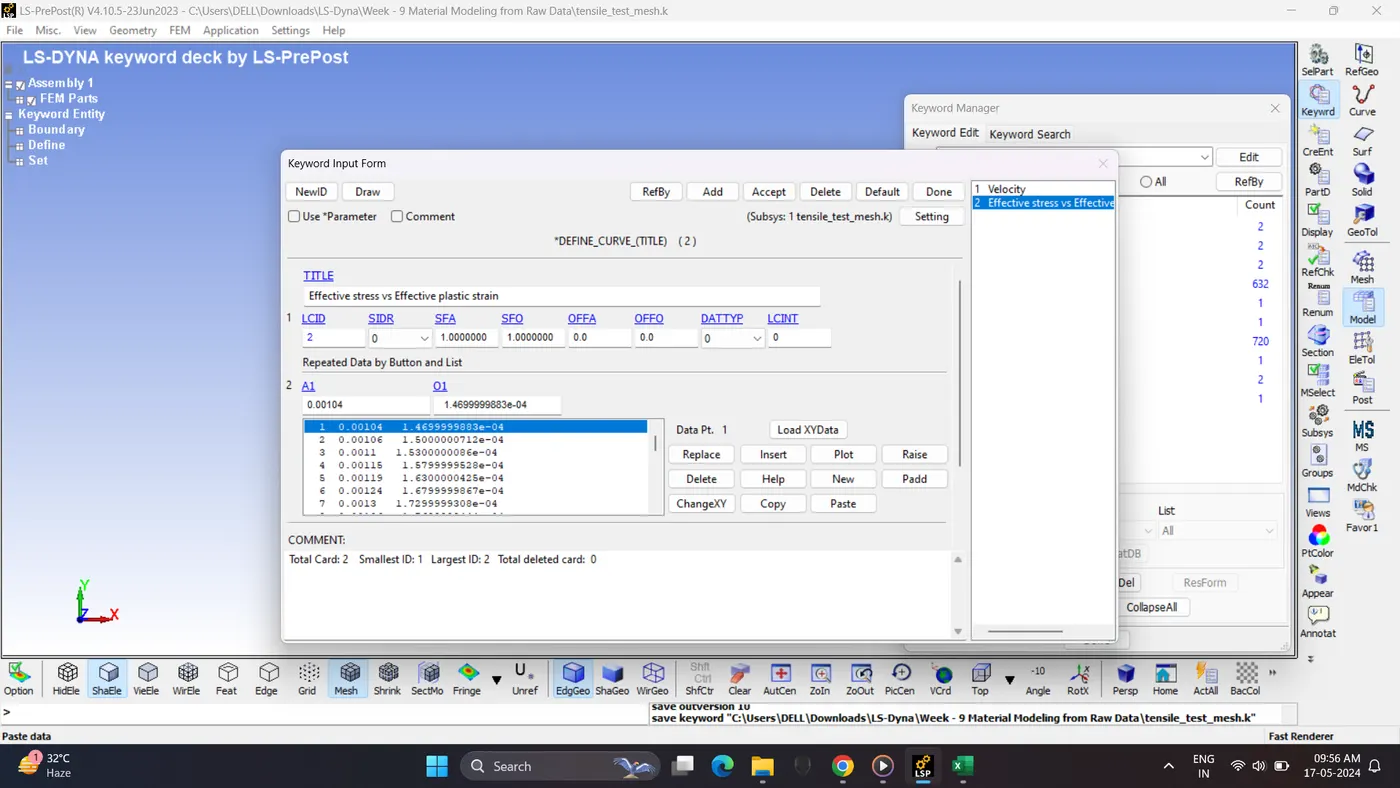
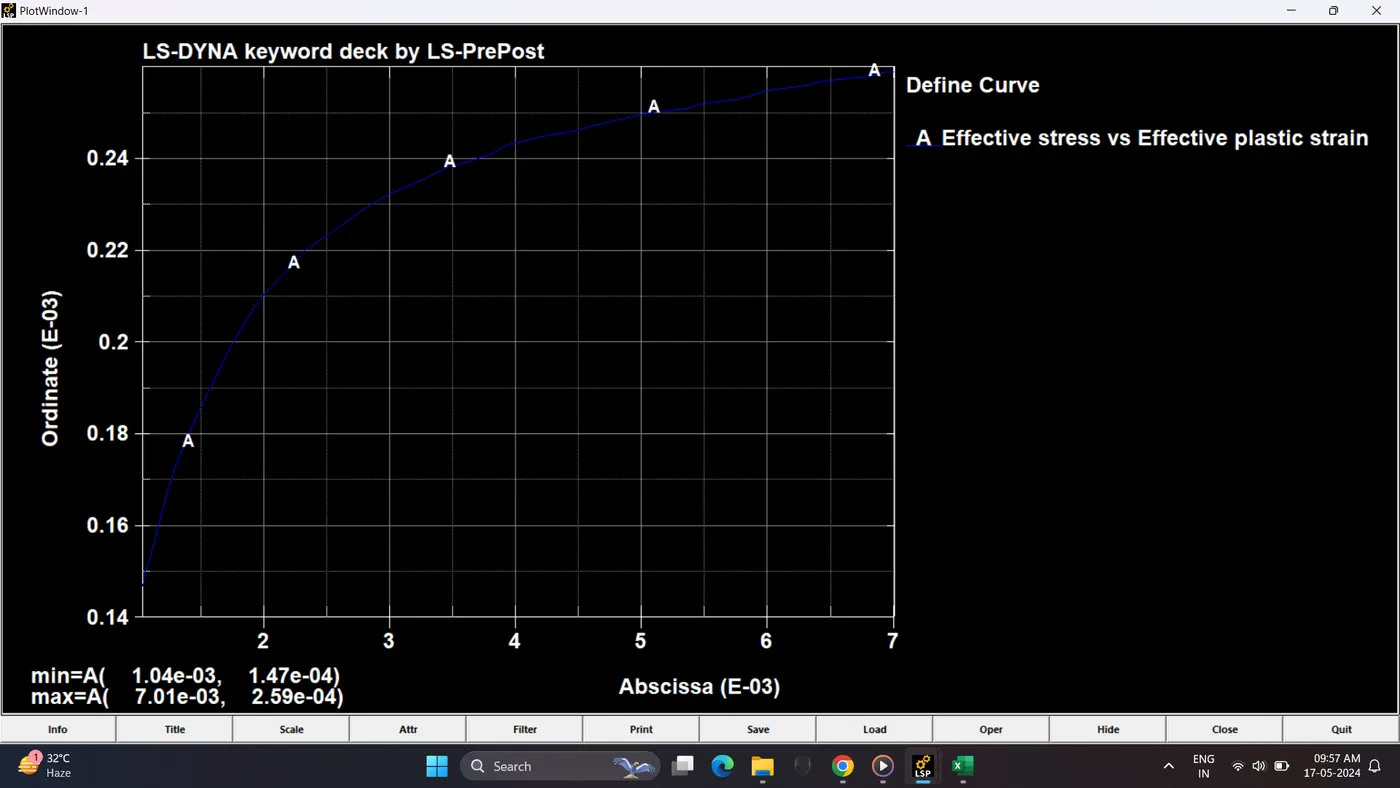
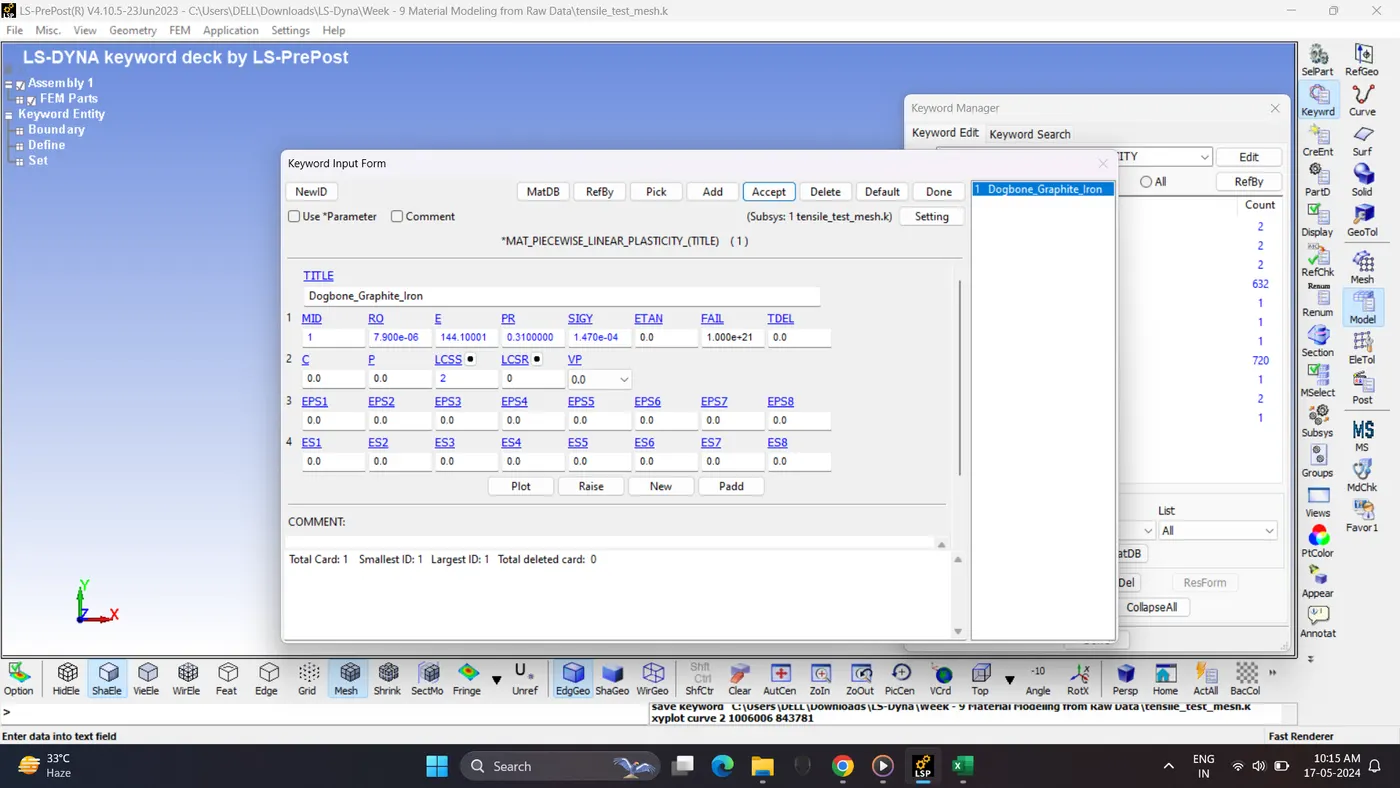
14. Create a Material card of graphite iron casting. Go to Model - Keyword Manager - Mat - 024 Peacewise Linear Plasticity.
Ro - Density of the garphite iron casting = 7.9*e-6 Kg /mm^3.
E - Youngs modulus = 144.10 kg/mm.ms^2.
PR - Poissons ratio= 0.31
From the graph Yield stress(SIGY) = 1.47E-04 kg/mm.ms^2
15. Create section and hourglass card. Assign Material, section and Hourglass card to part.
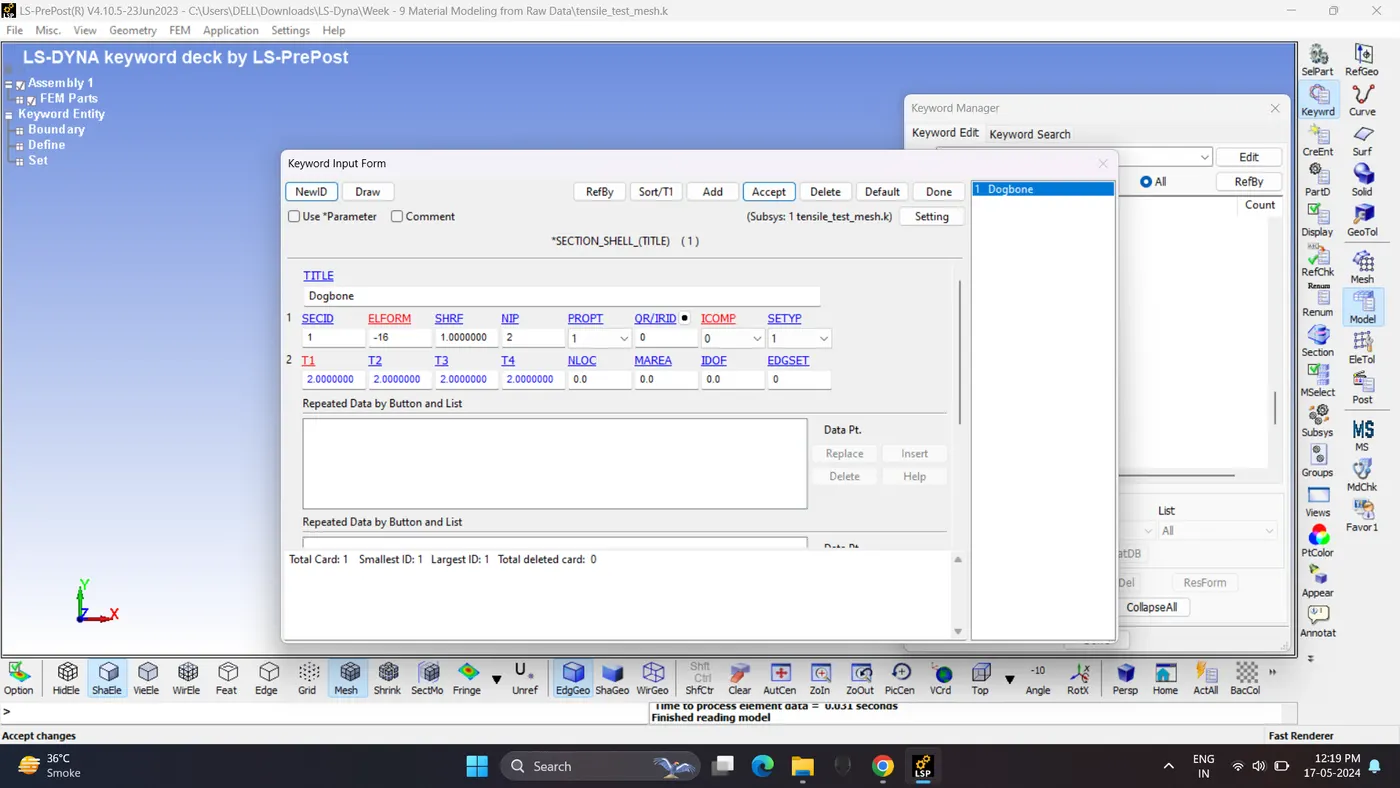
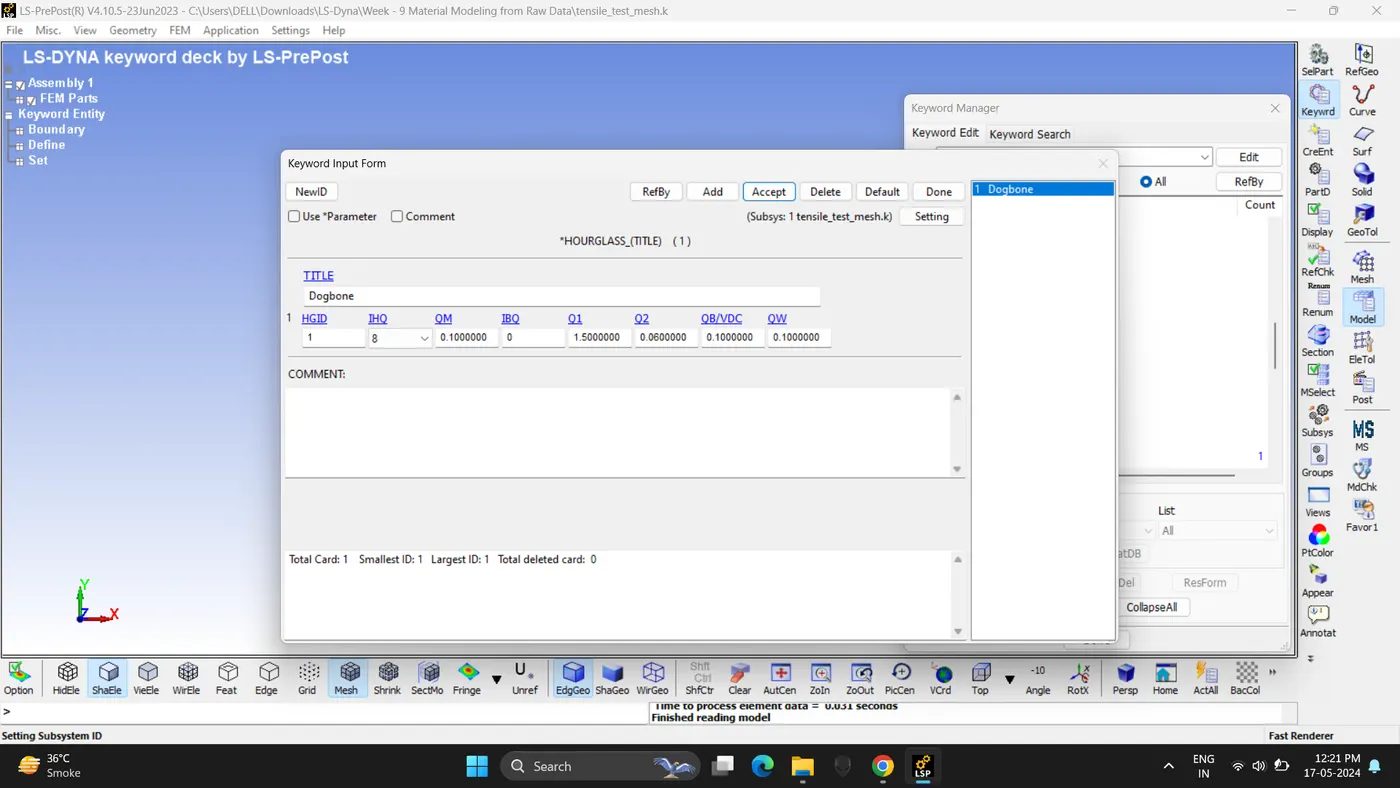
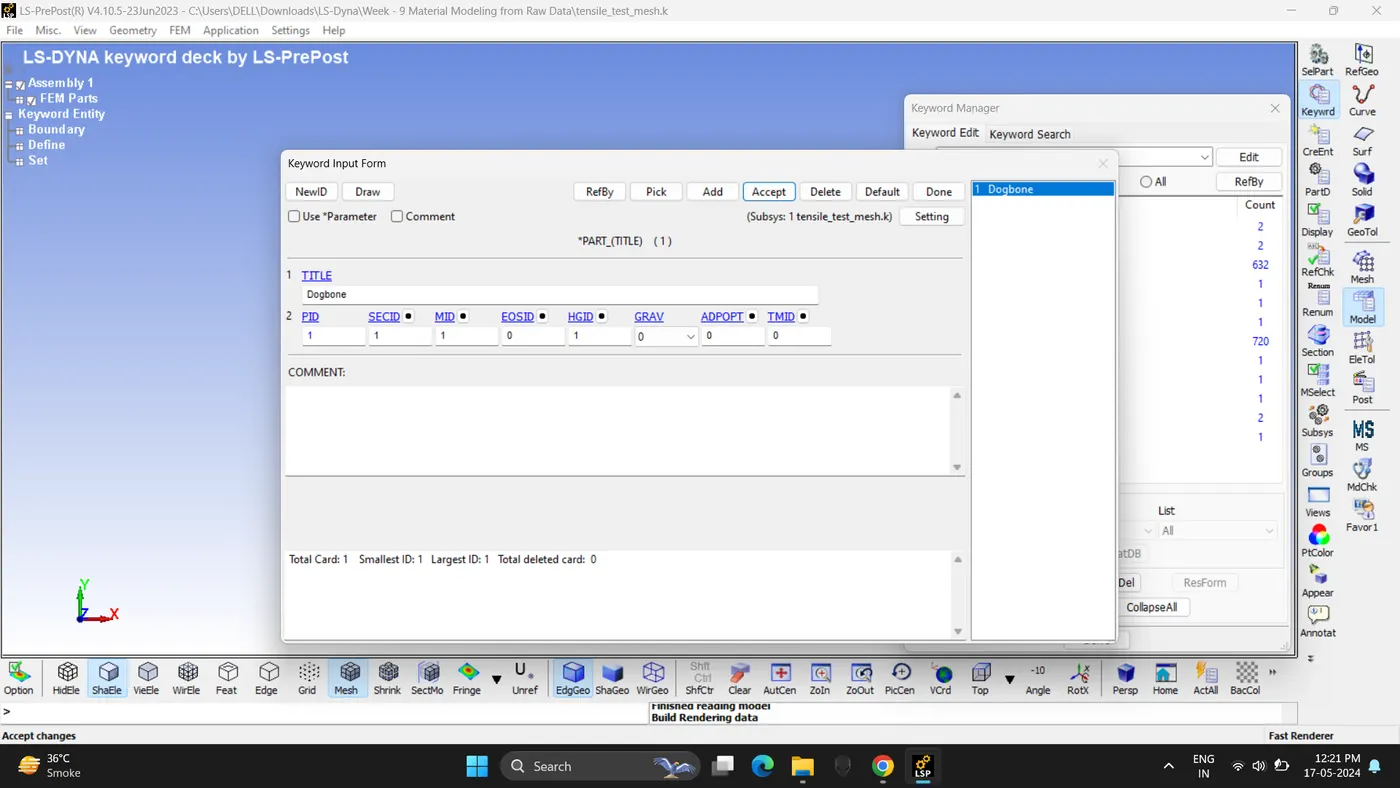
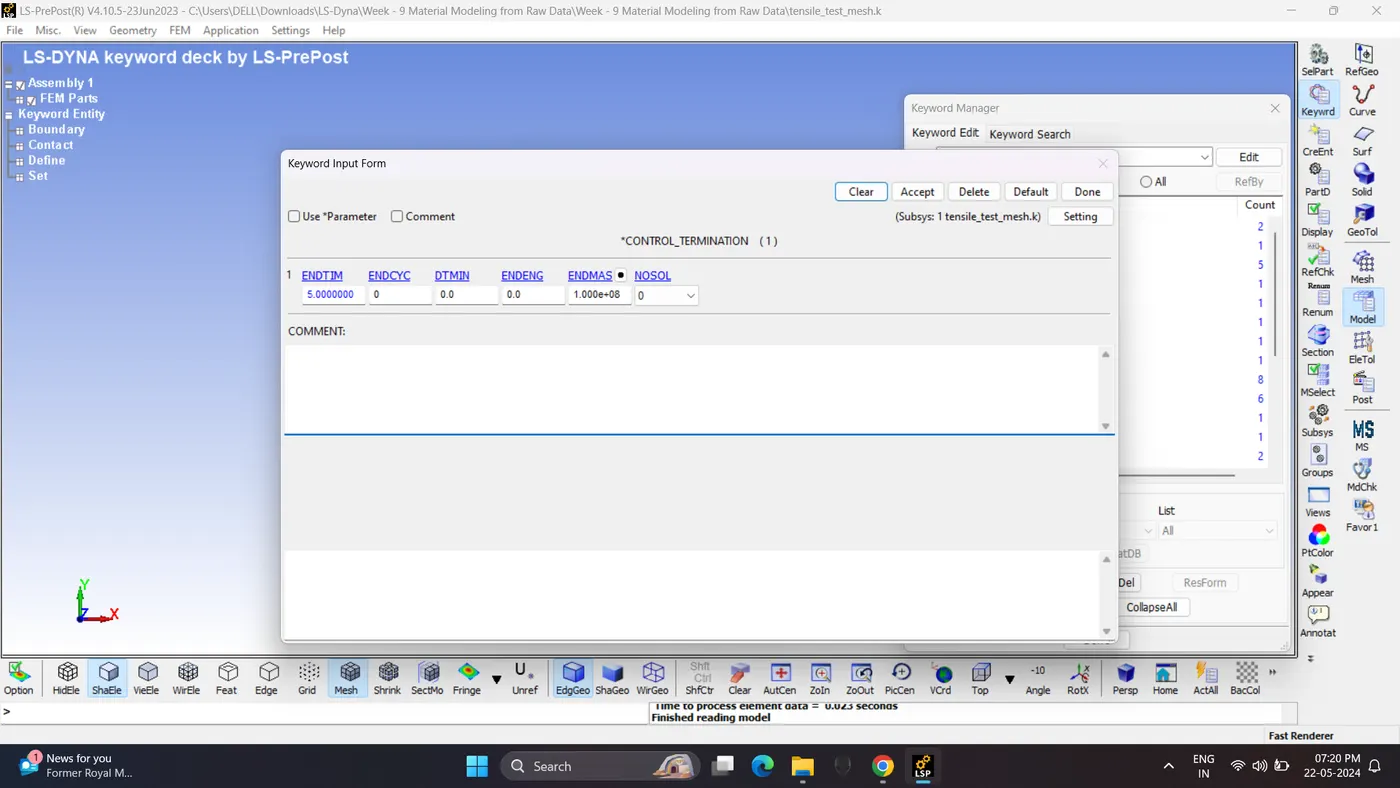
16. Create all the required control and database cards.
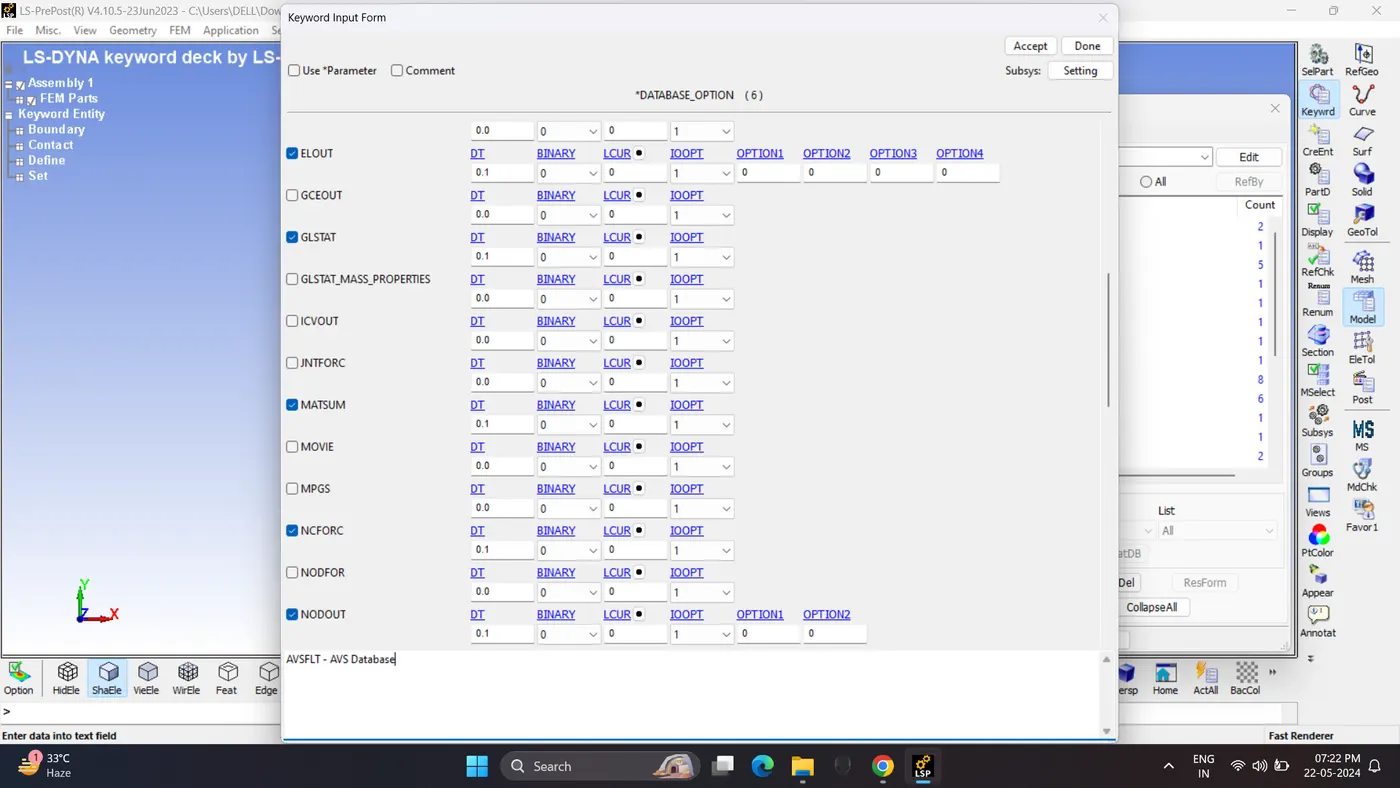
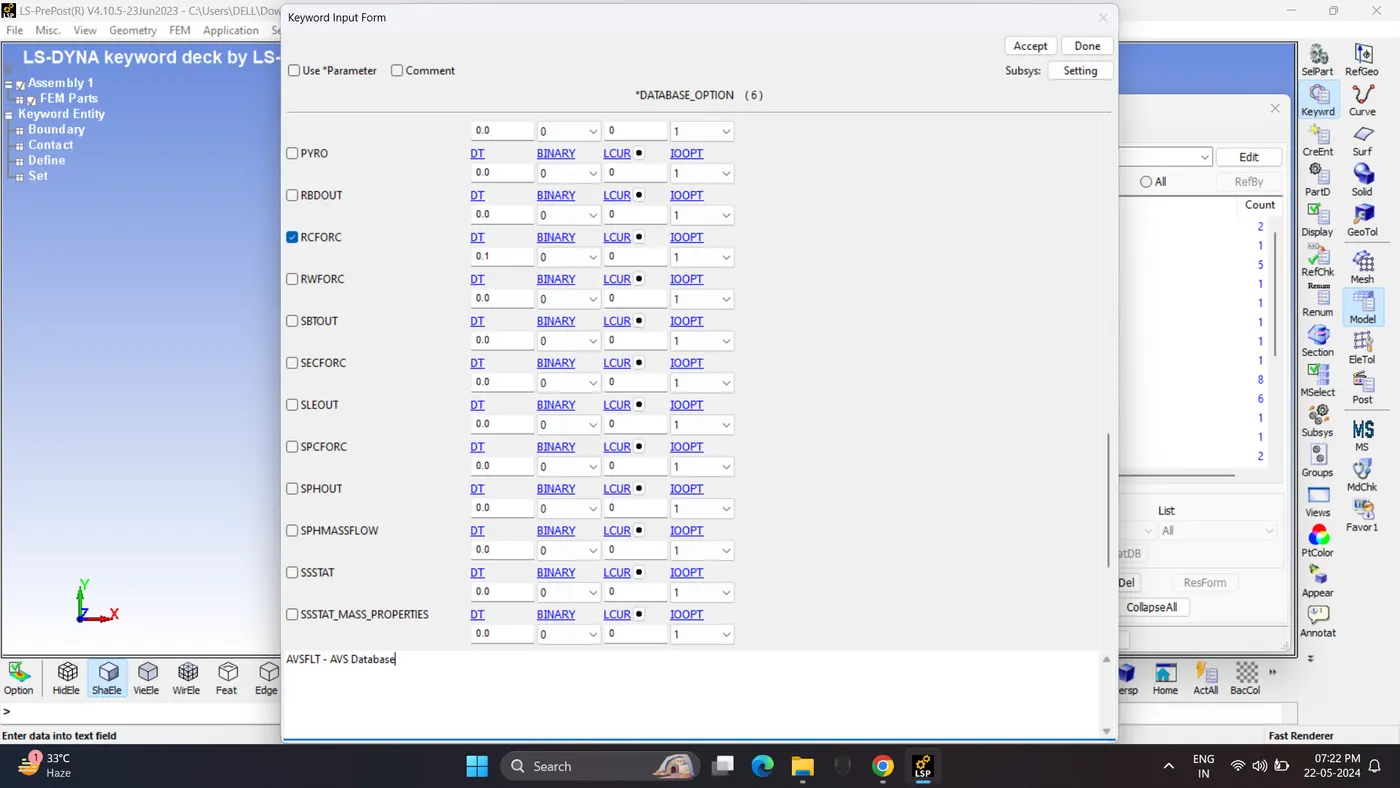
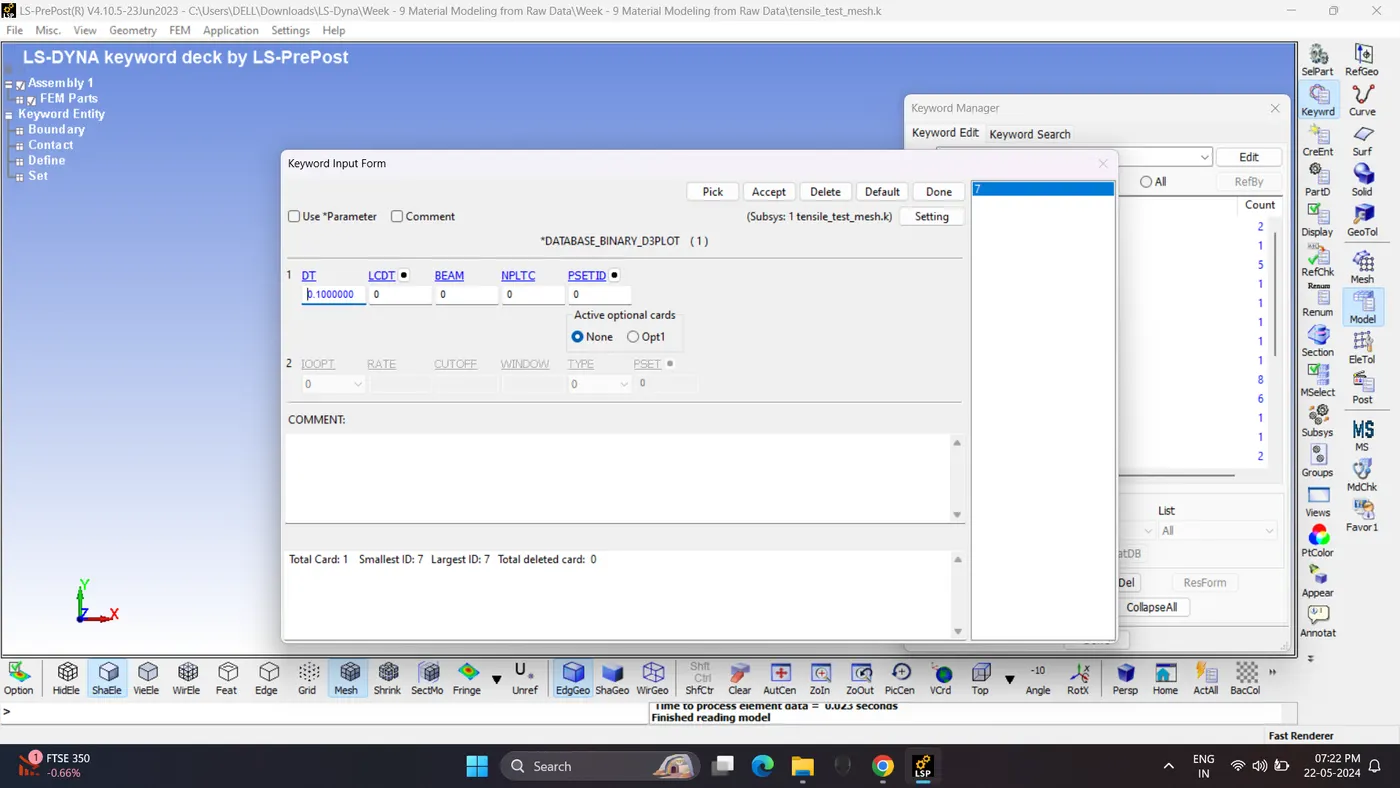
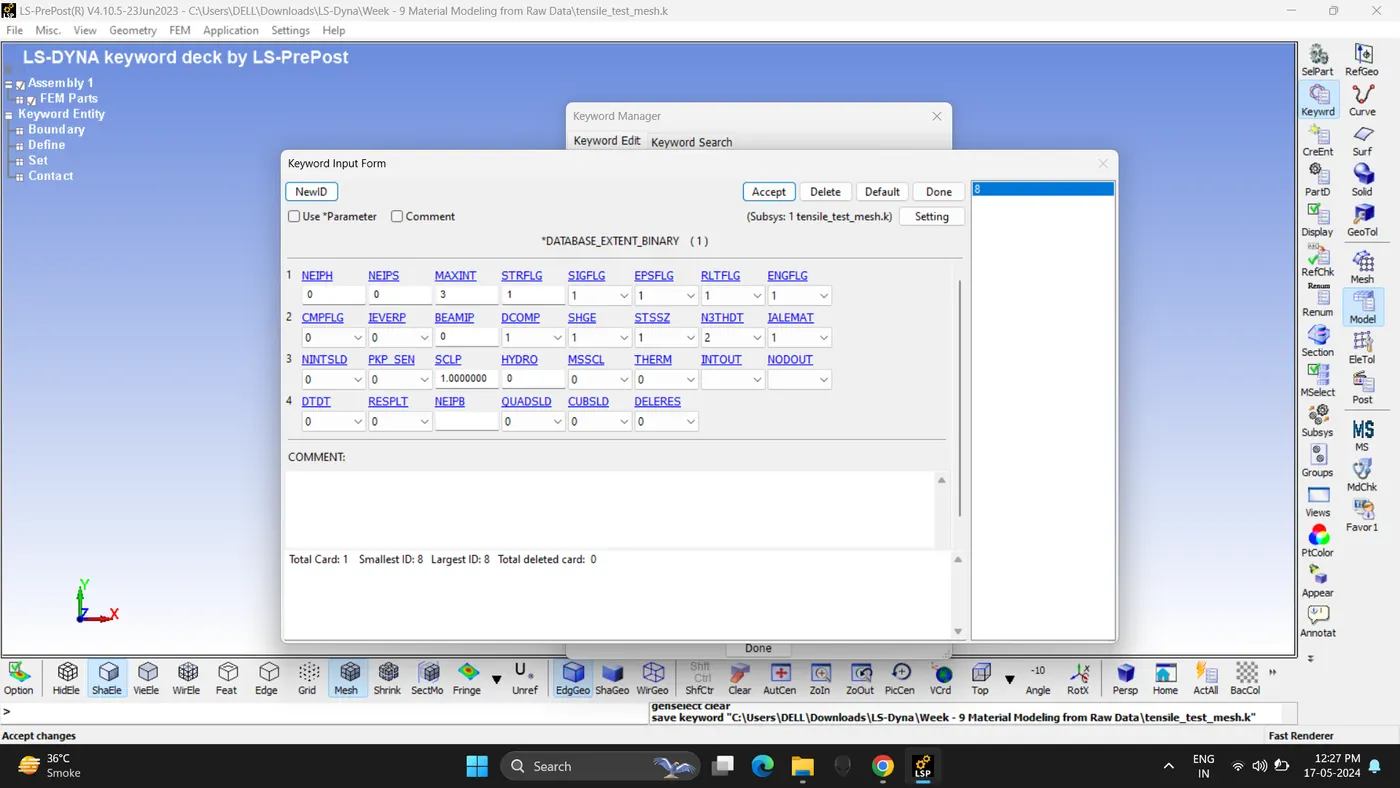
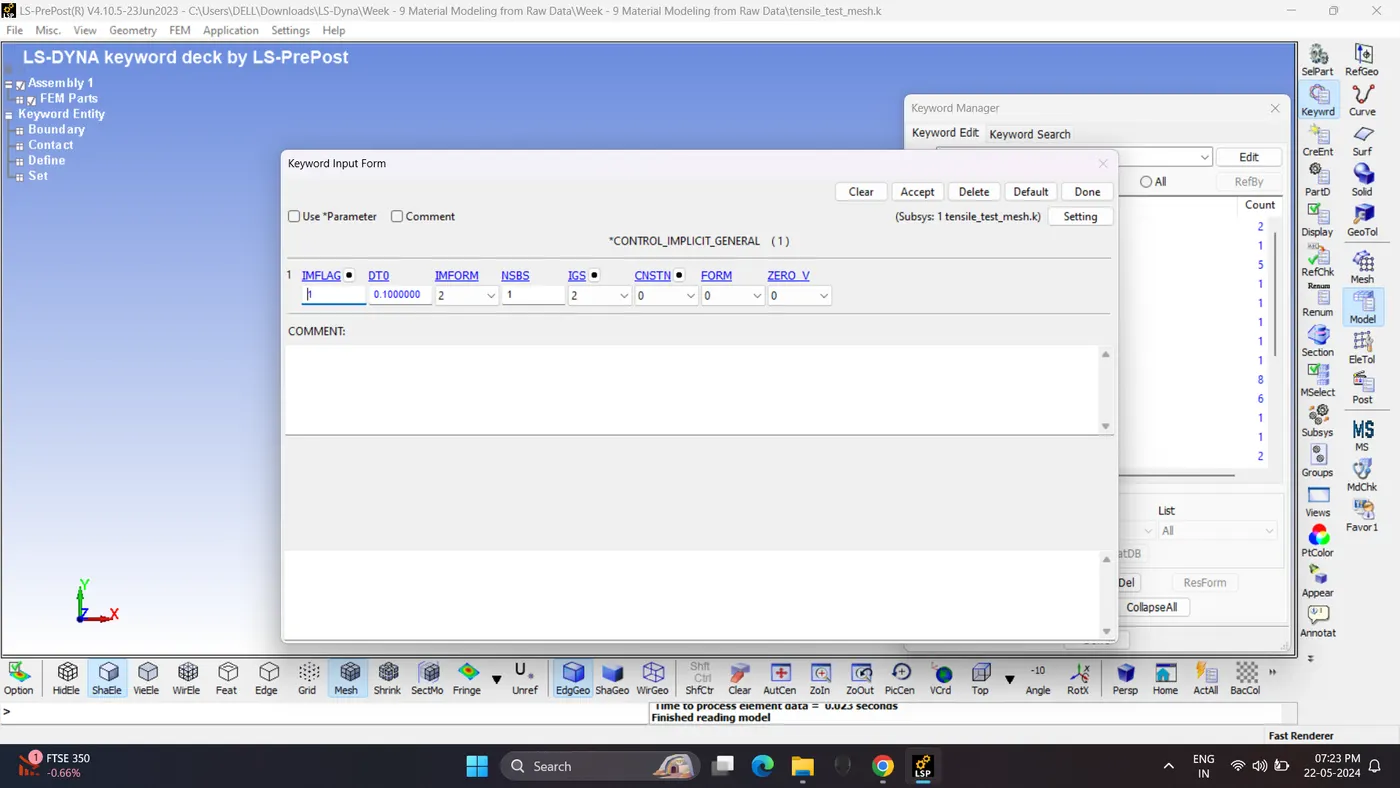
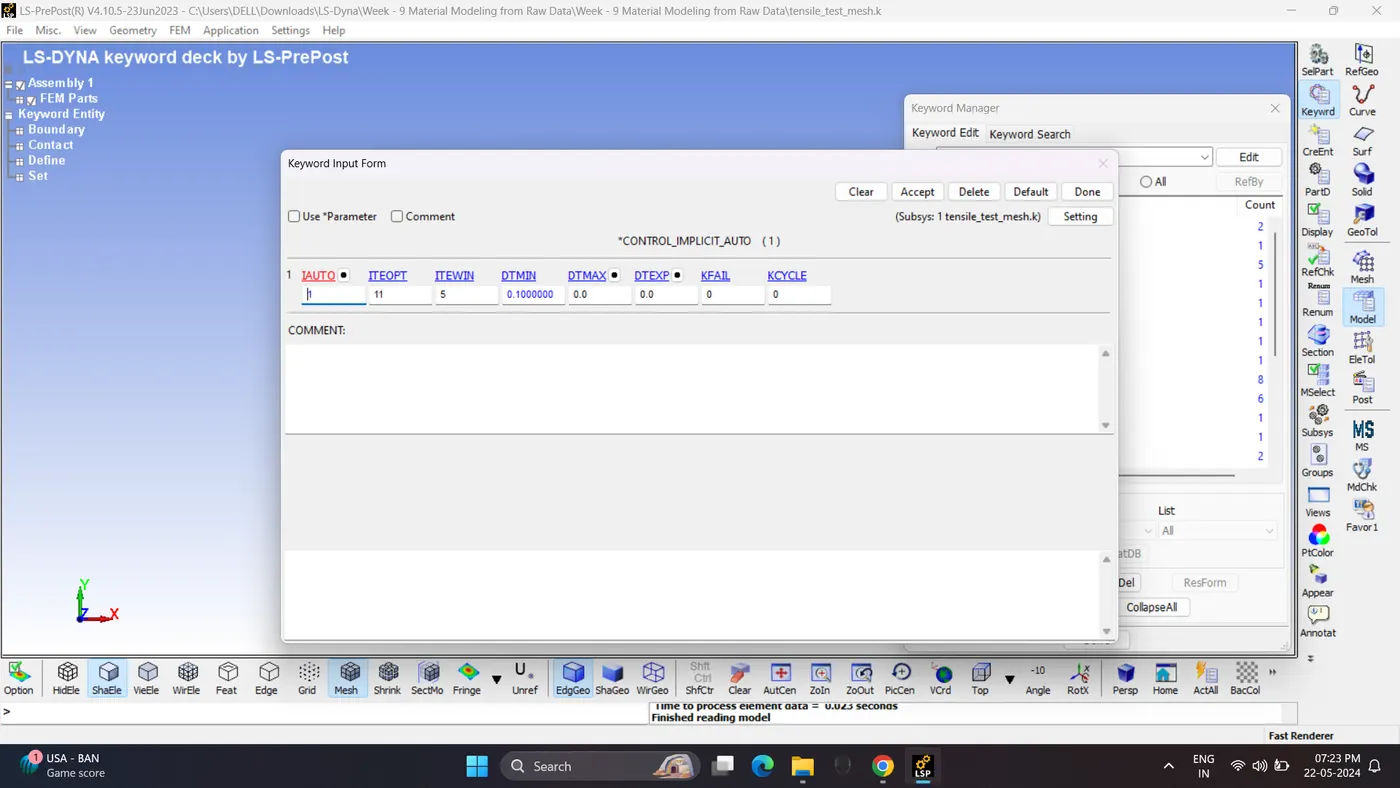
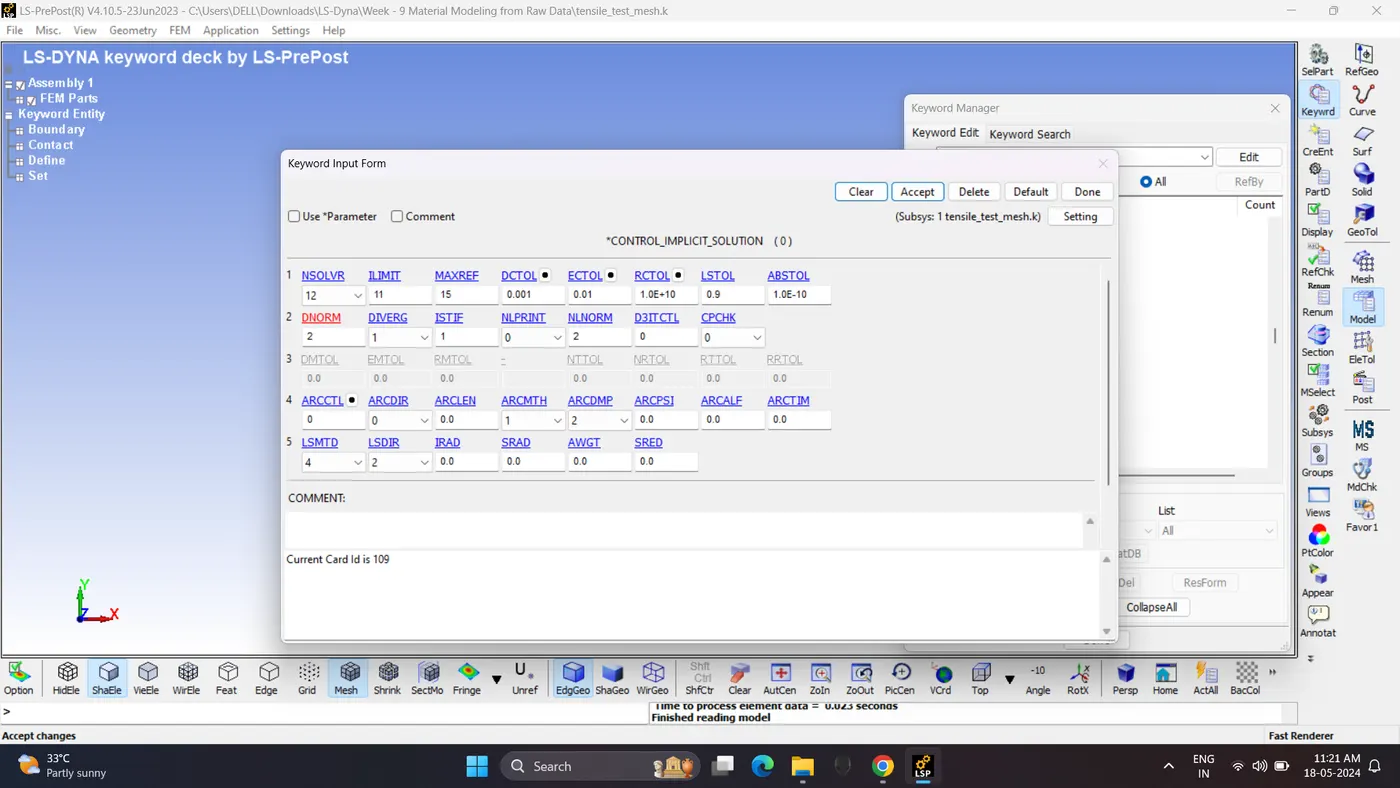
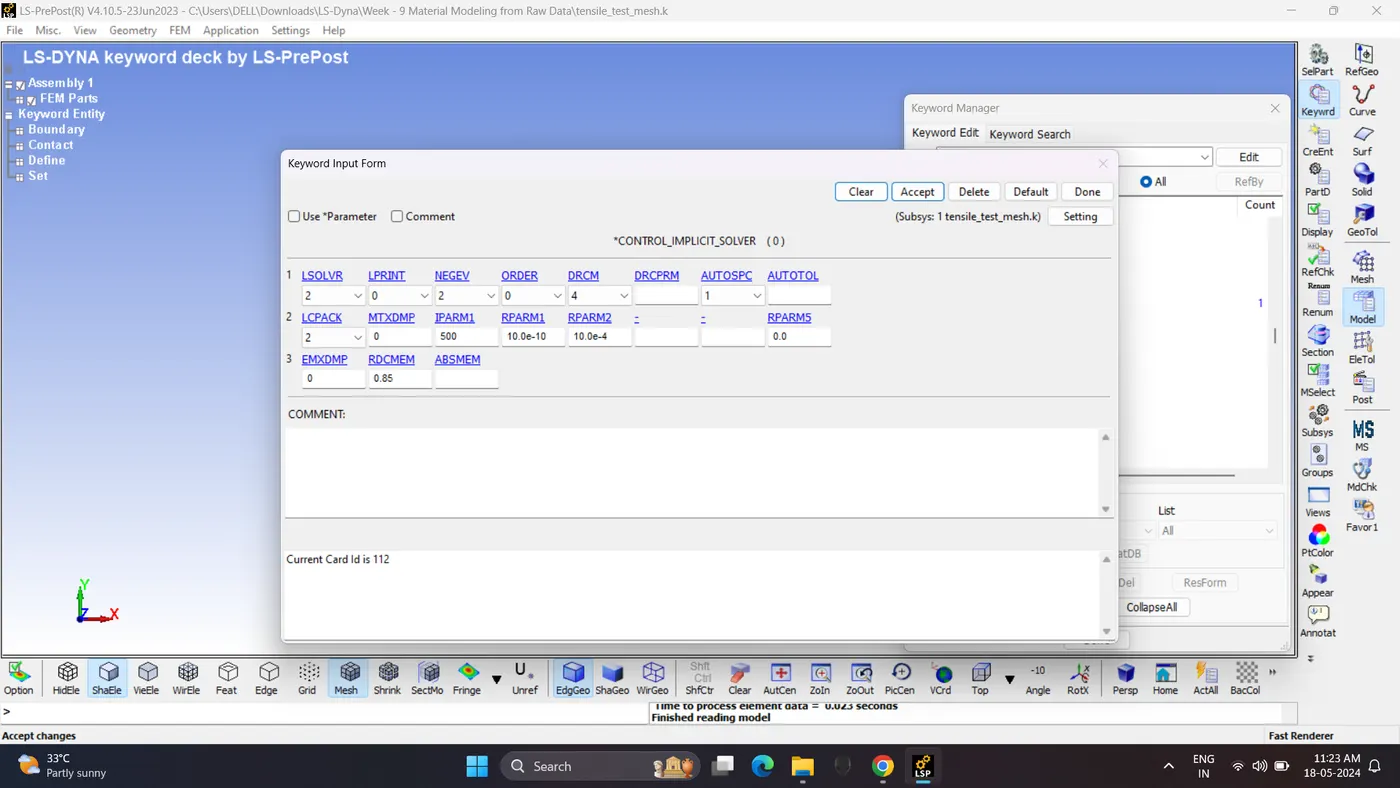
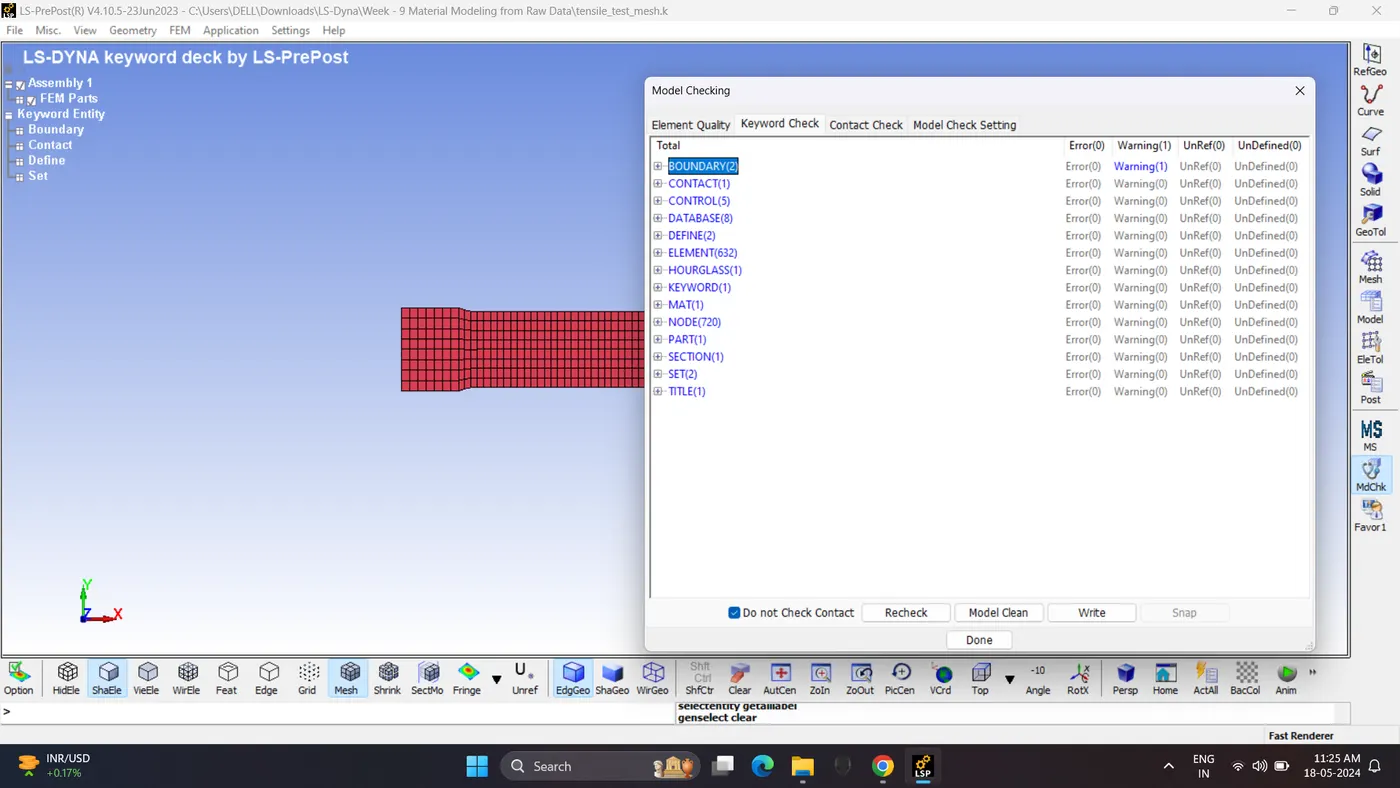
17. Run the model checker. Checke for any errors.
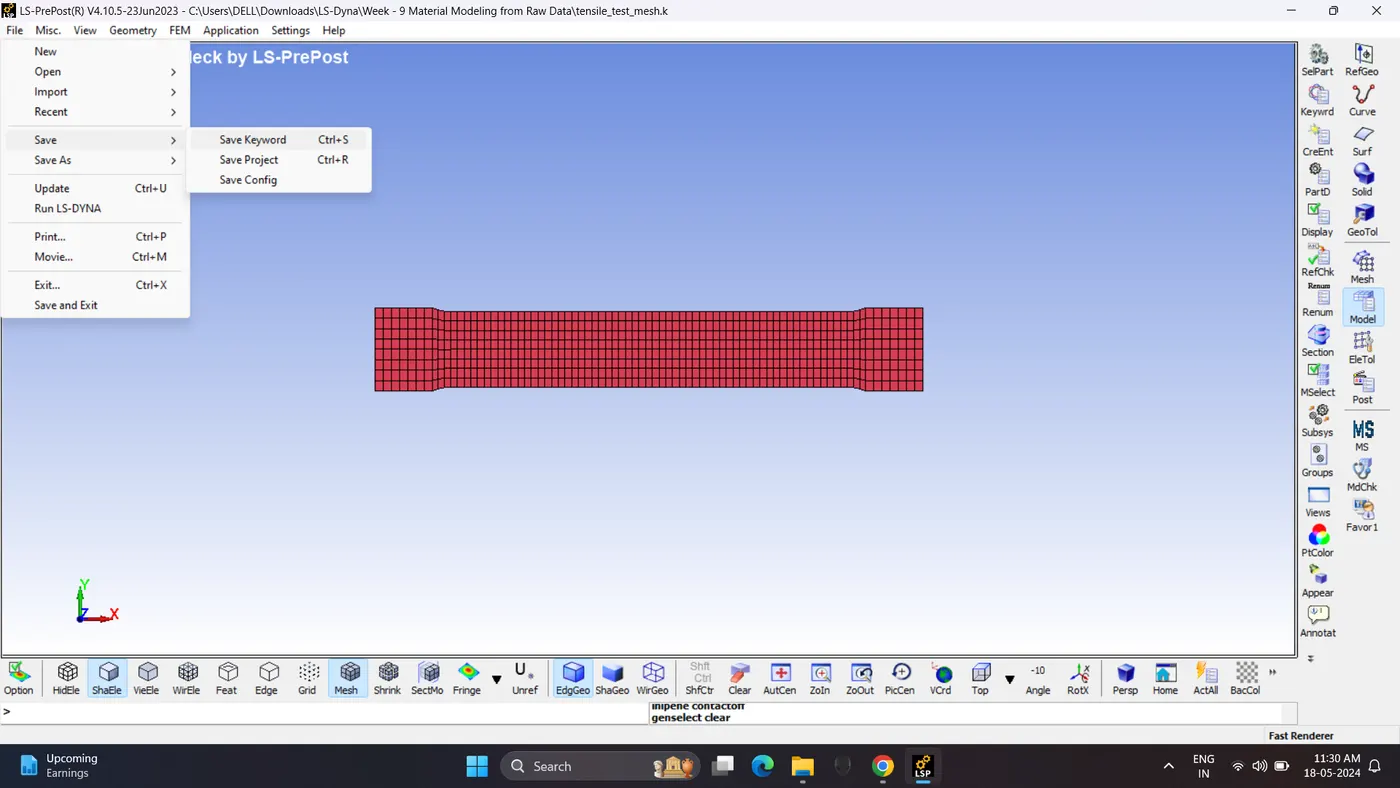
18. Save the Keyword File. Go to File - Save - Save Keyword.
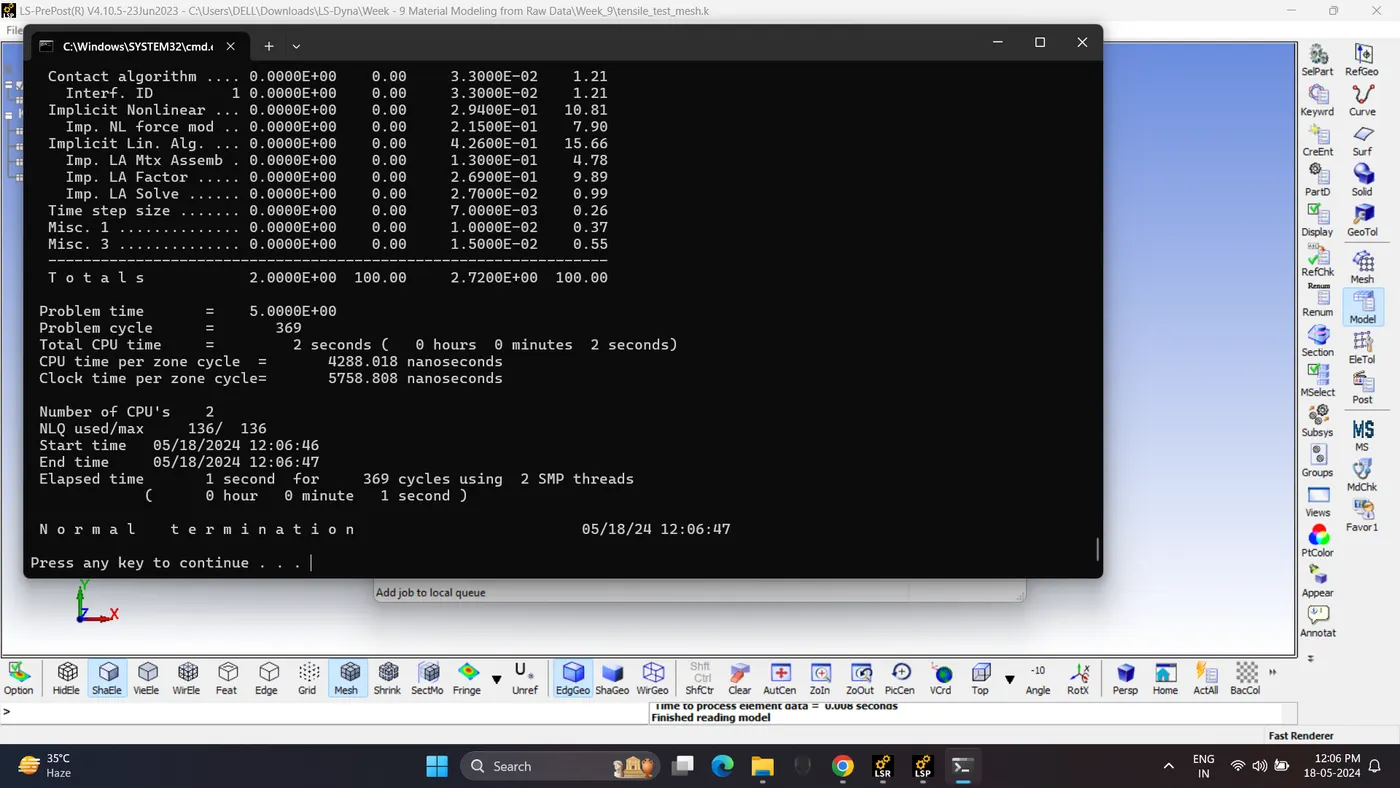
19. Run the Simulation. Open LS_Run - Select File - Click Add job to local queue.
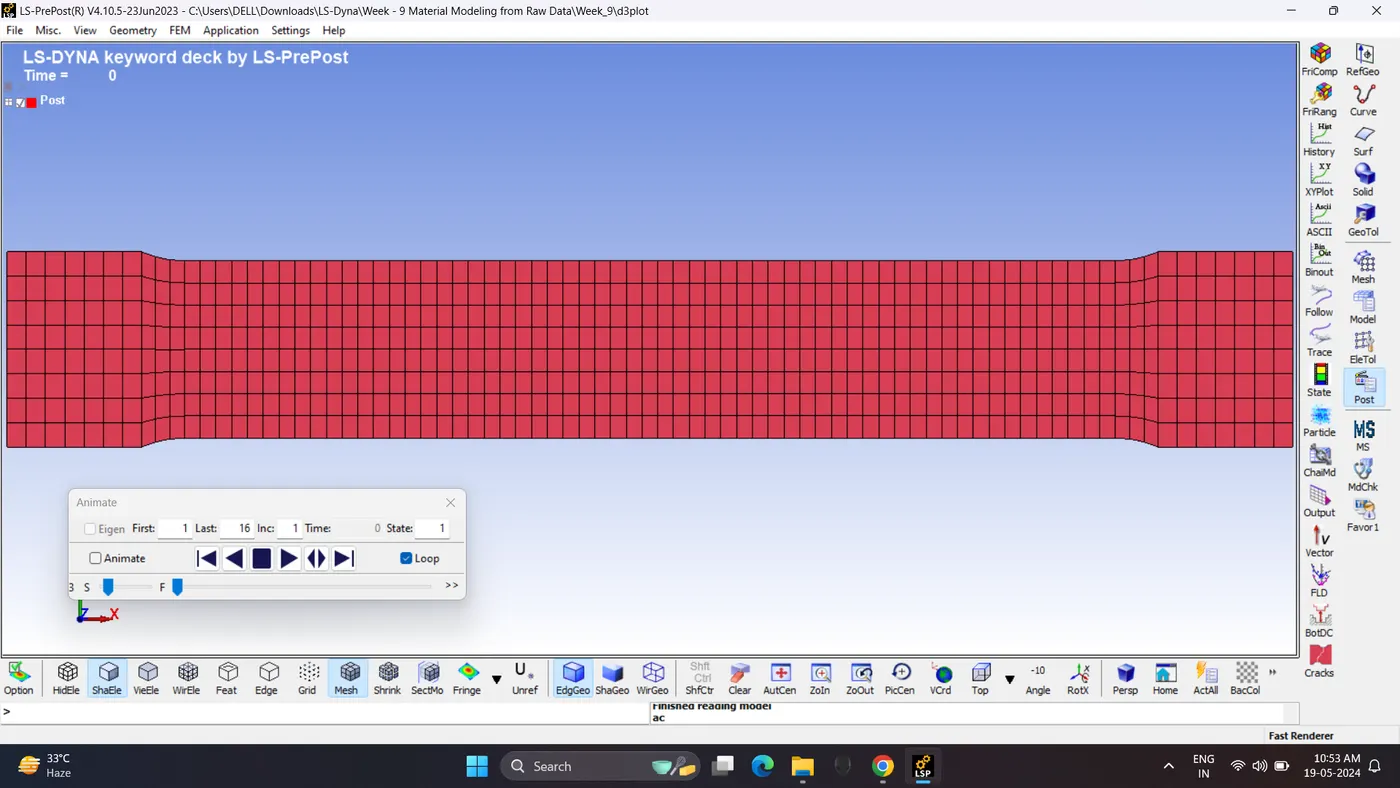
20. Open d3plot file.
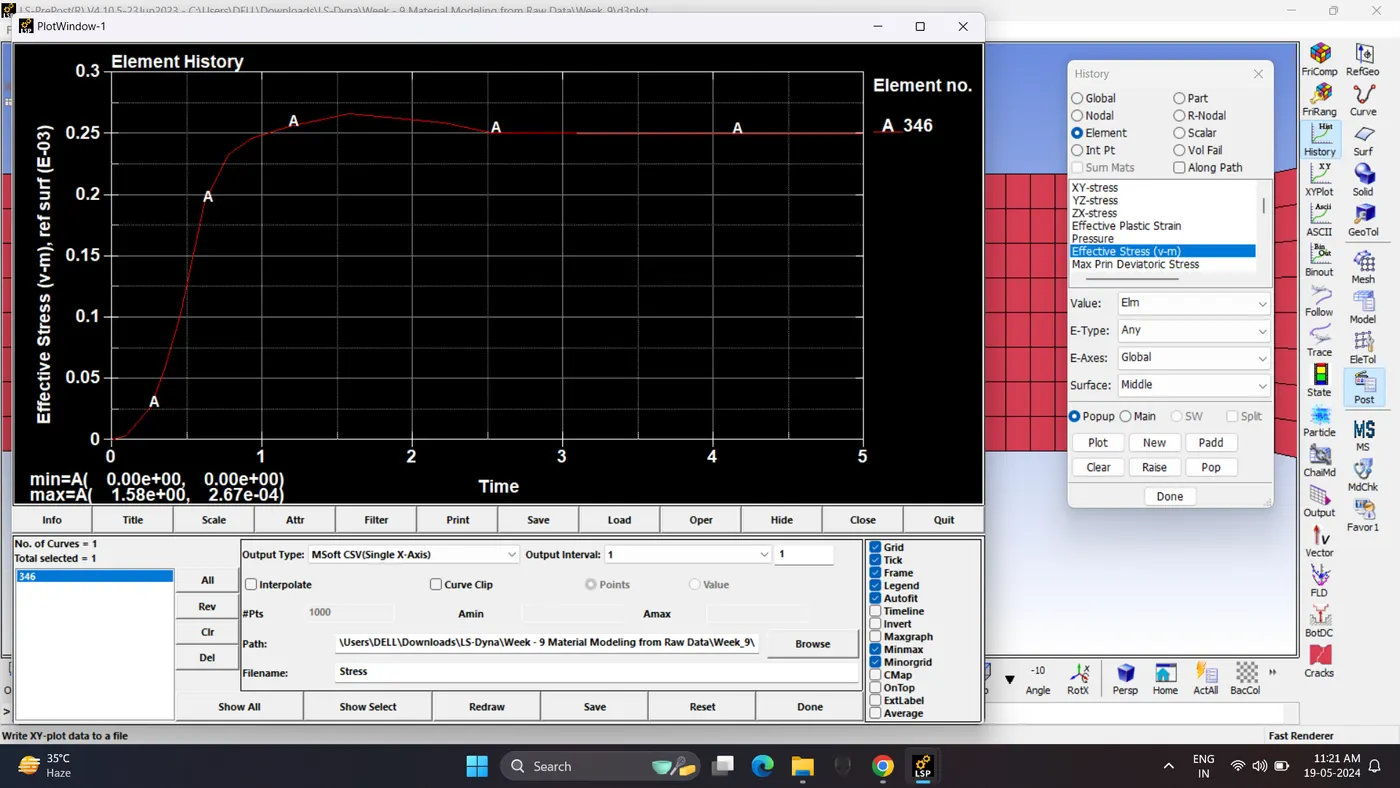
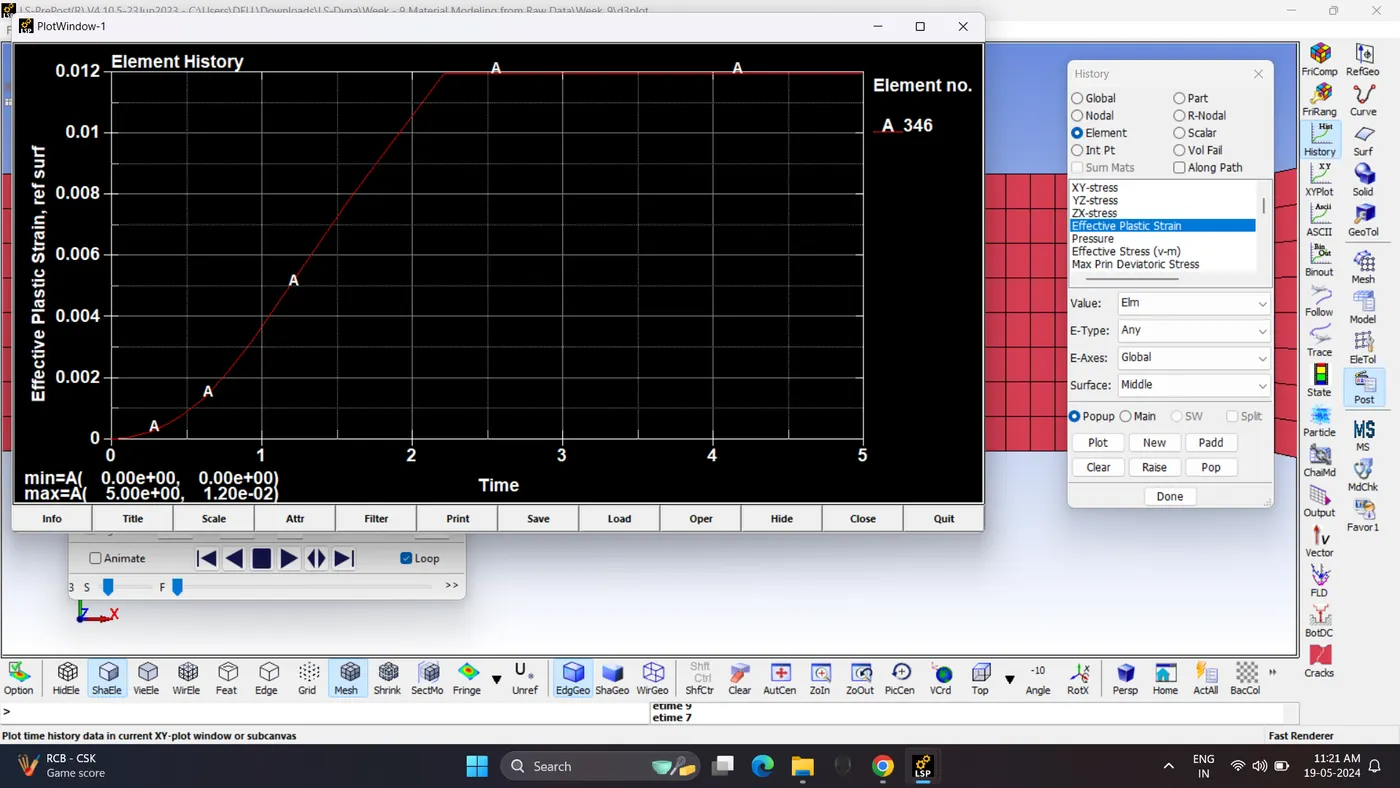
21. Plot the stress and strain graph of centre element. Post - History - Element - Effective stress / Effective Plastic strain.
Save the file in excel sheet.
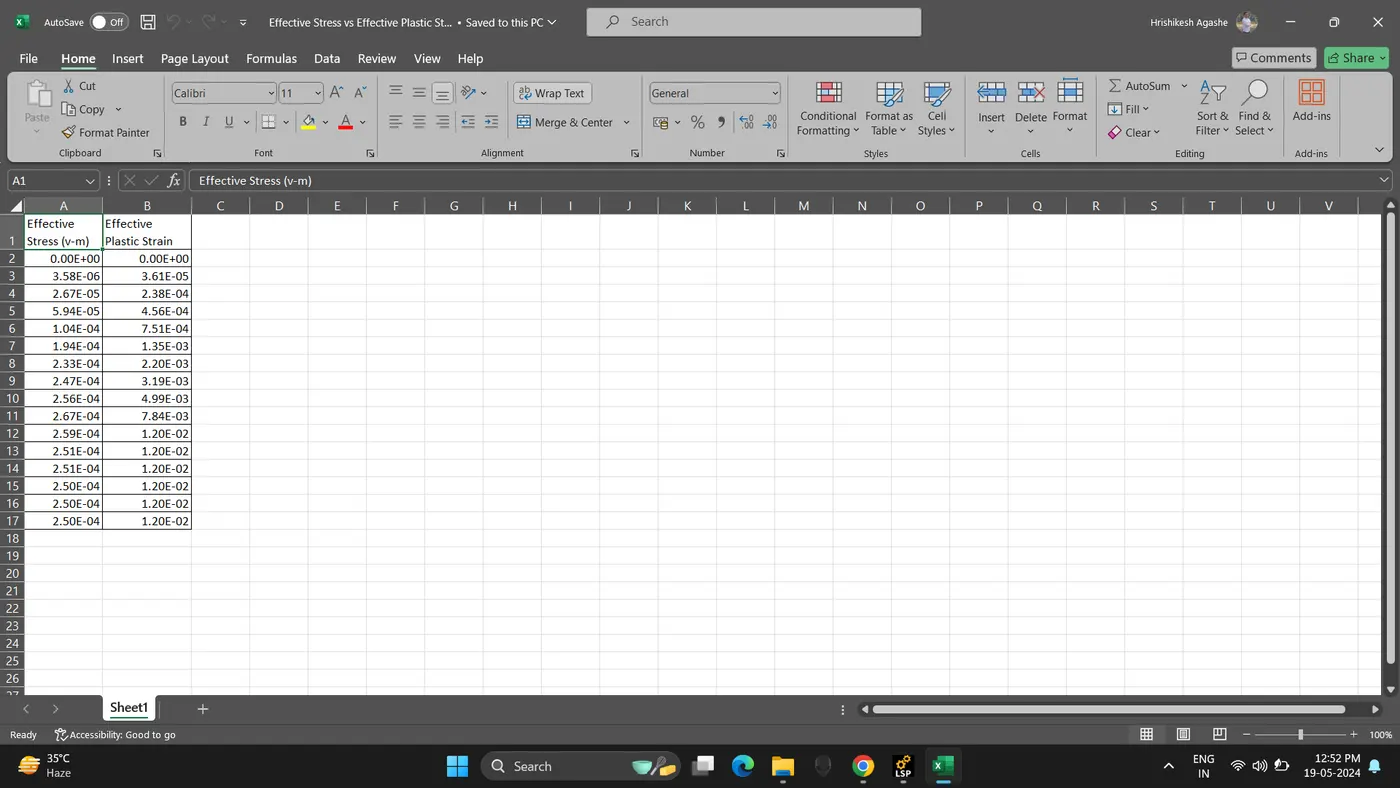
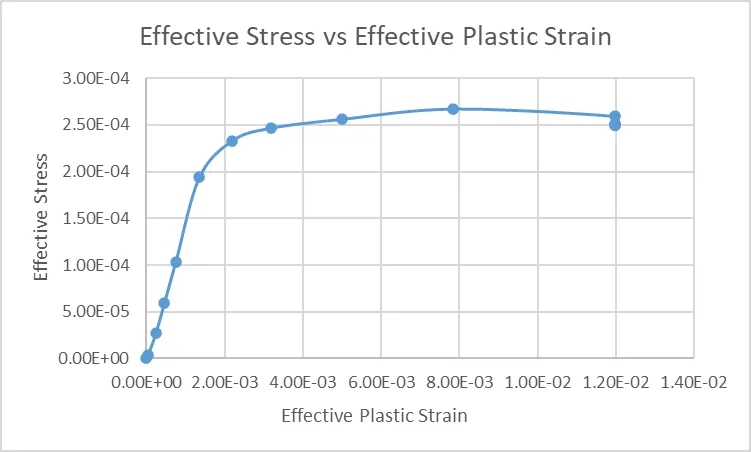
22. Get the both data in single excel file and plot the Effective Stress vs Effective Plastic strain graph in excel.
Validate:
Input Effective Stress vs Effective Plastic Strain
Output Effective Stress vs Effective Plastic Strain
Comparision of input and output of Effective Stress vs Effective Plastic Strain
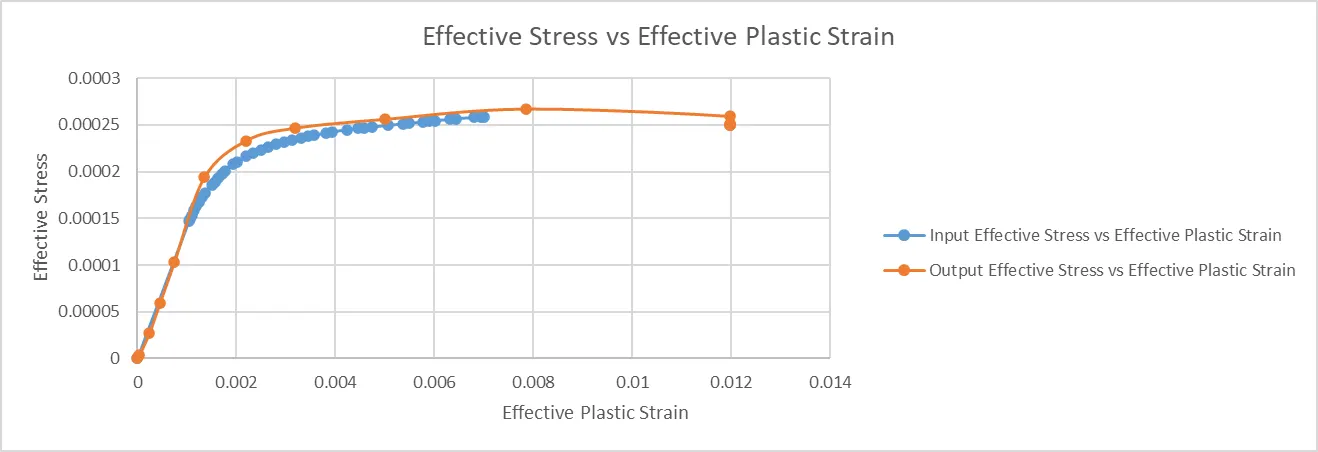
The data that we get from the FEA process are almost validates the Experimental Test data. The results can converge further if the size of the mesh can be smaller or the stiffness of the material can be more accurately entered in the material card.
From the Comparison of above plots,
Raw datas
Max effective stress reached = 2.59 e-04 kg/mm.ms²
Max effective strain reached = 7.01 e-03 mm/mm.
Simulated datas
Max effective stress reached = 2.67 e-04 kg/mm.ms²
Max effective strain reached = 1.20 e-02 mm/mm.
From above data we can observe that the graph values, raw values of 2nd curve and simulated values are almost equal to we can say that our material model is correct. In the Simulation result only strain is little higher than raw data
CONCLUSION:
1. The material test data were extracted successfully from the diagram.
2. All the test data were succesfully used for creating the material model .
3. The Material model was successfully used for the dog bone specimen used for the validation in the FEA.
4. The Implicit analysis of the dogbone specimen was carried out successfully.
5. The FEA results almost validates the Experimental test data given in the diagram.
6. The simulation objective has been achieved as a close to accurate material card (MAT-024-piecewise_linear_plasticity) has been verified for the graphite iron tensile test through verification of both physical and simulation results.