Week 9 Challenge (Simulink model of Energy Management Strategy(EMS) of an electric vehicle).
CHALLENGE 9
Objective:
To create a simulink model for Energy Management Strategy with battery,ultracapacitor and fuel cell for the positive power and distribute the power demand among these components.
The input of the EMS as power demand from power train unit and outputs are as power request from Ultracapacitor,battery and fuel cell.
Energy Management Strategy(EMS):
The vehicle industry is experiencing a technological revolution in the powertrains of vehicles. A hybrid electric vehicle (HEV) is an effective choice to solve the problems of the low energy density of a power battery and the short driving distance of an electric vehicle (EV).
Different configurations of HEVs have different control strategies, production costs, and applicable conditions.
However, for any configuration, the ultimate goal is to achieve the comprehensive optimization of the efficiency of the engine and the motor so as to improve the vehicle’s performance parameters such as economy, emissions, and durability.
The procedure of realizing the goal is commonly called an Energy Management Strategy(EMS).
The act of load sharing is mainly implemented through the EMS systems. According to the power demand of vehicle the power request from sources distributed among different energy giving
sources like ultracapacitors,batteries and fuel cells based on their power demand capability.
Process flow of EMS:
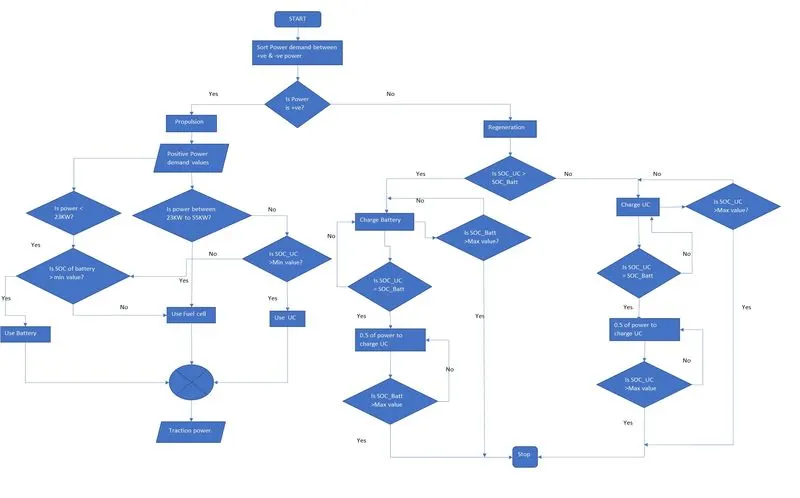
Before creating the simulink model of EMS, the process flow of power sharing mechanism was implemented in a flow chart.
Power Sharing:
The fuel cells having a range of operating condition to produce the power needed for propulsion.
Here we are taking fuel cell with have capability to produce power in the range of minimum 23KW to maximum 72KW. But for better effeciency of fuel cell power usage it is derived that fuel cells will operate at maximum efficiency in moderate power generation area as seen from polarization curve.
Thus we are considering lesser power production level for maximum fuel cell power generation as 55KW.
Batteries are prefered to operate in lower power demand conditions and ultracapacitors are prefered to operate in peak power demands.
Thus we are get the final power sharing between three components as,
- From 0 to 23 KW is drawn from battery unit based on its SOC condition.
- Above 23KW to 55KW will be drawn from fuel cell power.
- And above 55KW will be drawn from ultracapacitors based on its SOC condition.
- If SOC of UC is not enough to supply required power demand,in that case the power is drawn from battery as battery backup.
- If SOC of battery and UC are not enough to supply power demand, in that case alternate source is only fuel cell.Power is drawn from fuel cell as fuel cell backup. But at this operating conditions, the overall efficieny of vehicle is reduced as fuel cell can't support with full efficiency for peak power demands and lesser power demands.
Model:
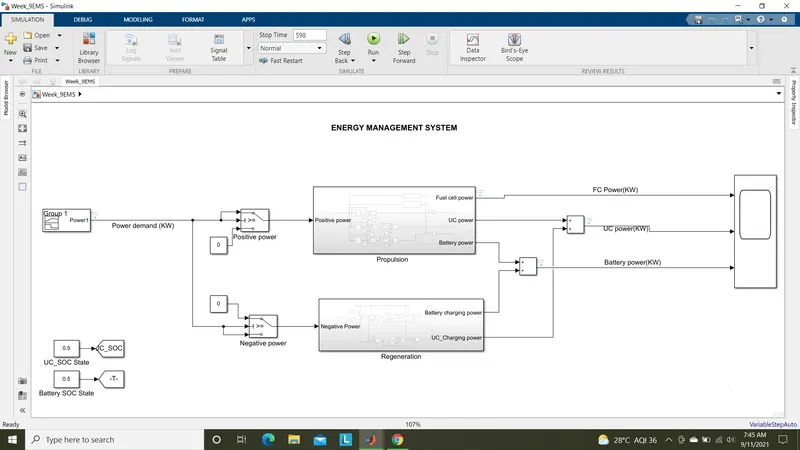
Here from the model we see that,
Input of the model is Power demand(KW),which can be provided by the power train of the vehicle as load power demand to move vehicle.
The output of the model is the power request to fuel cell,ultracapacitor and battery to get power drain and charge during regeneration.
Construction and working:
Step 1:
As per the flow chart mentioned above we can start to build the model.
Initially power demand values from power train was given as input,for simplicity we had given using a signal builder block.The values are uploaded from an excel file as power with respect to time.
The uploaded power demand signal is shown as below,
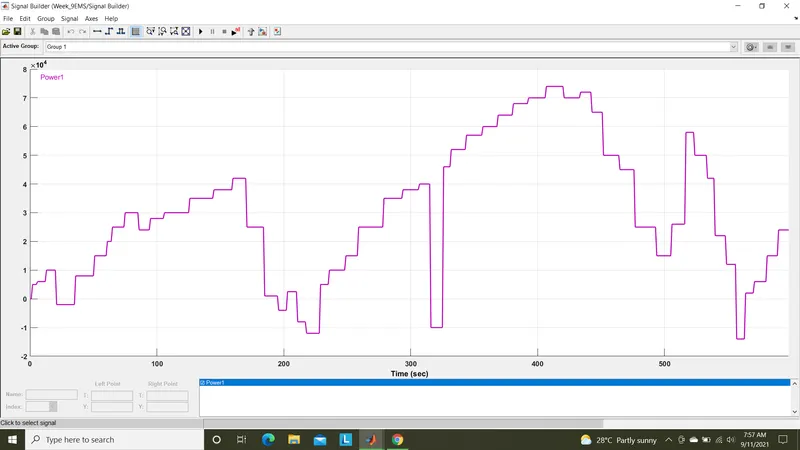
From this power demand signal we can see that there is positive power demand as propulsion power demand and negative power demand as power generated during regeneration to charge battery or ultracapacitor.
The fuel cell doesn't accept the regenerated power as fuel cell are operate only in propulsion mode.
The condition of state of charges at a particular time of ultracapacitor and batttery are given in a constant block as shown in model and given to Goto blocks for using it in subsystems.
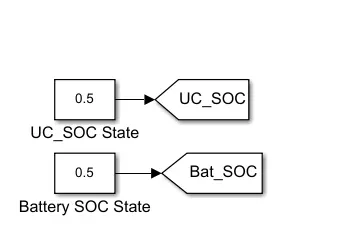
The maximum and minimum values of SOC of battery and ultracapacitor are given in work space as shown below,
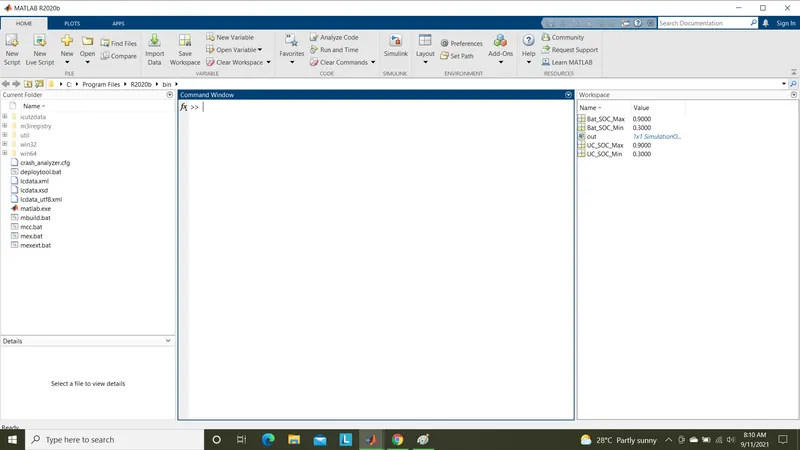
The maximum SOC values of UC and Battery are given as 90%.
The minimum SOC values of UC and Battery are given as 30%.
Step 2:
The Power demand values are sorted into positive power demand and negative power demand as shown below,
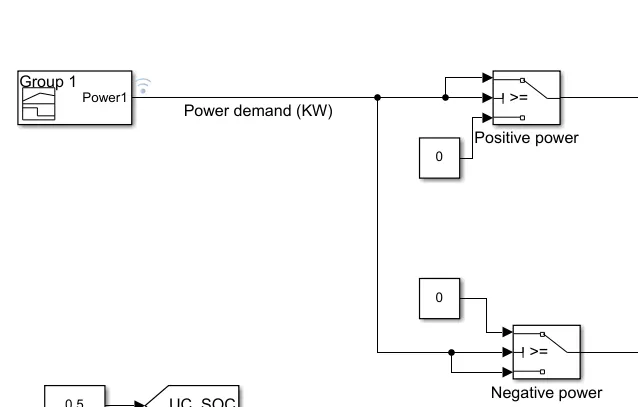
The positive power is given as input for propulsion power subsystem and negative power is given to regenerattion subsystem.
Step 3:
Propulsion power subsystem-
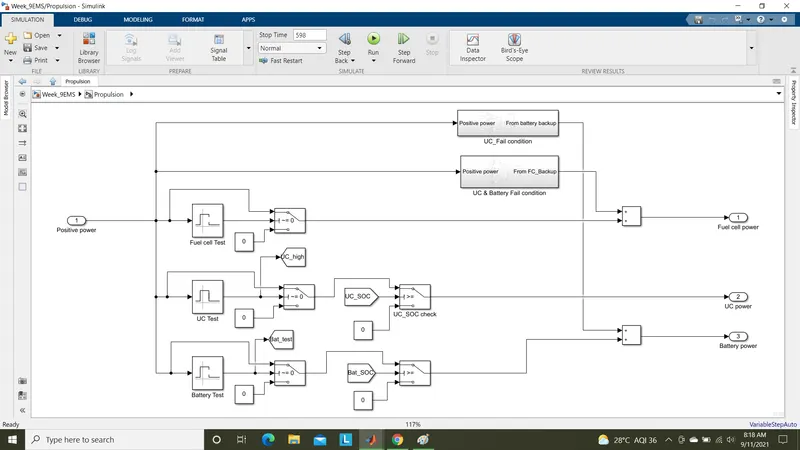
In propulsion subsystem(positive power) the power demand is tested for three components UC,Fuel cell and Battery based on their operating ranges using 'interval test' block as shown below,
For fuel cell test,operating range set as from above 23KW to 55KW.
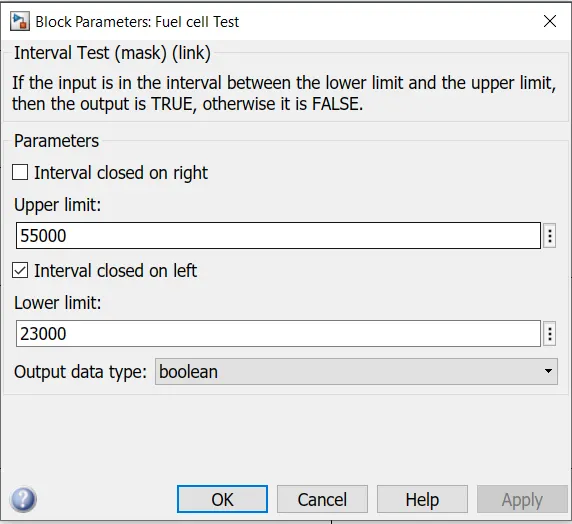
If the condition is true then the output of this block is 1.This output is checked with a switch block as input where, if the input is 1 then this positive power is considered as fuel cell power request.
For ultracapacitor test,operating range set as from above 55KW.
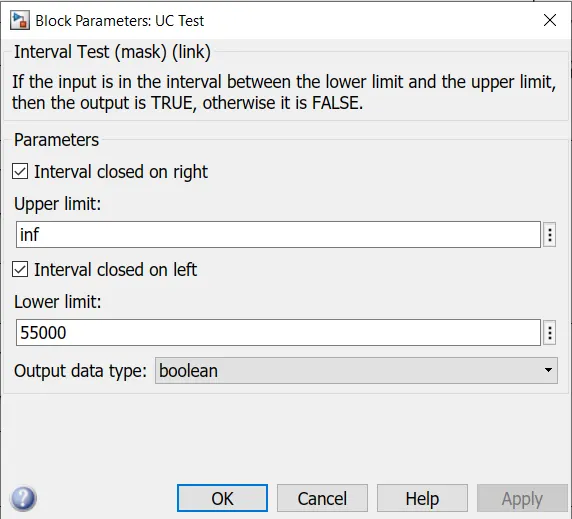
If the condition is true then the output of this block is 1.This output is checked with a switch block as input where, if the input is 1 then this positive power is again checked for UC_SOC condition.
If the SOC of UC is >= its minimum value, then this positive power is considered as ultracapacitor power request.
For battery test,operating range set as from 0 to 23KW.
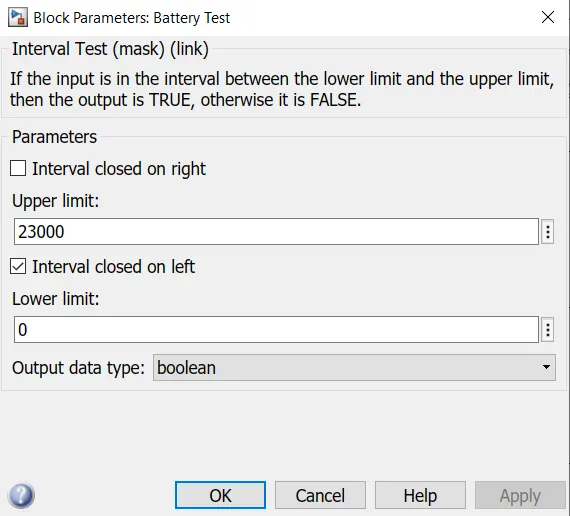
If the condition is true then the output of this block is 1.This output is checked with a switch block as input where, if the input is 1 then this positive power is again checked for battery SOC condition.
If the SOC of battery is >= its minimum value, then this positive power is considered as battery power request.
Step 4:
But during ultracapacitor and battery fail conditions as less than their minimum SOC values we have to shift its power request to primary source of fuel cell.
These operations are modelled as below.
Ultracapacitor fail subsystem-
This subsystem consist of logic conditions as shown below,
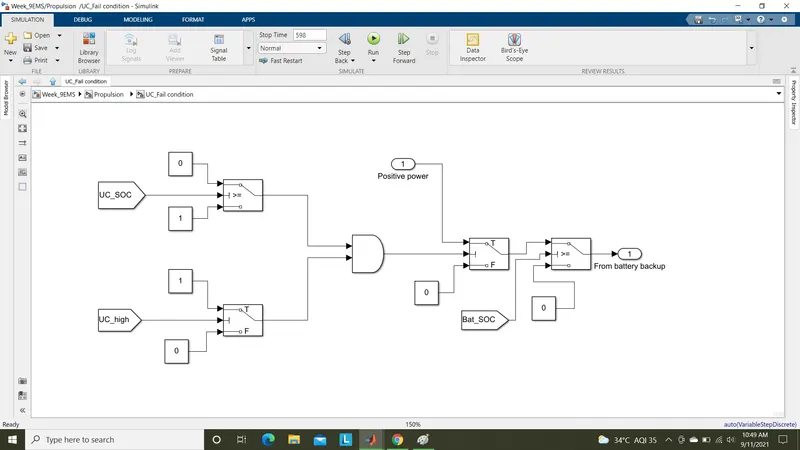
In this subsystem, the SOC of UC is checked as a FAIL condition using a switch block to give as output 1 and 0 for true condition.
The UC_test result is again checked with a switch block as it is TRUE(1) for above 55KW.
Both the signals are given to an AND block as this back up operation will set ON only both signals are TRUE.
Final output from AND is checked in a switch block, if output is 1 this positive power input is consider as battery backup source when Bat_SOC > Min. value as shown above as from outport 1.
UC and Battery fail condition:
If both the SOC of UC and battery are less than their minimum values, in this stage the power drawn source is shifted to fuel cell.
This operation is implemented in this subsystem as shown below,
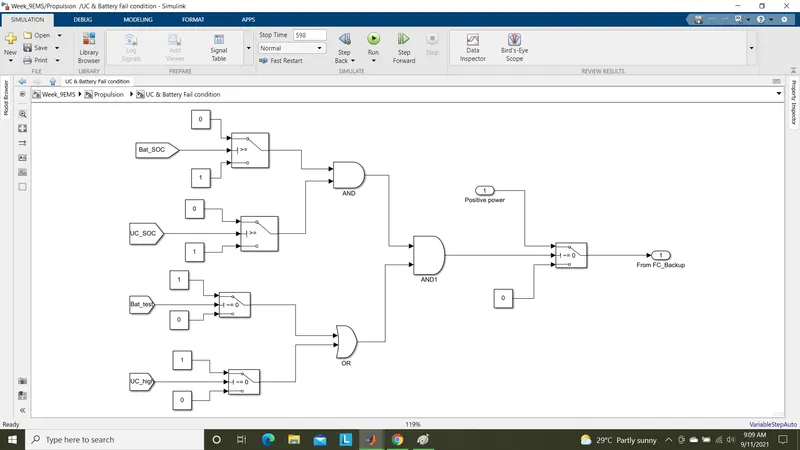
Initially the SOC's of UC and battery are checked for FAIL conditions using switch blocks to give as output 1 and 0 for true condition.
These two signals are given to an AND block as both the values should get failed to get output as 1 from this AND block.
Then the battery test result and UC test results are again checked with switch blocks for their TRUE states as for 0-23KW and above 55KW operating conditions.
These signals are given to a OR block to get output 1 as even any one condition is true the output is TRUE.
The signals from AND block and OR block are given to another AND1 block. The result is 1 if both the signals are true.
Final output from AND1 is checked for true condition.if output is 1 then the positive power is considered as Fuel cell backup power as shown in model.
Addition of powers:
- The power output from FC test and backup FC power are added to get final propulsion FC power.
- The power output from battery test and backup battery power are added to get final propulsion battery power.
- The power output from UC_test as final propulsion UC power.
Step 5:
Regeneration power subsystem-
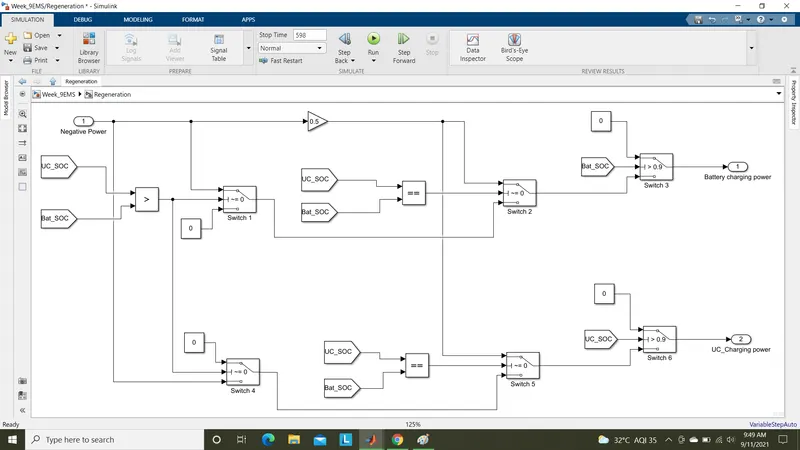
In regeneration power(Negative power) subsystem,
It was checked for UC_SOC > UC_Battery with the switch block.If the condition is true(1) then the negative power demand is passes as output from the switch 1.
Then if UC_SOC==Bat_SOC was checked, a half of the negative power is given as battery charge power and if fails the output from Switch 1 is given as battery charge power.
This battery charge power was checked in a switch 3 as if Bat_SOC >90% charging will not occur and if condition fails this batteery charge power from switch 2 is considered as final battery charging power.
It was checked for UC_SOC > UC_Battery with the switch block.If the condition is False(0) then the negative power demand is passes as output from the switch 4.
Then if UC_SOC==Bat_SOC was checked, a half of the negative power is given as UC charge power and if fails the output from Switch 4 is given as UC charge power.
This UC charge power was checked in a switch 6 as if UC_SOC >90% charging will not occur and if condition fails this UC charge power from switch 5 is considered as final UC charging power.
Step 6:
Addition of powers-
The regenerative UC power and final UC propulsion power are added to get final output UC power request.
The regenerative battery power and final battery propulsion power are added to get final output batttery power request.
The final propulsion power as final output FC power request.
Results:
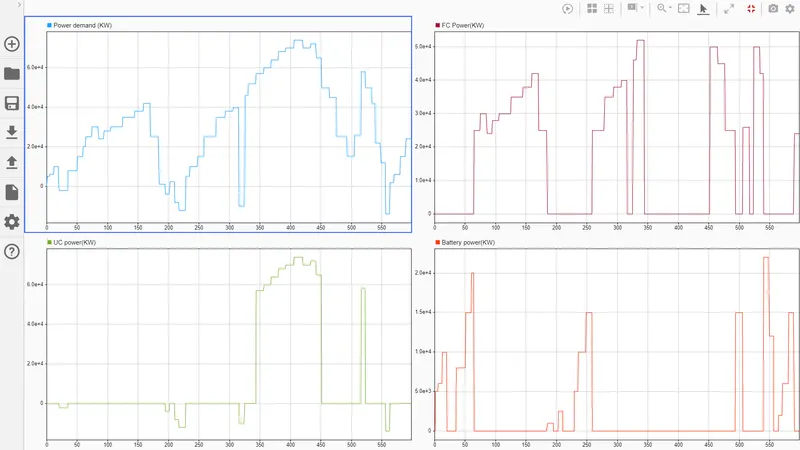
Running the simulation for 598 Secs and the results are as fallow,
Case 1: UC_SOC > Bat_SOC condition-
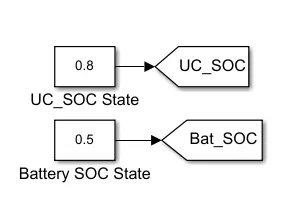
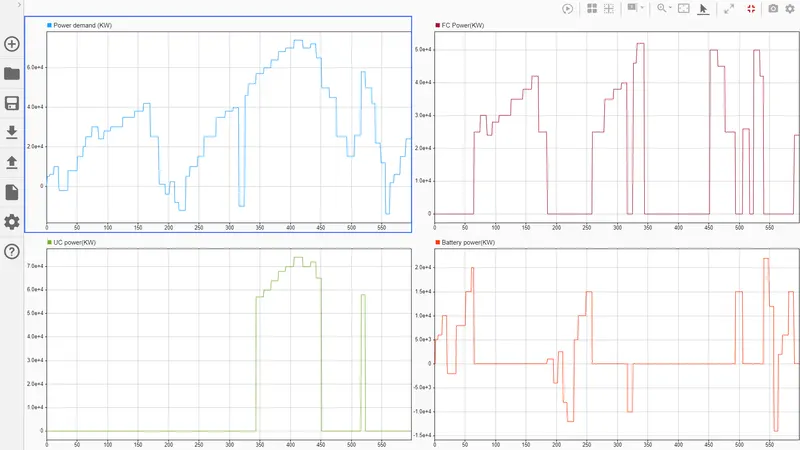
From the above plots we can understand that according to the power demand values the power request are shared to different sources as UC Power,Battery Power and FC Power based on their
operating regions.
The power demand above 23KW is acheived by Fuel cell, above 55 KW is acheived by Ultracapacitor and 0-23KW from Battery source as seen from plots.
And also as UC_SOC is greater than Bat_SOC the charging power is shifted to battery to charge first rather than ultracapacitor.This can be verified as charging(Negative power) is occuring in Battery power plot alone and not in UC power plot.
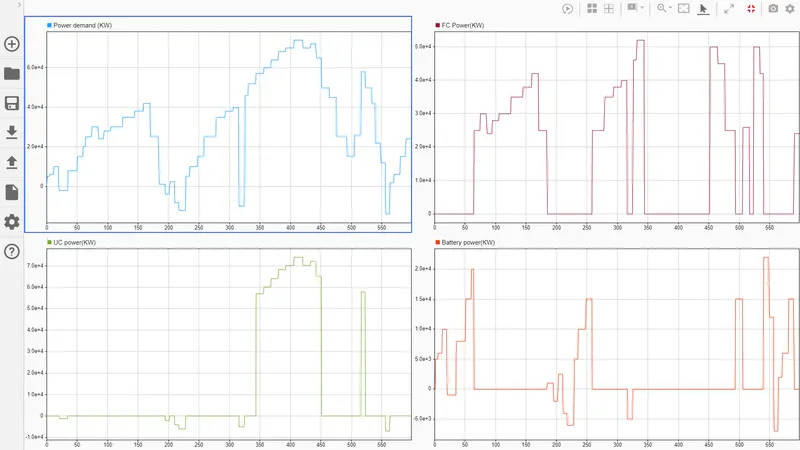
Case 2: UC_SOC< Bat_SOC-
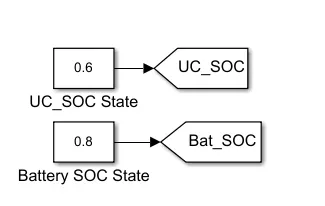
As Bat_SOC is greater than UC_SOC the charging power is shifted to Ultracapacitor to charge first rather than Battery .This can be verified as charging(Negative power) is occuring in UC power plot alone and not in battery power plot.
Also the power demand are shared to three components based on their operating ranges as seen earlier.
Case 3: UC_SOC == Bat_SOC -
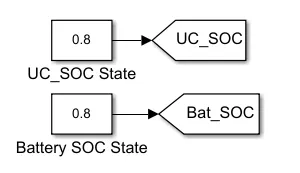
As both UC and Battery are having same SOC values the charging power are equally shared to UC and battery as we see from above plots.
Case 4: UC_SOC < min value & Bat_SOC >Min value- (UC Fail condition)
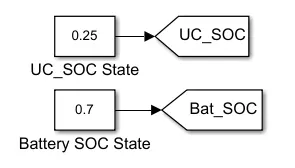
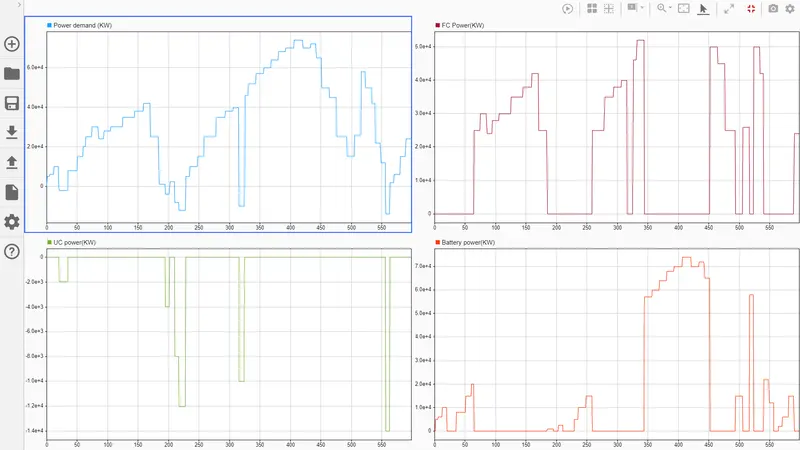
In this UC fail conditon the power request of UC is also acheived by Battery along with battery operating range conditions.The load is increased to battery in these situations.
As we see from plot that the power demand above 55KW is also acheived by battery itself along with 0-23 KW range.
Ultracapacitor fails to operate in this situation as seen from plot and only charging occurs on UC.
Case 5: UC_SOC< Min value and Bat_SOC
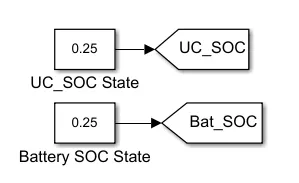
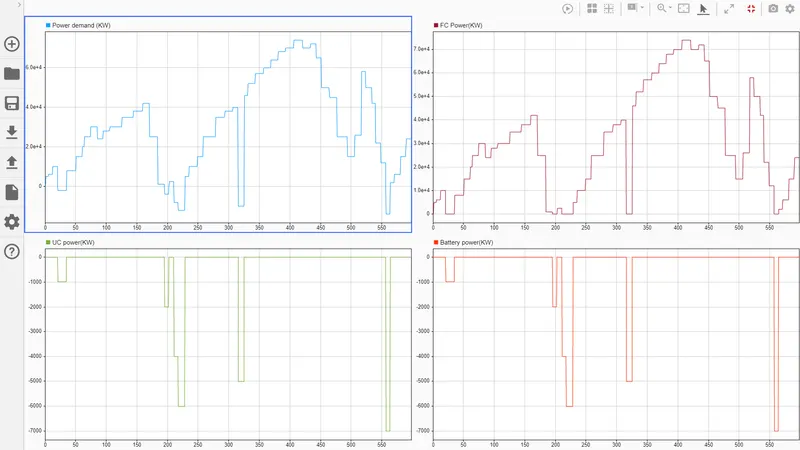
In this situation both UC and Battery power request are satified by Fuel cell alone as seen from plots.
The load is fully diverted to fuel cell alone due to this the efficiency of vehicle gets gradually decrease.
Both UC and Battery are fails to operate and gets charge equally as both having equal SOC of 25%.
Note: The Model file, .mat file, Flow chart and excel file are attached with this submission.
Submitted by,
Praveen Kumar L V,
Date: 11/09/2021.