Simulating Cyclone separator with Discrete Phase Modelling
AIMS AND OBJECTIVES
- To perform a steady-state analysis on cyclone separator and to compute the separation efficiency and pressure drop for various cases.
- To explain briefly the four empirical models used in calculating the separation efficiency.
- To perform the analysis for different cases by varying the values of particle velocity and diameter and compare the results.
Empirical models used to calculate the cyclone separator efficiency
- Iozia and Leith model
It is the modified Barth model and is based on force balance. It assumes that the particle in the medium is affected by centrifugal force and flow resistance.
- Li and Wang model
It consists of bounce or re-entrainment as well as turbulent diffusion of the particle at the wall of the cyclone separator.
It assumes: for uncollected particles, the radial velocity of the particle as well as its radial concentration profile are not constant. Also, the radius of the cyclone influences the tangential particle velocity.
- Koch and Licht model
It describes the motion of the particle at the entry and collection regions of the cyclone. In addition, it assumes, the tangential velocity of both the particle and continuum medium are equal. Also, the tangential velocity is related to the radius of the separator.
- Lapple model
It is based on force balance but flow resistance is not considered here. It assumes that the particle entering the cyclone inlet is evenly distributed across it and also the particle that travels from the inlet which is half a width to the wall is collected with 50% efficiency.
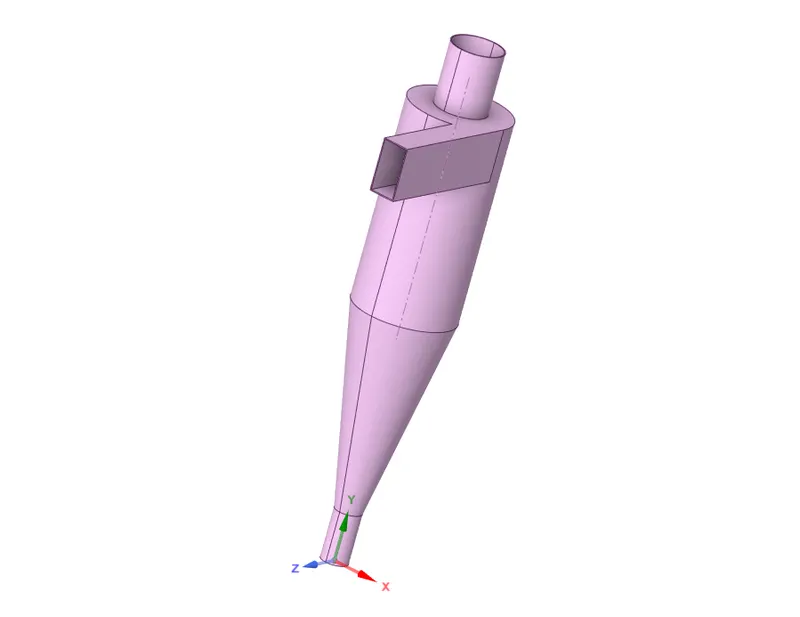
Geometry: Cyclone Separator model
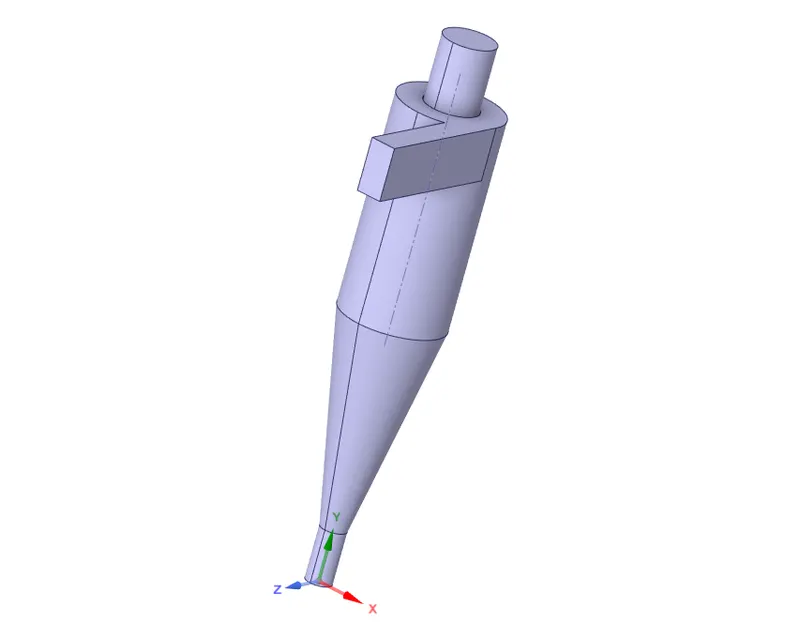
Fluid volume extracted:
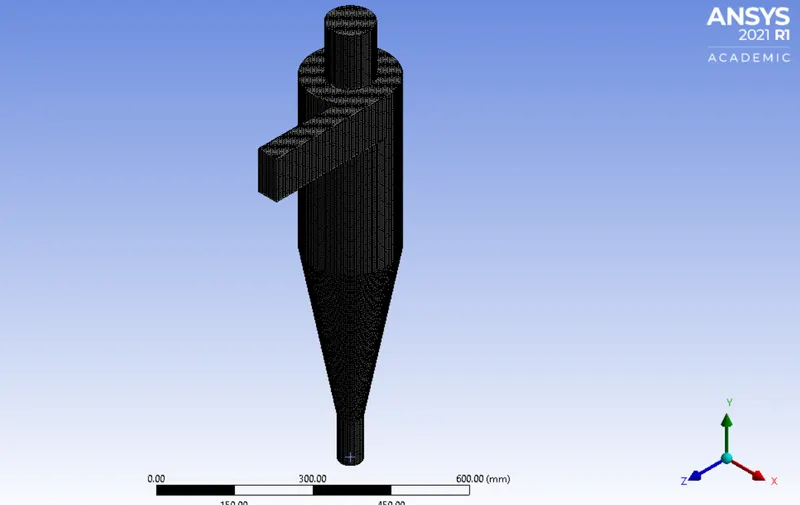
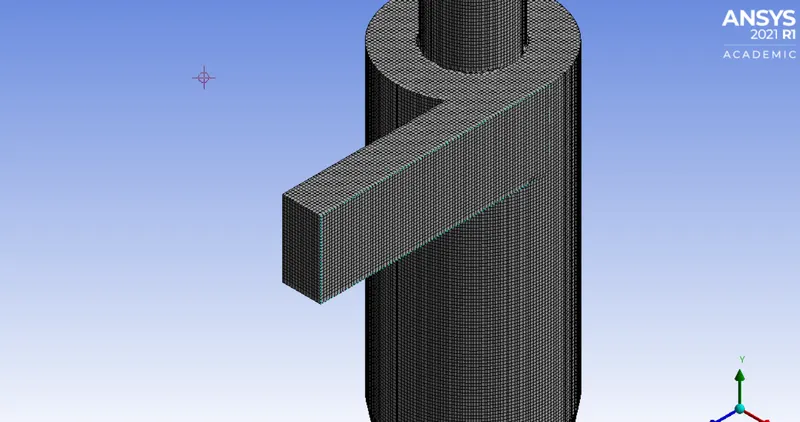
Meshing:
Element size = 10 mm
Element size of face sizing done at the inlet = 5 mm
Meshing method used = Cartesian
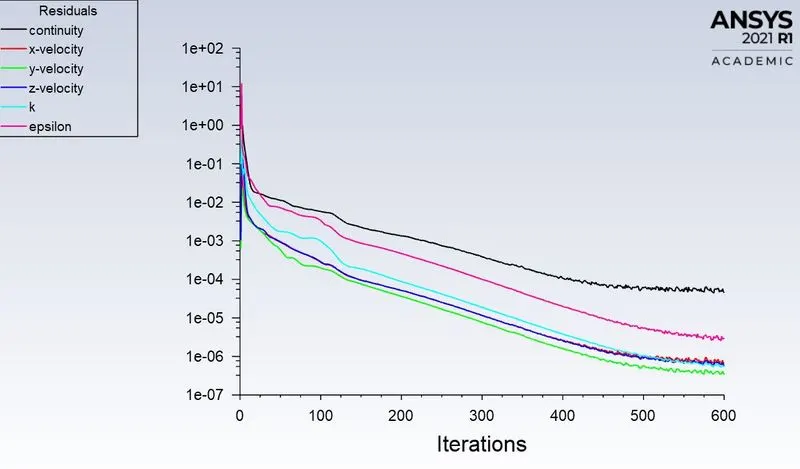
The steady-state solver is used to perform the analysis. Since the physics involves a lot of swirling motion of fluid, RNG k-epsilon viscous model is used with a standard wall function. The discrete phase model is enabled and desired values of diameter and velocity of particles are given.
Boundary conditions given: At inlet and wall = reflect
At the outlet (top)= escape
At the outlet (bottom)= trap
(I) Keeping both particle and flow velocity = 3 m/s constant in all cases
- Case 1: when particle diameter = `1 mum`
Convergence Plot:
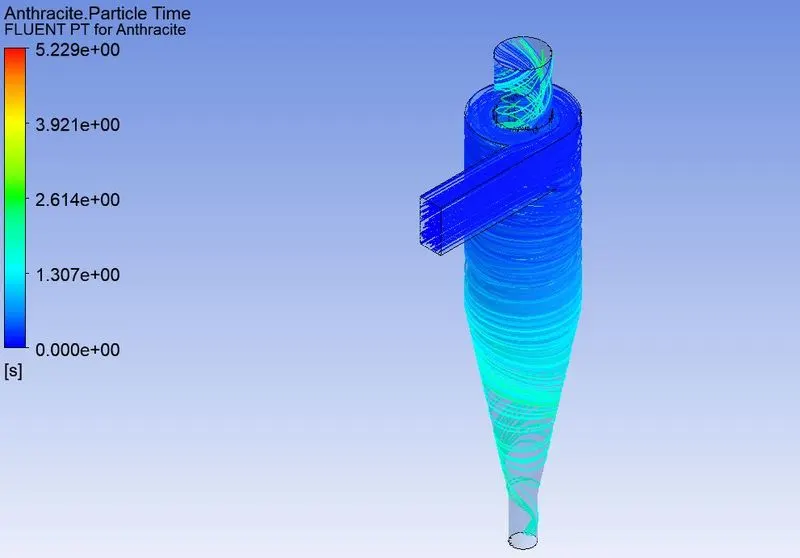
Particle time for Anthracite:
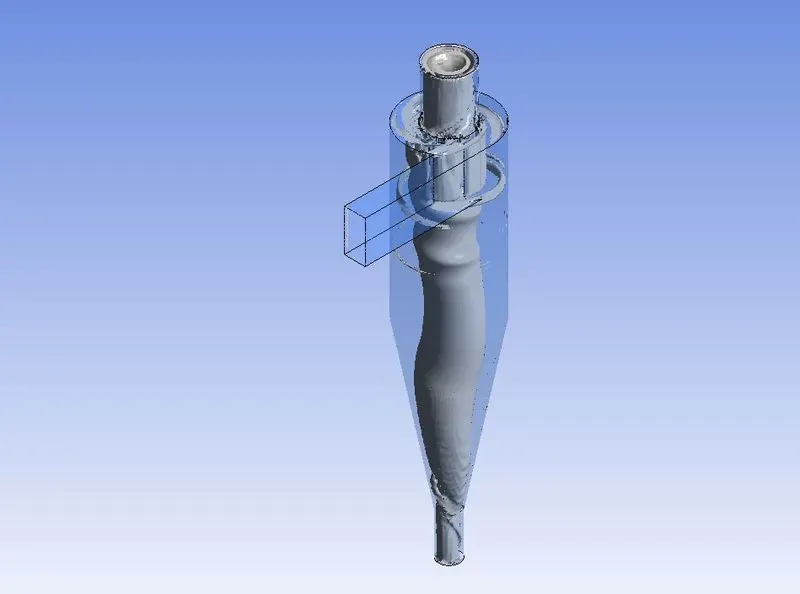
Vortex Core Region:
Animation
https://youtu.be/8NXTDATkjD8
- Case 2: when particle diameter = `3 mum`
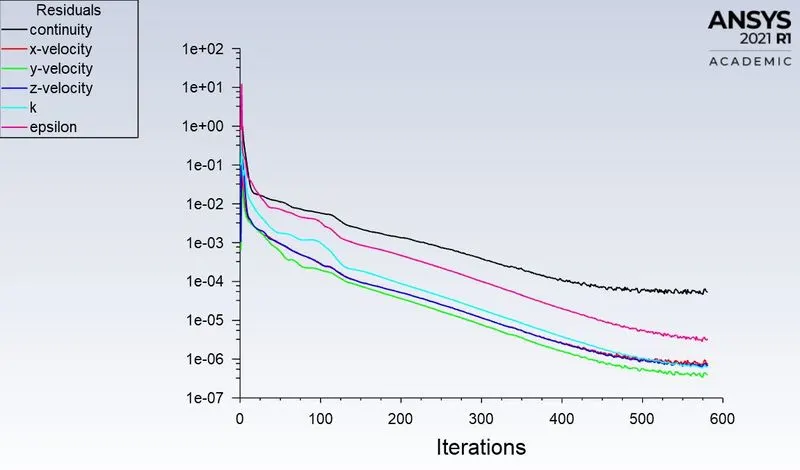
Convergence Plot:
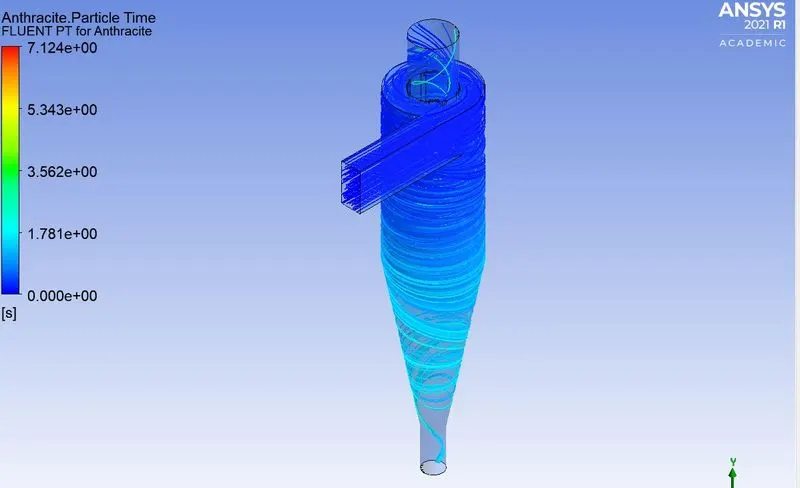
Particle time for Anthracite:
Animation:
- Case 3: when particle diameter = `5 mum`
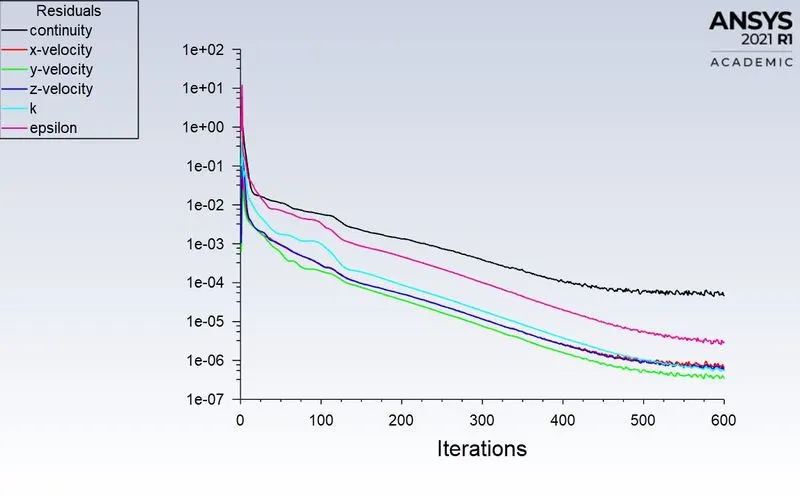
Convergence Plot:
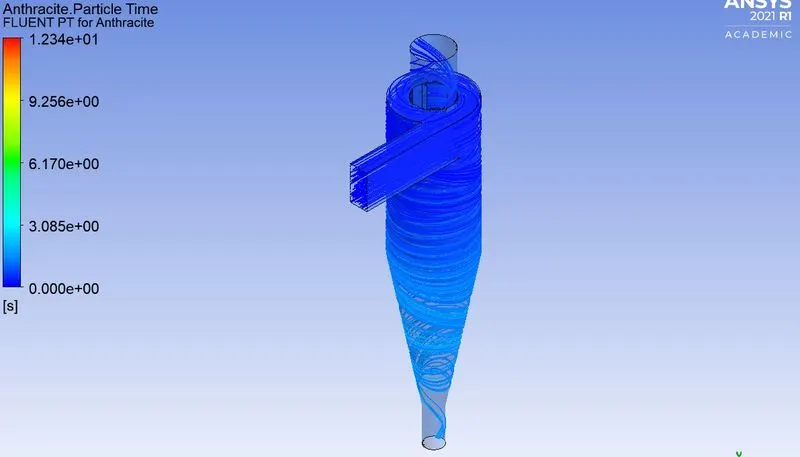
Particle time for Anthracite:
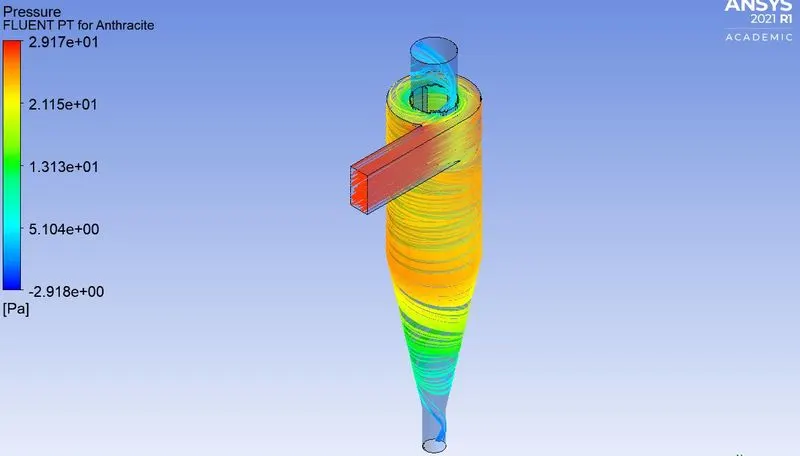
Pressure drop:
Animation:
(II) Keeping particle diameter = 5 micrometers constant in all cases
- Case 1: when flow and particle velocity = 1 m/s
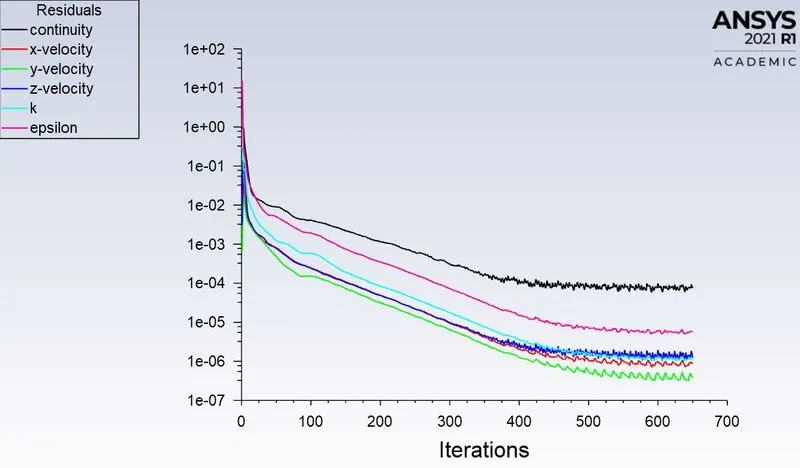
Convergence Plot:
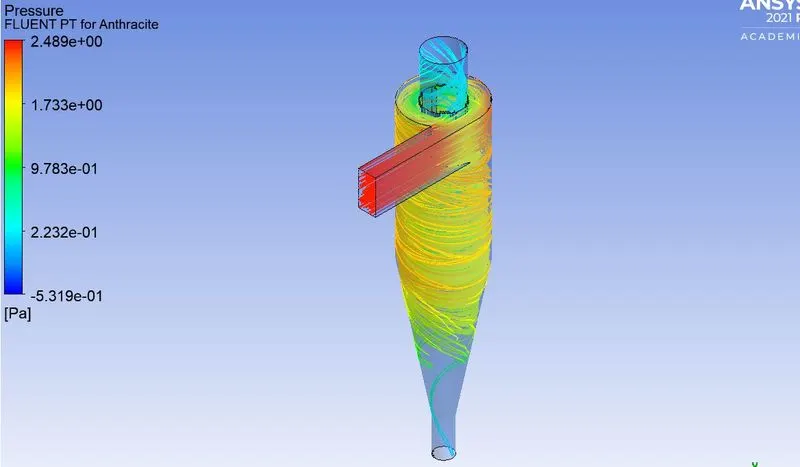
Pressure drop:
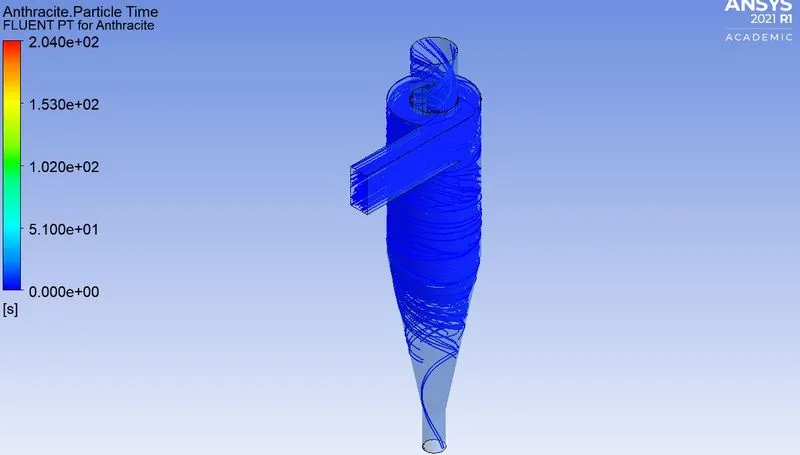
Particle time for Anthracite:
Animation:
https://youtu.be/AylhsVZhS-Y
- Case 2: when flow and particle velocity = 5 m/s
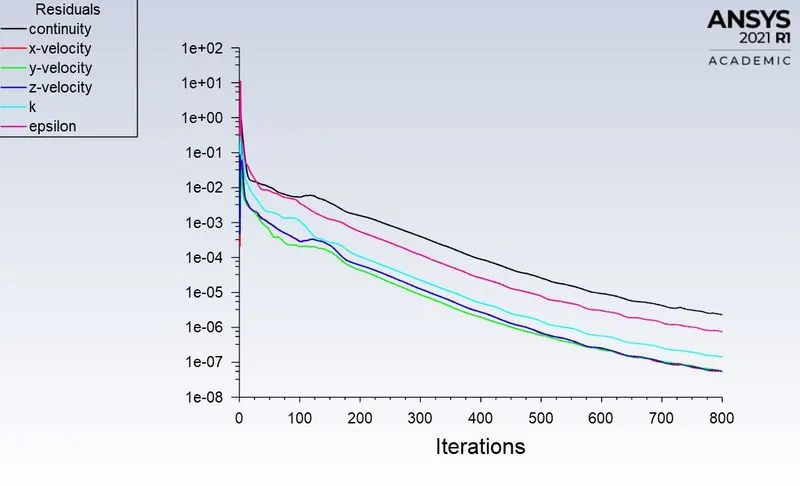
Convergence Plot:
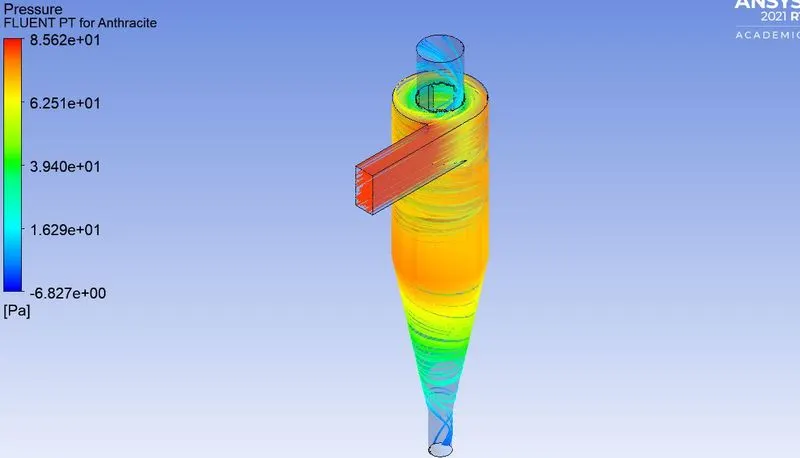
Pressure drop:
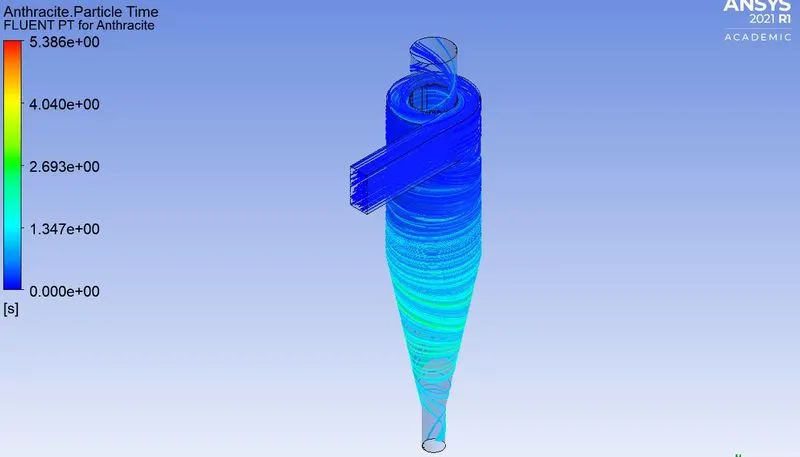
Particle time for Anthracite:
Animation:
The separation efficiency can be found out by taking the ratio of the total number of particles trapped to the total number of particles tracked.
- Keeping flow and particle velocities constant at 3 m/s:
|
Diameter of the particle (micrometers) |
Number of particles trapped | Number of particles tracked | Separation Efficiency (%) |
| 1 | 143 | 378 | 37 |
| 3 | 145 | 378 | 38.3 |
| 5 | 253 | 378 | 66.9 |
- Keeping the particle diameter constant at 5 micrometers and flow and particle velocity equal:
| Velocity of the flow and particle (m/s) | Number of particles trapped | Number of particles tracked | Separation Efficiency (%) |
Maximum Pressure (inlet) (Pascal) |
Minimum Pressure (outlet) (Pascal) |
Pressure drop (Pascal) |
| 1 | 8 | 378 | 2.1 | 2.48 | -0.53 | 3.01 |
| 3 | 253 | 378 | 66.9 | 29.17 | -2.98 | 32.15 |
| 5 | 227 | 378 | 60 | 85.6 | -6.8 | 92.4 |
Inference:
- It can be observed from the results that the separation efficiency significantly increases with the increase in particle diameter. Here, the separation efficiency is computed to be 66.9% when the particle diameter is 5 micrometers and the same is only 37% when the diameter of the particle is just 1 micrometer.
- The characteristics of the efficiency with respect to the increase in velocity are not found to be linear. Although the efficiency is minimum at 1 m/s, the same is not maximum for 5 m/s. But instead, for 3 m/s, the efficiency is calculated to be 66.9%, which is the maximum in this case.
- The pressure drop is also, found to be maximum when velocity is increased. The drop in pressure is calculated to be 85.6 Pa when 5 m/s.
- Hence, an increase in velocity is observed to be decreasing the pressure drop exponentially which in turn affects the efficiency to reduce slightly. Therefore, an optimum velocity has to be chosen to maintain a decent separation efficiency. Also, to increase the efficiency to separate small diameter particles, modifications in the dimensions of the cyclone have to be made.