Week 8 - Simulating Cyclone separator with Discrete Phase Modelling
REPORT ON CYCLONE SEPERATOR
AIM
To perform analysis on cyclone separator and calculate the separation efficiency and pressure drop.
OBJECTIVE
- To write a few words about any four empirical models used to calculate the cyclone separator efficiency.
- To perform an analysis on a given cyclone separator model by varying the particle diameter from 1 μm to 5 μm and calculate the separation efficiency in each case. Discuss the results. [Use both the velocity's as 3m/sec.]
- To perform an analysis on a given cyclone separator model by varying the particle velocity from 1 m/sec to 5 m/sec and calculate the separation efficiency and pressure drop in each case. Discuss the results. [Use particle diameter size as 5 μm for all cases & keep flow velocity same as particle velocity]
THEORY
Cyclone seperator : Cyclone seperator are devices that employ a centrifugal force generated by a spinning gas stream to separate particles from the carrier gas. Their simple design, low capital cost and nearly maintenance-free operation make them ideal for use as precleaners for more expensive final control devices such as bag houses or electrostatic precipitators. Cyclones are particularly well suited for high temperature and pressure conditions because of their rugged design and flexible component materials.
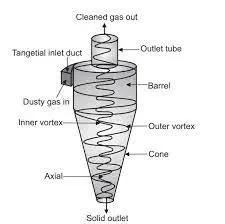
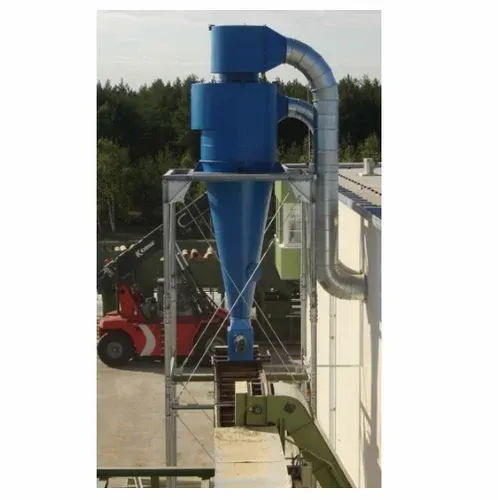
The cyclone separator consists of 1 inlet and two outlets. At inlet, dusty gas is inputted at a high tangential velocity and due to swirling motion, outer vortex generation takes place. Due to inertial effect, the particulate matter don't follow the exact vortex motion and momentum losses of particulates occurs due to Collison with the walls of cyclone separator. The heavy particulate matter gets collected at the bottom of the cyclone separator. The axial velocity of fluid in the conical section, gets reversed and the fluid forms inner vortex and cleaned gas exits from the top outlet.
Applications includes the removal of coal dust in a power plant and the use as a spray dryer or gasification reactor.
An accurate prediction of cyclone efficiency is very important because an inaccuracy in the efficiency prediction may result in an inefficient design of the cyclone separator. CFD has a great potential to predict the flow field characteristics and particle trajectories inside the cyclone as well as the pressure drop. The complicated swirling turbulent flow in a cyclone places great demands on the numerical techniques and the turbulence models employed in the CFD codes when modelling the cyclone pressure drop.
The cyclone separation efficiency is given by the ratio of the total number of particles trapped to the total number of particles tracked
Factors affecting cyclone separation efficiency -
- Particle density - As the particulate density increases, the separation efficiency increases.
- Particle size - As the particulate size increases, the separation efficiency increases.
- Flow rate - As the flow rate increases, the separation efficiency increases.
- Cone and body length - The separation efficiency increases with increase in the body length and decrease in cone, body diameter.
- Pressure drop - The efficiency of collector depends of pressure drop, as it indirectly estimated the amount of energy required to move the gas through the separator. The pressure drop depends on various parameters such as inlet velocity, cyclone diameter, roughness of inner surface wall of cyclone separator, viscosity of fluid etc.
- `Pressure drop = P_(In) - P_(Out)`
There are four different empirical models for cyclone efficiency, namely Lapple, Koch and Licht , Li and Wang and Iozia and Leith.
1) Iozia and Leith model - This model was developed based on force balance. In this model, since the particle undergoes vortex flow, two main forces are considered - i.e, centrifugal force and flow resistance.
The collection efficiency(ηi) of particle diameter(dpi) is given as -
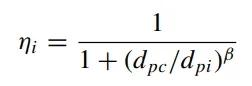 , where

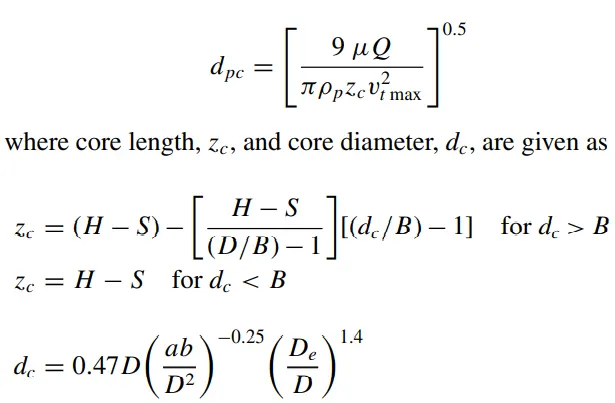
2) Li and Wang model - This model includes particle bounce or re-entrainment and turbulent diffusion at the cyclone wall. In this model, 2D analytical expression of particle distribution in the cyclone is given as -
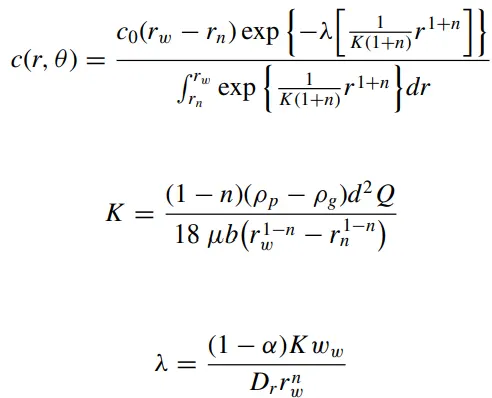
The resultant expression of the collection efficiency for particle of any size is given as -
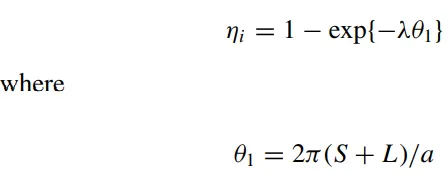
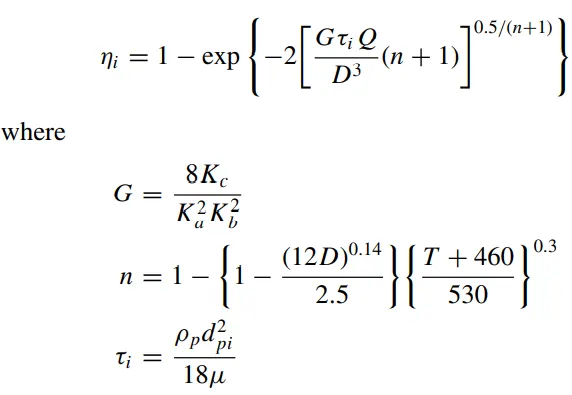
3) Koch and Licht model - This model includes the inherently turbulent nature of cyclones and the distribution of gas residence times within the cyclone.
A force balance and an equation on the particles collection yields the grade efficiency (ηi) as -
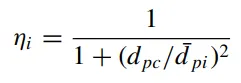
4) Lapple model - This model was developed based on force balance without considering the flow resistance. Lapple assumed that a particle entering the cyclone is evenly distributed across the inlet opening.
The efficiency of collection of any size of particle is given by -
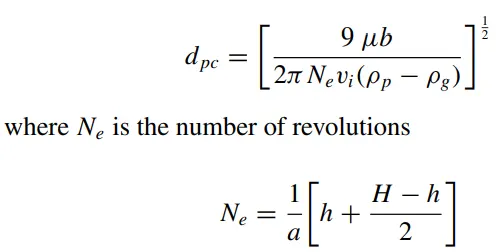
The Lapple model is unable to fit well with any experimental data. This is possibly because the Lapple model simply assumes that particles that enter the cyclone are evenly distributed across the inlet opening and a particle that travels from the inlet half width to the cyclone wall is collected with 50% efficiency. Unjustified assumptions of complete and uniform mixing of uncollected dust at any height in the cyclones may also contribute to the discrepancy between the experimental data and the Koch and Licht predictions
The Li and Wang model and CFD code both predict very well the cyclone efficiency for any operational conditions.
PROCEDURE
First step is the setting up of geometry where we import the geometry into the space claim
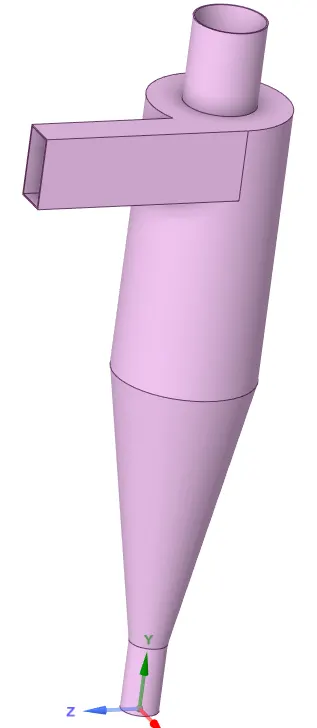
Next, extract the fluid volume inside the cyclone separator by Prepare - Volume extract as shown in the fig and suppress the solid geometry.
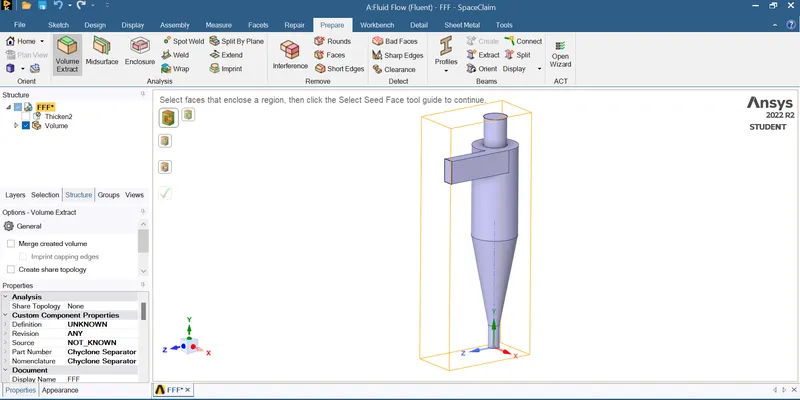
Then we give the name for the inlet and outlets using the name selections just before the meshing.
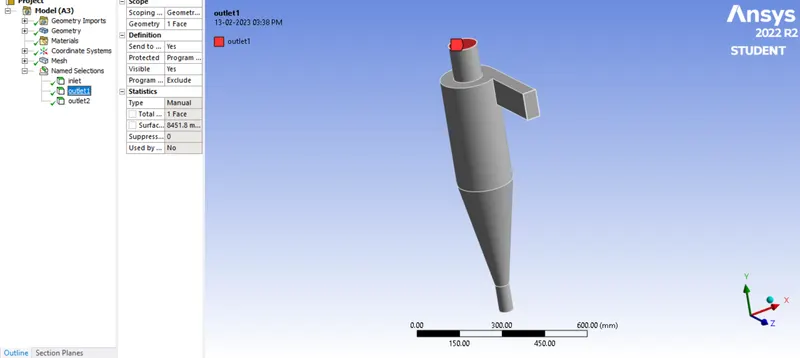
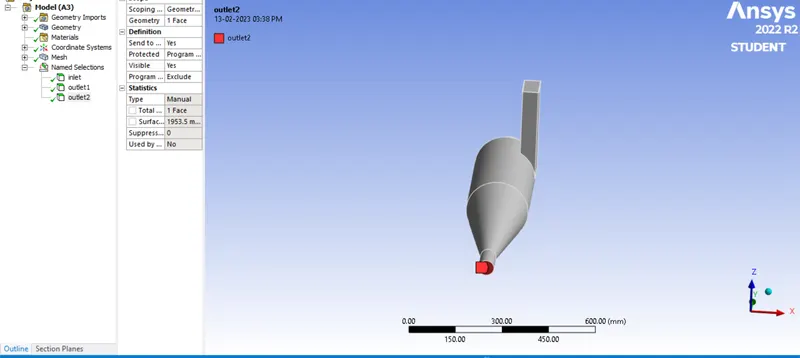
The next step is meshing where we mesh with element size of 10 mm.
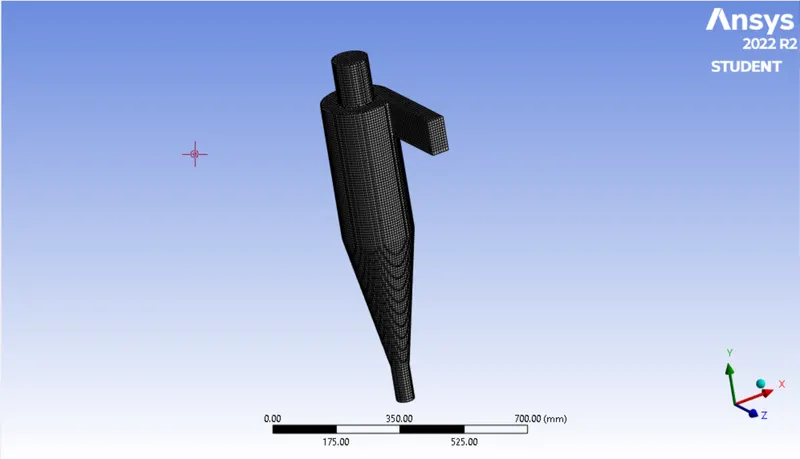
Then we start the physics set up to run the simulation with the given boundary conditions and varying the particle diameter from 1 μm to 5 μm and calculate the separation efficiency in each case.
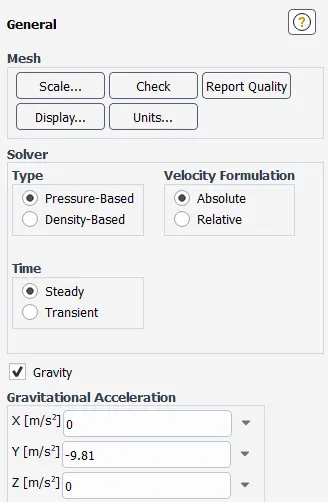
Here we use the Pressure based Solver type since it is ideally suited for incompressible to mildly compressible flows and also use Steady state condition.
Since, in cyclone separator, gravity effects also considered, thus we include gravity in the problem.
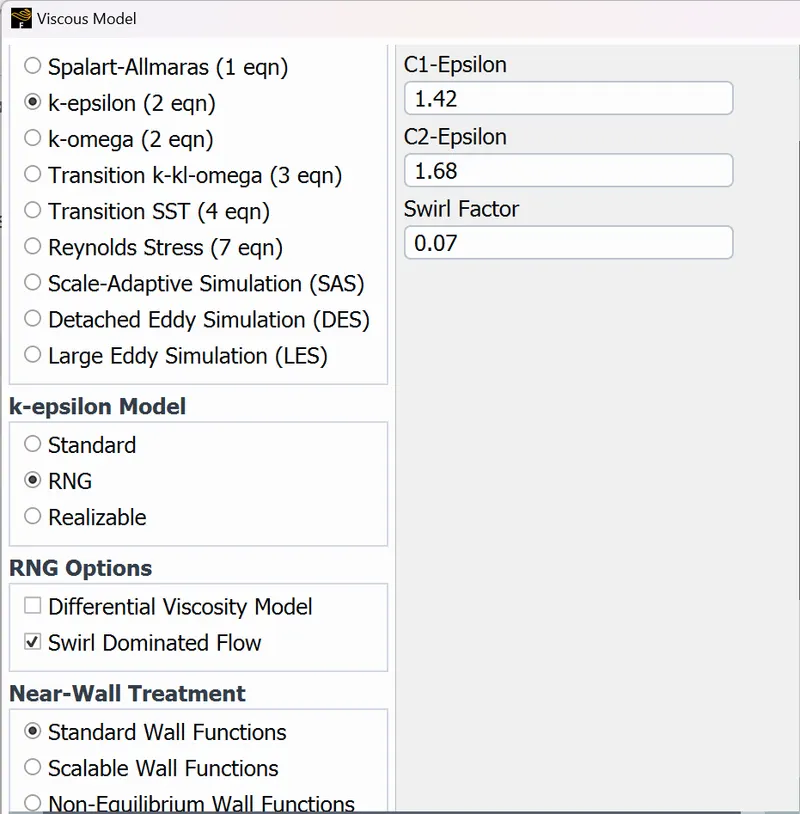
Since, in cyclone separator, turbulence dissipation effects plays an important role, RNG K - epsilon turbulence model is used. RNG is a slight modification to standard K - epsilon, which increases accuracy of swirling flows.
Here we perform discrete phase modeling with coupled analysis, since there is discrete phase and continuous phase.
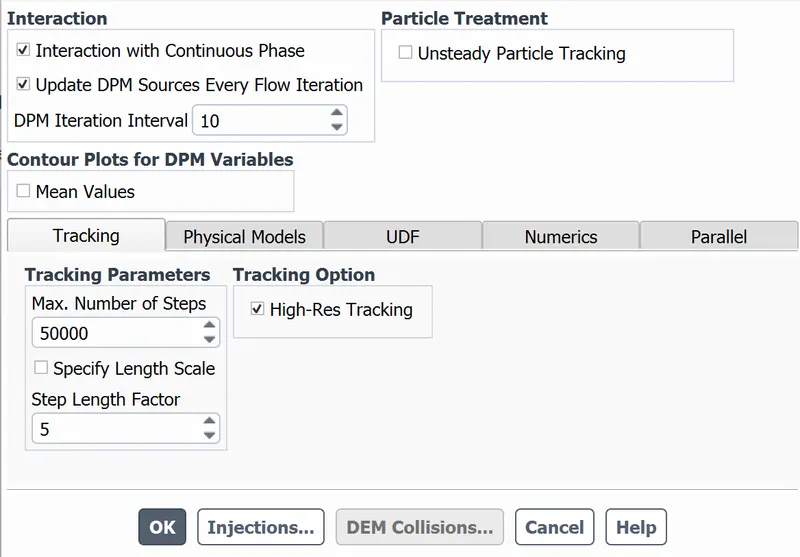
Here we use coupled analysis as there is interaction between discrete phase and continuous phase and there is also the discrete phase influences
When coming to the tracking parameters we have a value of 50000 given as the maximum number of time steps which is the limit on the number of integration time steps that eleiminates the possibility of a particle being trapped in a recirculating region of the continuous flow field and being tracked infinitely.
Then we give the step length factor which is used to control the time step size which is used to integrate the equations of motion for a particle.
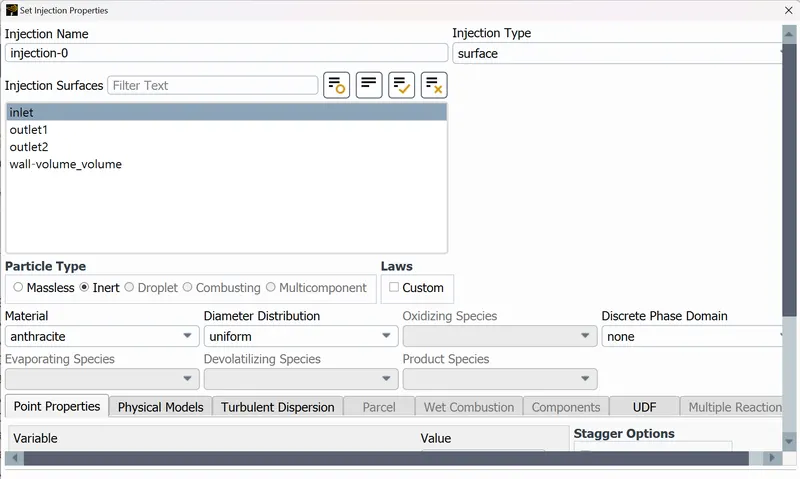
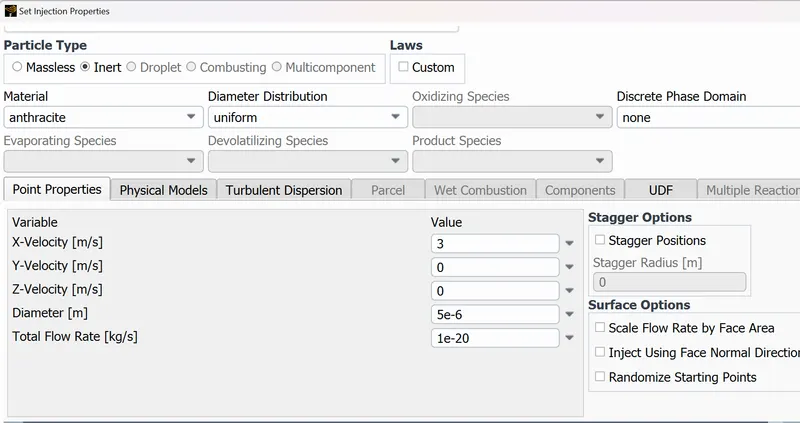
In the injection particulate, Anthracite material is considered which is inert type as shown in the fig. The injection type is surface injection with velocity of 3m/s and particulate diameter of 5 microns.
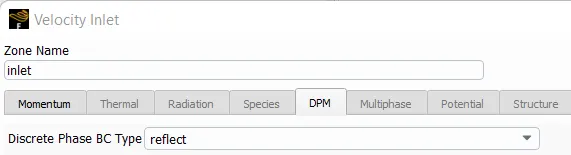
Now we give the Boundary conditions for inlet, outlets and the wall where the Inlet velocity magnitude = 3m/s and discrete phase BC as reflect type
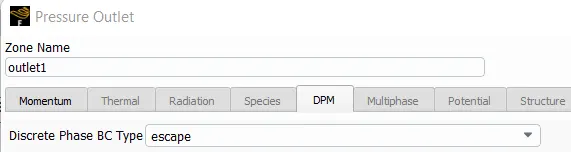
Outlet1 Pressure = 0 gauge and discrete phase BC as escape type
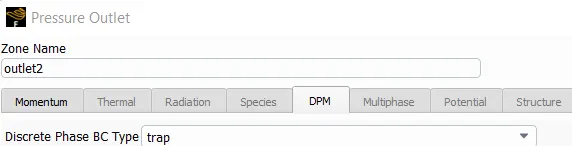
Outlet2 Pressure, magnitude = zero gauge and discrete phase BC as trap type
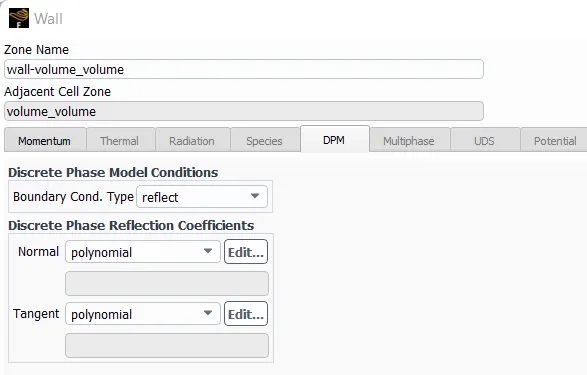
Wall type - no slip conditions, magnitude = zero gauge and discrete phase BC as reflect type
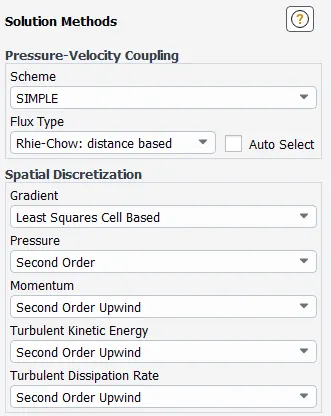
Then we use the 2nd order upwind scheme in the solution methods along with the SIMPLE scheme which produces more accurate spatial discretization schemes.
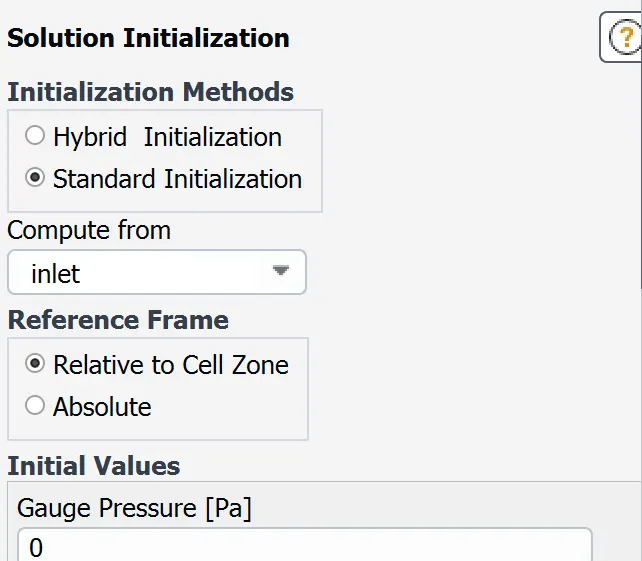
Now we initialize the simulation by computing from the inlet.
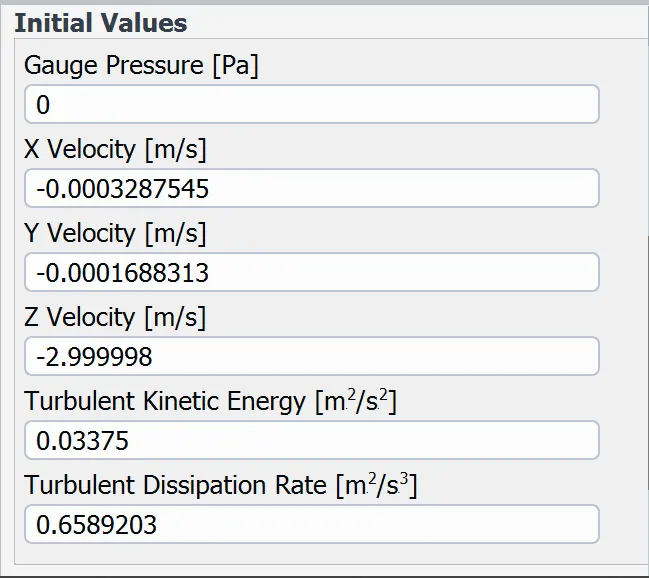
Then we run the simulations for 1000 iterations.
RESULTS
CASE 1 : Simulation with varying particle size and constant veocity of 3 m/s for particle and flow
1. Particle diameter = 1 microns
SCALED RESIDUALS
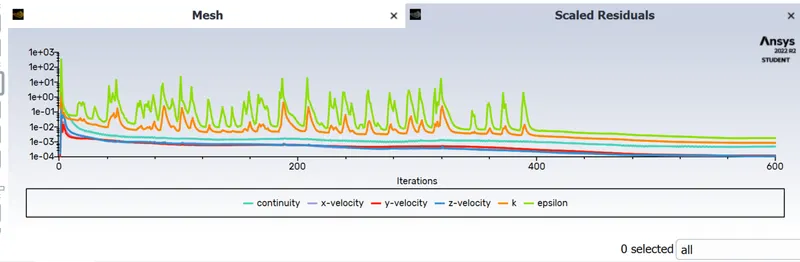
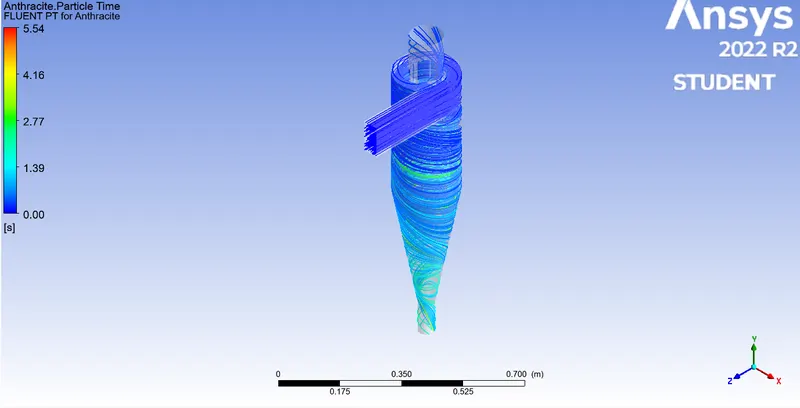
Anthracite Particle Time Contour
Pressure Contour
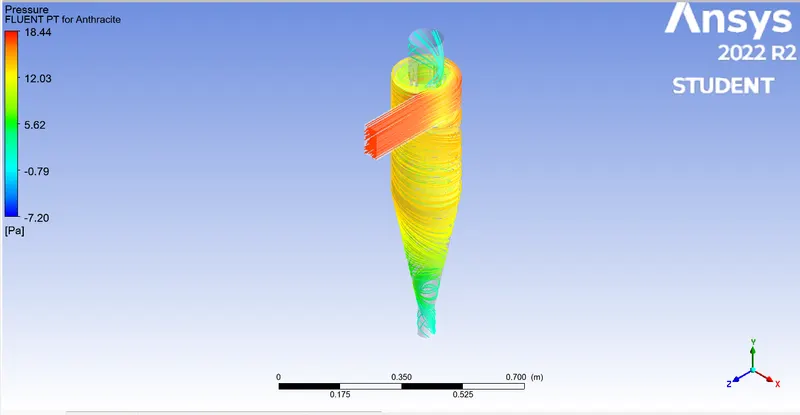
Pressure difference = 18.44+7.20 = 25.64 Pa
Seperation Efficiencey = (Trapped/Tracked)*100 = (282/378)*100 = 74.60%
Animation Link : https://drive.google.com/file/d/1xf6MvLGyzAxmeYrShniPqkBzF3WD4J5R/view?usp=share_link
2. Particle diameter = 2 microns
SCALED RESIDUALS
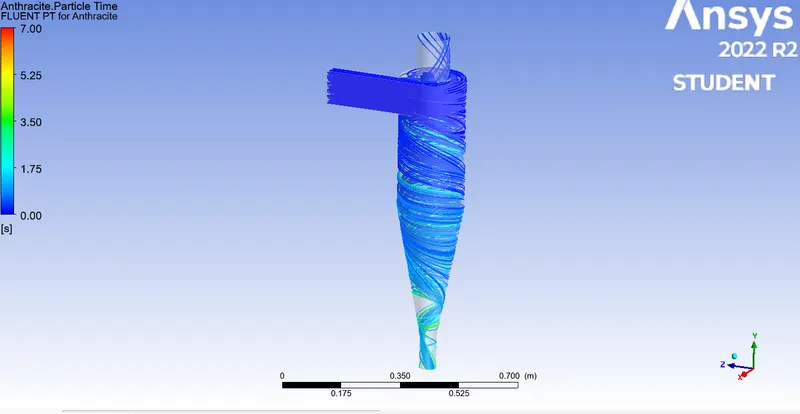
Anthracite Particle Time Contour
Pressure Contour
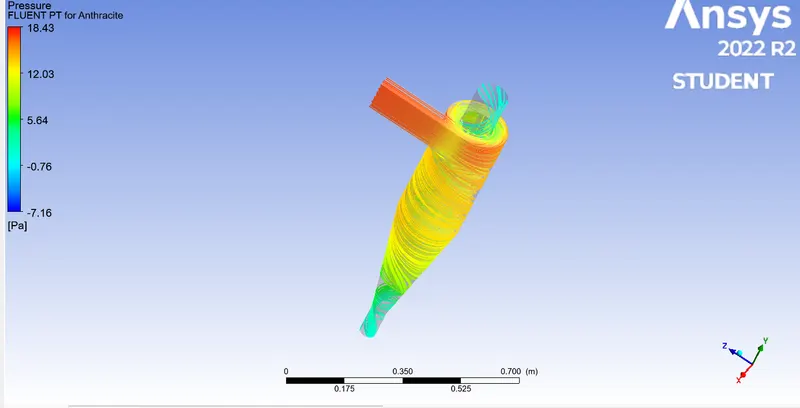
Pressure difference = 18.43+7.16 = 25.59 Pa
Seperation Efficiencey = (Trapped/Tracked)*100 = (290/378)*100 = 76.71%
Animation Link : https://drive.google.com/file/d/1xf6MvLGyzAxmeYrShniPqkBzF3WD4J5R/view?usp=share_link
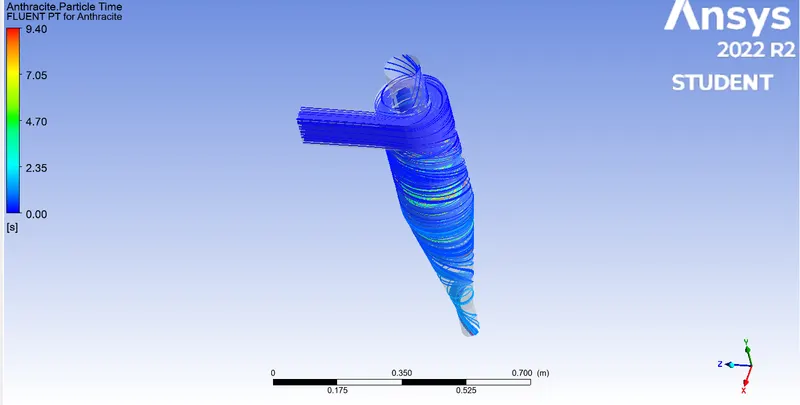
3. Particle diameter = 3 microns
SCALED RESIDUALS
Anthracite Particle Time Contour
Pressure Contour
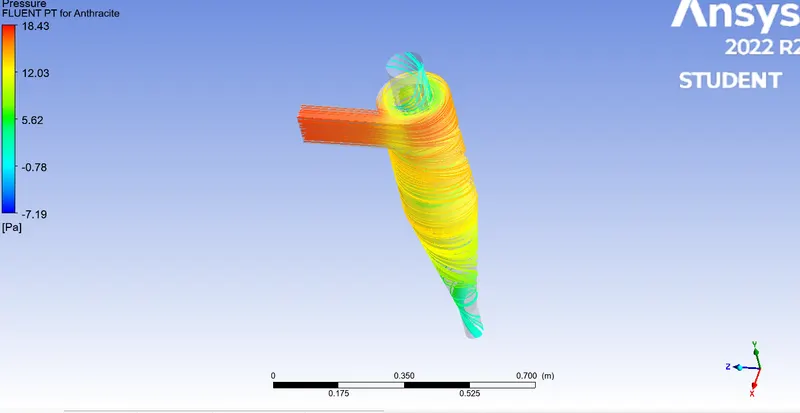
Pressure difference = 18.43+7.19 = 25.62 Pa
Seperation Efficiencey = (Trapped/Tracked)*100 = (305/378)*100 = 80.68%
Animation Link : https://drive.google.com/file/d/1Z_-0-bEGKZoOrJE6ORmecDI0weVbrg_k/view?usp=share_link
4. Particle diameter = 4 microns
SCALED RESIDUALS
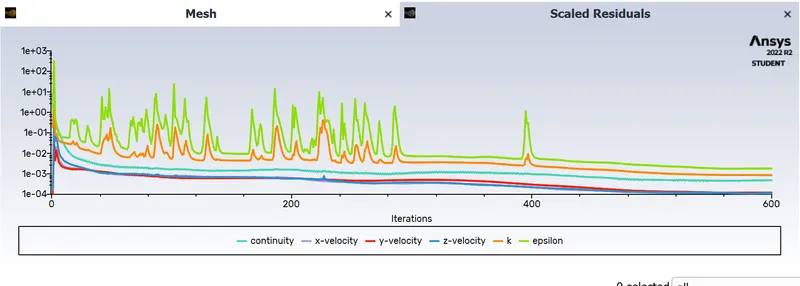
Anthracite Particle Time Contour
Pressure Contour
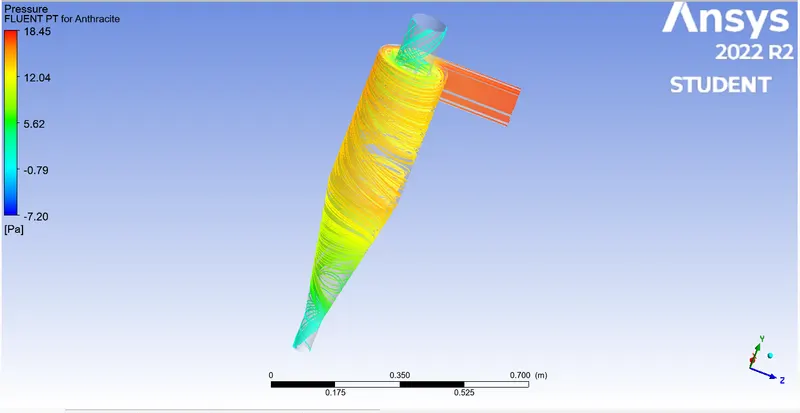
Pressure difference = 18.45+7.20 = 25.65 Pa
Seperation Efficiencey = (Trapped/Tracked)*100 = (321/378)*100 = 84.92%
Animation Link : https://drive.google.com/file/d/18MBCoGNg-9eAZ8tkxbfYWvoMwHOtMqn2/view?usp=share_link
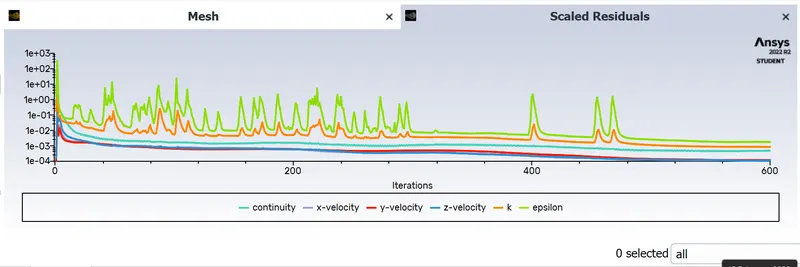
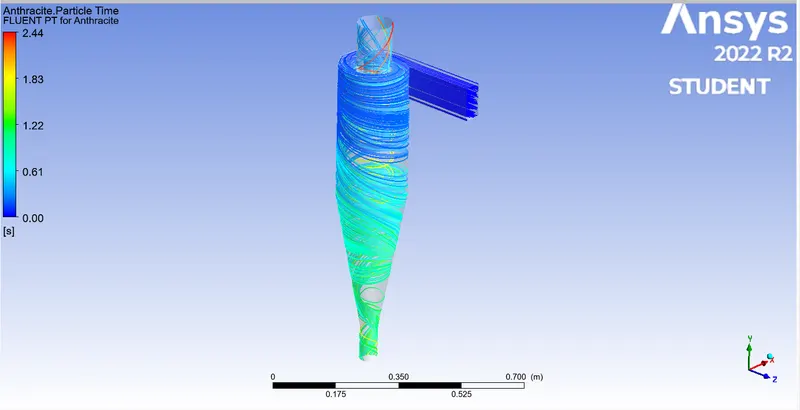
5. Particle diameter = 5 microns
SCALED RESIDUALS
Anthracite Particle Time Contour
Pressure Contour
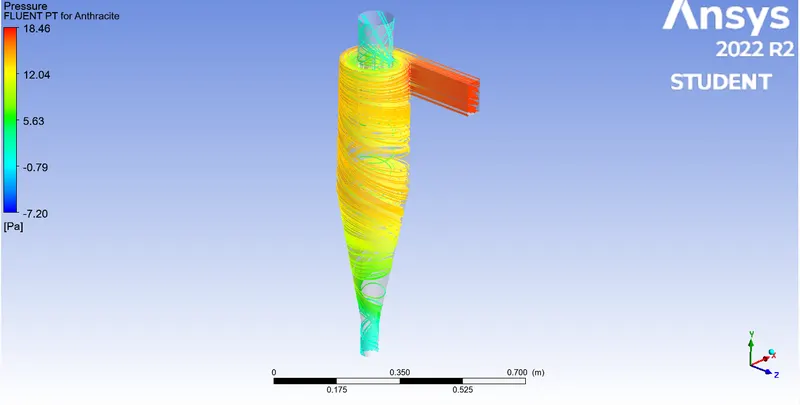
Pressure difference = 18.46+7.20 = 25.66 Pa
Seperation Efficiencey = (Trapped/Tracked)*100 = (332/378)*100 = 87.83%
Animation Link : https://drive.google.com/file/d/1v15LDZV8W6UTftM-Sjolz1vWhBBSTcbC/view?usp=share_link
The table given below shows the effect of variations of particle size on the separation efficiency and pressure drop.
|
Sl no. |
Size of Particle (m) |
Velocity of Particle (m/s) |
Particle tracked |
Particle trapped |
Particle escaped |
Particle Incomplete |
Separation efficiency (%) |
Pressure drop (Pa) |
|
1 |
1e-6 |
3 |
378 |
282 |
88 |
8 |
74.60 |
25.64 |
|
2 |
2e-6 |
3 |
378 |
290 |
88 |
0 |
76.61 |
25.59 |
|
3 |
3e-6 |
3 |
378 |
305 | 66 | 7 | 80.68 | 25.62 |
|
4 |
4e-6 |
3 |
378 |
321 | 57 | 0 | 84.92 | 25.65 |
|
5 |
5e-6 |
3 |
378 |
332 |
40 |
6 |
87.83 |
25.66 |
CASE 2 : Constant particle diameter with varying particle velocity from 1 to 5 m/s.
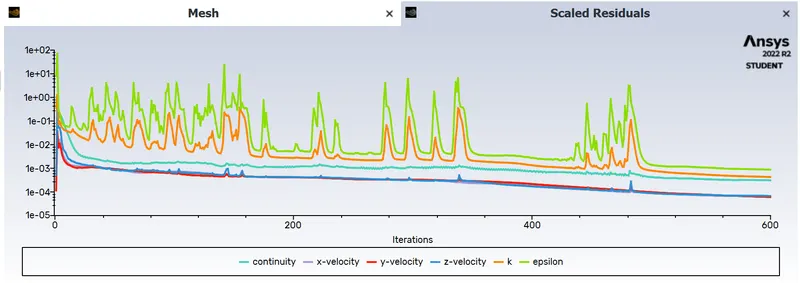
1. At velocity = 1m/s and diameter = 5 micrometer
SCALED RESIDUALS
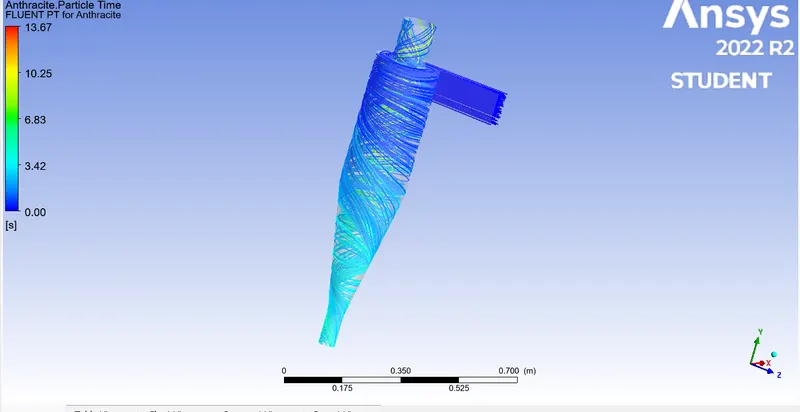
Anthracite Particle Time Contour
Pressure Contour
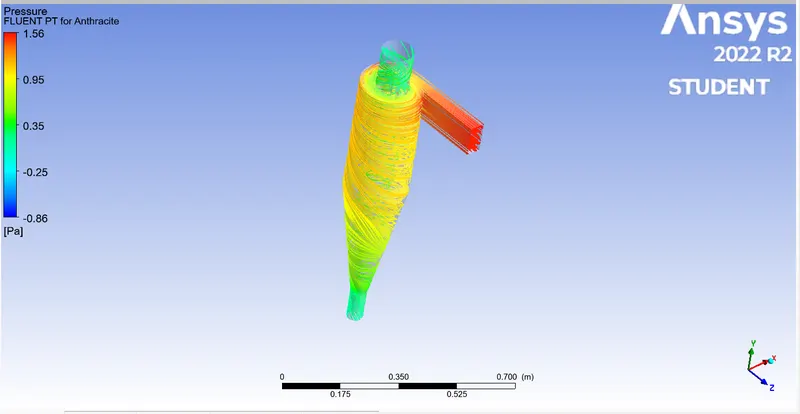
Pressure difference = 1.56+0.86= 2.32 Pa
Seperation Efficiencey = (Trapped/Tracked)*100 = (293/378)*100 = 77.51%
Animation Link : https://drive.google.com/file/d/1DCQsfIuA42F6uv-u4WPtCE-k-MWLzx7N/view?usp=share_link
2. At velocity = 2 m/s and diameter of particle = 5 micrometer
SCALED RESIDUALS
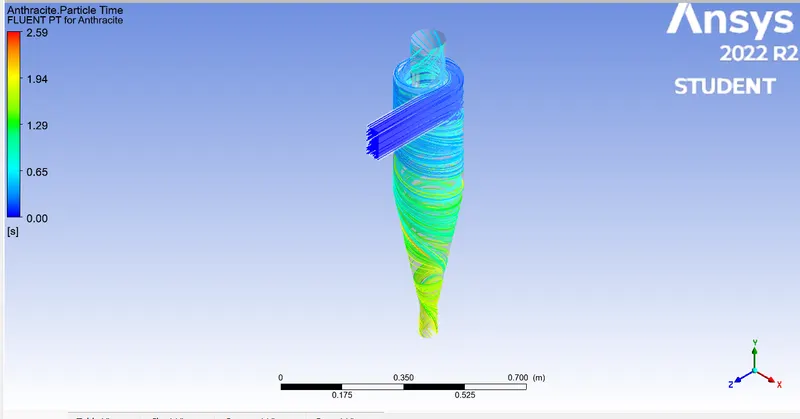
Anthracite Particle Time Contour
Pressure Contour
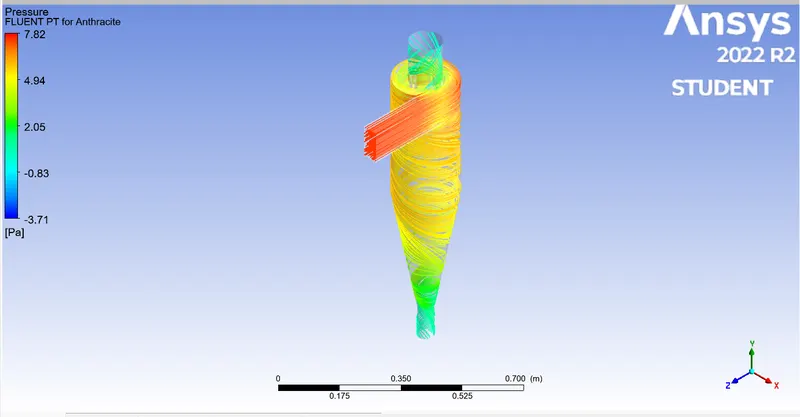
Pressure difference = 7.82+3.71= 11.53 Pa
Seperation Efficiencey = (Trapped/Tracked)*100 = (300/378)*100 = 79.36%
3. At velocity = 3 m/s and diameter of particle = 5 micrometer
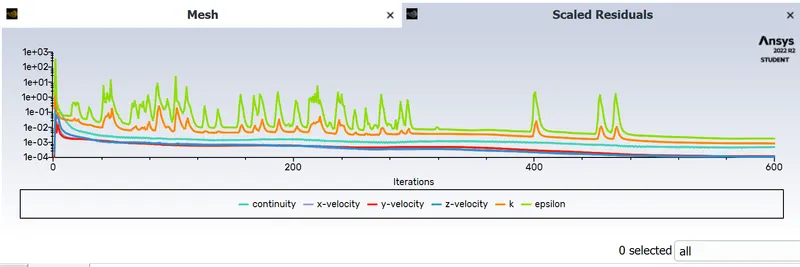
SCALED RESIDUALS
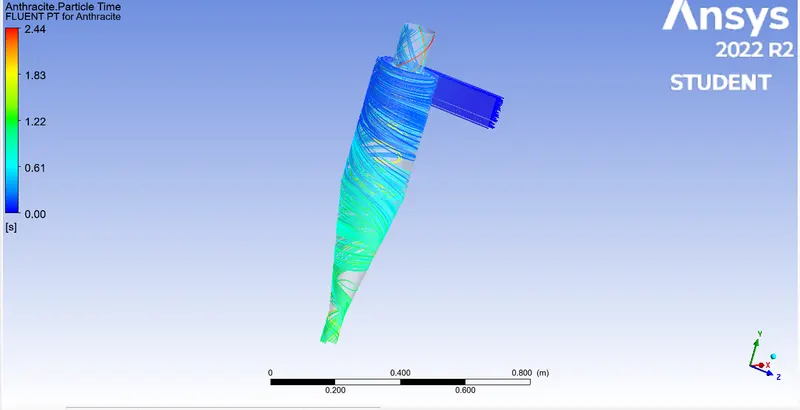
Anthracite Particle Time Contour
Pressure Contour
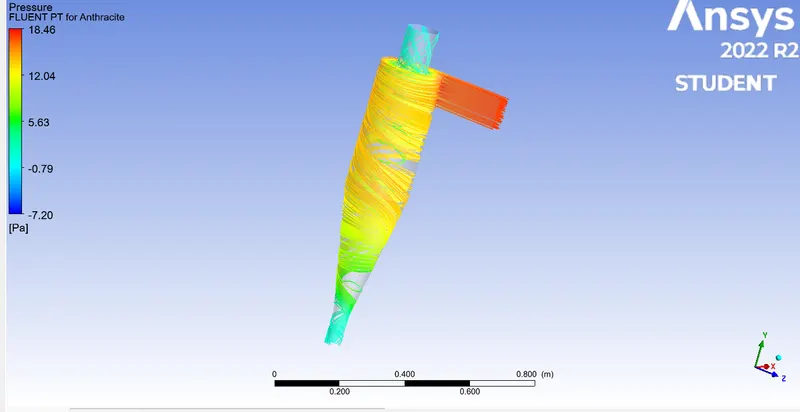
Pressure difference = 18.46+7.20 = 25.66 Pa
Seperation Efficiencey = (Trapped/Tracked)*100 = (310/378)*100 = 82.01%
Animation Link : https://drive.google.com/file/d/1u_D6lSOvjgkkmqbQA3LAm-CTr9fj2SOl/view?usp=share_link
4. At velocity = 4 m/s and diameter of particle = 5 micrometer
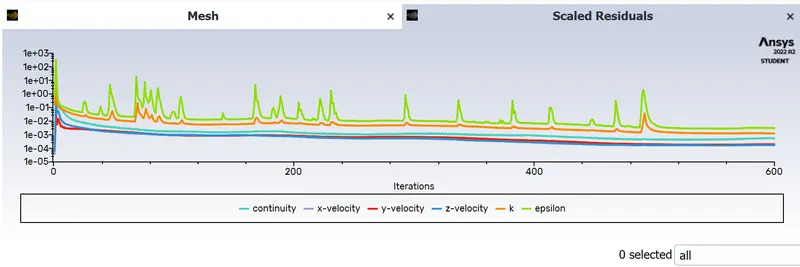
SCALED RESIDUALS
Anthracite Particle Time Contour
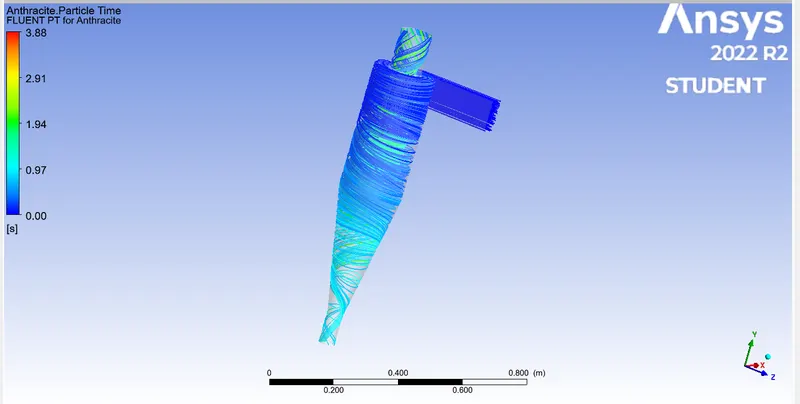
Pressure Contour
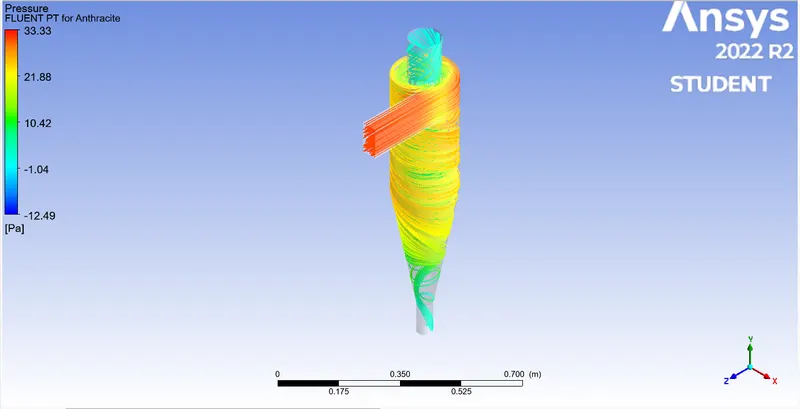
Pressure difference = 33.33+12.49 = 45.82 Pa
Seperation Efficiencey = (Trapped/Tracked)*100 = (321/378)*100 = 84.91%
Animation Link : https://drive.google.com/file/d/1raLtpRNZ3sfKdJdKBxq-_yqt53ws8Lja/view?usp=share_link
5. At velocity = 5 m/s and diameter of particle = 5 micrometer
SCALED RESIDUALS
Anthracite Particle Time Contour
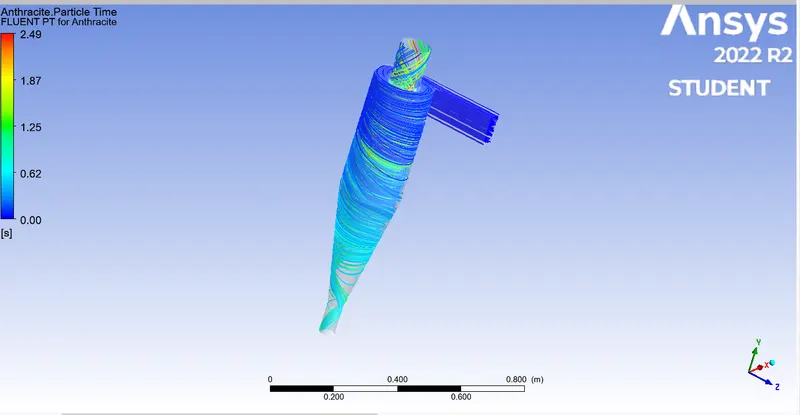
Pressure Contour
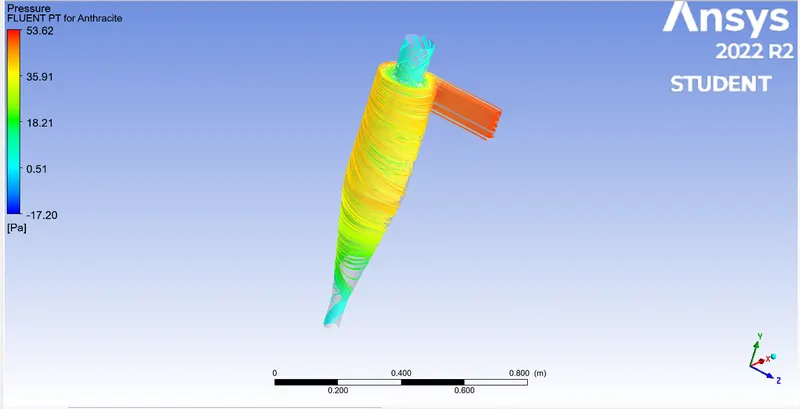
Pressure difference = 53.62+17.20 = 70.82 Pa
Seperation Efficiencey = (Trapped/Tracked)*100 = (342/378)*100 = 89.84%
Animation Link : https://drive.google.com/file/d/1dd0SttExjuuojjANLytUCryWs1pGCprE/view?usp=share_link
The table given below shows the effect of variations of particle size on the separation efficiency and pressure drop.
|
Sl no. |
Size of Particle (m) |
Velocity of Particle (m/s) |
Particle tracked |
Particle trapped |
Particle escaped |
Particle Incomplete |
Separation efficiency (%) |
Pressure drop (Pa) |
|
1 |
5e-6 |
1 |
378 |
293 |
80 |
5 |
77.51 |
2.32 |
|
2 |
5e-6 |
2 |
378 |
300 |
78 |
0 |
79.36 |
11.53 |
|
3 |
5e-6 |
3 |
378 |
310 |
66 |
2 |
82.01 |
25.66 |
|
4 |
5e-6 |
4 |
378 |
321 |
50 |
7 |
84.91 |
45.82 |
|
5 |
5e-6 |
5 |
378 |
342 |
36 |
0 |
89.94 |
70.82 |
CONCLUSION
Based on the results obtained in the previous section, we can make the following conclusion
- The efficiency of cyclone separators of the same size and configuration decreases as the particle size decreases.
- The efficiency of the cyclone separator is directly proportional to the flow velocity of the particulate. i.e. high-velocity yields higher efficiency
- Pressure drop only depends on the velocity of the particles. As the velocity increases the pressure difference between inlet and outlet pressure increases. In other words Pressure drop is dependant on velocity. For constant velocity with varying diameter sizes, the pressure drop remains almost constant.
- As the size of the particle decreases and the velocity of the flow decreases, the time taken for convergence also increases. So to overcome this, the maximum no of steps in tracking parameters need to be increased.