Week 8 - Simulating Cyclone separator with Discrete Phase Modelling
CYCLONE SEPARATOR SIMULATION USING DPM
1. OBJECTIVE
- To brief about the empirical models used to calculate cyclone separator
- To perform the simulation and calculate the efficiency of cyclone separator by varying particle size from 1 - 5 μm for inlet velocity of 3 m/s.
- To perform the simulation and calculate the efficiency of cyclone separator by varying velocity from 1 - 5 m/s for the particle size of 5 μm.
2. 3D MODEL
Fluid volume of cyclone separator consists of a single inlet along z-axis and two outlets at opposite directions along the y-axis.
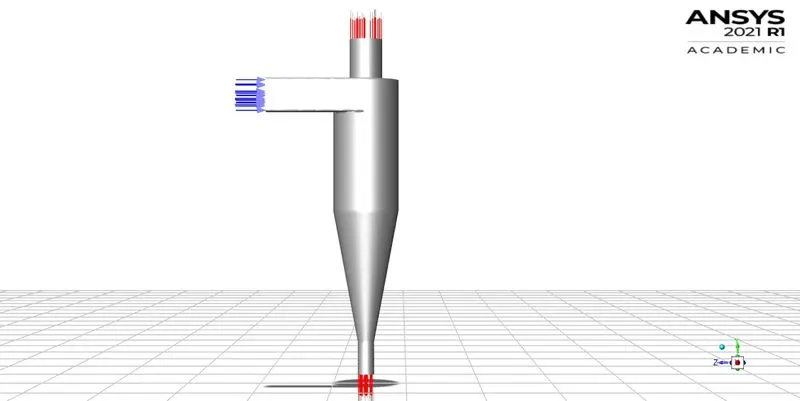
Fig.2.1. Cyclone Separator Fluid Volume
3. COMPUTATIONAL MODEL
Cyclone Separator’s efficiency is simulated by using DPM. The empirical models being used for Cyclone Separator Efficiency are:
- Iozia-Leith Model
It’s a modified version of Barth’s model, being developed for force balance. This model assumes that the particle carried by vortex endures both centrifugal force and flow resistance.
- Li-Wang Model
This model introduces particle bounce and turbulent diffusion at the cyclone wall. This model was developed based on
- Non-constant radical particle velocity and radial concentration profile for uncollected particles within the cyclone.
- Boundary conditions based on parameter with the consideration of turbulent diffusion coefficient and particle bounce.
- Tangential velocity related to the radius of the cyclone.
4. MESH DETAILS
Table 4.1: Mesh Details
|
METRICS |
VALUE |
|
MESH SIZE |
7.5e-3 m |
|
NODES |
43,143 |
|
ELEMENTS |
2,16,784 |
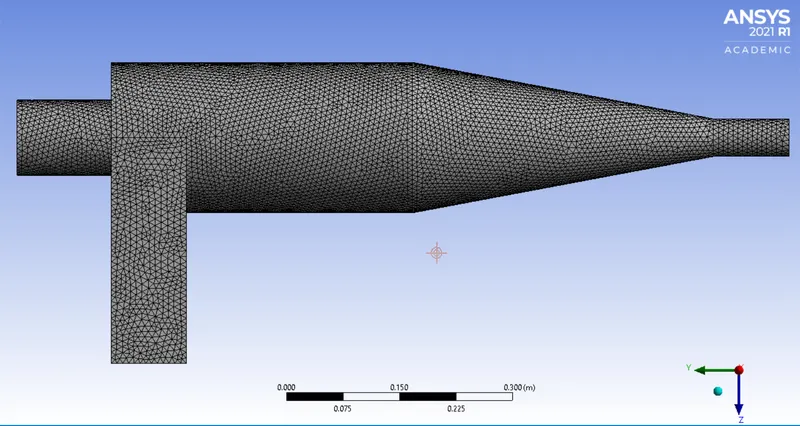
Fig.4.1: Fluid Volume Mesh
5. BOUNDARY CONDITIONS
Inlet and wall: Reflect
Outlet (Top): Escape
Outlet (Bottom/dustbin): Trap
6. RESULTS
Solution was calculated for 600 iterations, using standard initialization.
6.1. CASE 1
6.1.1. DIAMETER = 1 μm
A total number of 196 particles has been tracked, where 78 particles escaped and 118 particles are incomplete.
Table 6.1.1.1: Particle Tracked Data for 1μm
|
METRICS |
VALUE |
|
PARTICLES TRACKED |
196 |
|
PARTICLES ESCAPED |
44 |
|
PARTICLES TRAPPED |
34 |
|
PARTICLES INCOMPLETE |
118 |
|
MASS FLOW AT INLET |
0.018375 kg/s |
|
MASS FLOW RATE AT OUTLET 1 |
0.0148928 kg/s |
|
MASS FLOW RATE AT OUTLET 2 |
0.00347712 kg/s |
6.1.2. DIAMETER = 3 μm
Table 6.1.2.1: Particle Tracked Data for 3μm
|
METRICS |
VALUE |
|
PARTICLES TRACKED |
196 |
|
PARTICLES ESCAPED |
19 |
|
PARTICLES TRAPPED |
175 |
|
PARTICLES INCOMPLETE |
2 |
|
MASS FLOW AT INLET |
0.018375 kg/s |
|
MASS FLOW RATE AT OUTLET 1 |
0.0148928 kg/s |
|
MASS FLOW RATE AT OUTLET 2 |
0.00347712 kg/s |
6.1.3. DIAMETER = 5 μm
Table 6.1.3.1: Particle Tracked Data for 5μm
|
METRICS |
VALUE |
|
PARTICLES TRACKED |
196 |
|
PARTICLES ESCAPED |
0 |
|
PARTICLES TRAPPED |
195 |
|
PARTICLES INCOMPLETE |
1 |
|
MASS FLOW AT INLET |
0.018375 kg/s |
|
MASS FLOW RATE AT OUTLET 1 |
0.0148928 kg/s |
|
MASS FLOW RATE AT OUTLET 2 |
0.00347712 kg/s |
6.2. CASE 2
6.2.1. VELOCITY = 1 MPS
Table 6.2.1.1: Particle Tracked Data for 5μm
|
METRICS |
VALUE |
|
PARTICLES TRACKED |
196 |
|
PARTICLES ESCAPED |
7 |
|
PARTICLES TRAPPED |
10 |
|
PARTICLES INCOMPLETE |
179 |
|
MASS FLOW AT INLET |
0.006125 kg/s |
|
MASS FLOW RATE AT OUTLET 1 |
0.00493269 kg/s |
|
MASS FLOW RATE AT OUTLET 2 |
0.00119232 kg/s |
6.2.2. VELOCITY = 5MPS
Table 6.2.2.1: Particle Tracked Data for 5μm
|
METRICS |
VALUE |
|
PARTICLES TRACKED |
196 |
|
PARTICLES ESCAPED |
0 |
|
PARTICLES TRAPPED |
156 |
|
PARTICLES INCOMPLETE |
40 |
|
MASS FLOW AT INLET |
0.0153125 kg/s |
|
MASS FLOW RATE AT OUTLET 1 |
0.0123942 kg/s |
|
MASS FLOW RATE AT OUTLET 2 |
0.00291539 kg/s |
6.2.3. VELOCITY = 5 MPS
Table 6.2.3.1: Particle Tracked Data for 5μm
|
METRICS |
VALUE |
|
PARTICLES TRACKED |
196 |
|
PARTICLES ESCAPED |
0 |
|
PARTICLES TRAPPED |
196 |
|
PARTICLES INCOMPLETE |
0 |
|
MASS FLOW AT INLET |
0.030625 kg/s |
|
MASS FLOW RATE AT OUTLET 1 |
0.0249152 kg/s |
|
MASS FLOW RATE AT OUTLET 2 |
0.00569919 kg/s |
7. CONCLUSION
- The particle flow’s turbulence reduces with increase in velocity and particle size.
- When particle size reduces below 5μm, incomplete particles increases resulting in reduced efficiency.
- When particle velocity reduces below 5 m/s, efficiency reduces due to incomplete particles.