Week 8 - Simulating Cyclone separator with Discrete Phase Modelling
Aim
To perform analysis on cyclone separator and calculate the separation efficiency and pressure drop.
Objectives
- To write a few words about any four empirical models used to calculate the cyclone separator efficiency.
- To perform an analysis on a given cyclone separator model by varying the particle diameter from 1 μm to 5 μm and calculating the separation efficiency in each case. Discuss the results. [Use both the velocities as 3m/sec.]
- To perform an analysis on a given cyclone separator model by varying the particle velocity from 1 m/sec to 5 m/sec and calculate the separation efficiency and pressure drop in each case. Discuss the results. [Use particle diameter size as 5 μm for all cases & keep flow velocity same as particle velocity]
Introduction
- Cyclone Separator
A cyclone separator is a device that is built to remove particulate matter from an air, gas, or liquid stream without any kind of filter. This is achieved through vortex separation.
In this device, a high-speed rotating flow is created within a cylindrical or conical container.
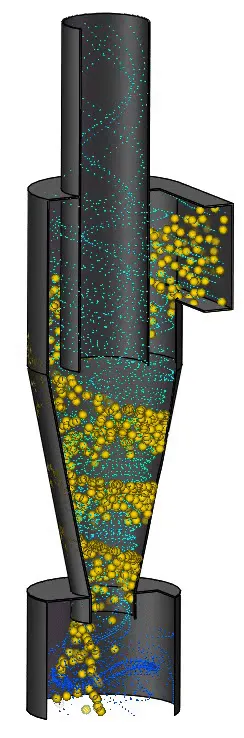
Beginning from the top, air flows in a helical pattern and ends at the narrow bottom before exiting the cyclone. Larger particles in this rotating stream have more inertia to follow the sharp curves of the stream and hence strike on the outside wall then fall to the bottom of the cyclone where they can be removed.
- Effectiveness
The effectiveness of a cyclone separator is a measurement of its ability to separate particles from the flowing gas stream. The efficiency of the separator is depending upon the diameter of the particle, the diameter of the cyclone, etc. If there is a large amount of lighter particulate matter, fewer of these particles are able to be separated out. Because of this, cyclone separators work best on flue gases that contain large amounts of big particulate matter.
The efficiency of the separator increases as the cone diameter decreases. Thus reducing the diameter of the cone enables the removal of finer particles. A small diameter cone will extract more fine particles from the gas stream than a larger diameter cone.
- Pressure drop
Pressure drop is defined as the amount of energy required to move the gas through the separator. Pressure drop is a product of gas flow rate, gas density, and cyclone geometry
Pressure drop is defined as absolute pressure at the inlet – absolute pressure at the outlet.
`∆P=P_(i)-P_o`
Empirical models used to calculate the cyclone separator efficiency.
- Iozia and Leith Model
This model has developed bae on force balance. The model assumes that a particle carries by the vortex endures the influence of two forces, a centrifugal force Z, and a flow resistance W.
The collection efficiency of particle diameter can be calculated from,
`ⴄ_i=1/(1+(d_pc⁄d_pi )^β)`
- Li and Wang Model
The Li and Wang model include particle bounce or re-entrainment and turbulent diffusion at the cyclone wall. A two-dimensional analytical expression of particle distribution in the cyclone is obtained. Li and Wang's model was developed based on the following assumptions:
- The radial particle velocity and the radial concentration profile are not constant, for uncollected particles within the cyclones.
- Boundary conditions with the consideration of turbulent diffusion coefficient and particle bounce re-entrainment on the cyclone wall are:`C= C_0` at `θ=0`
- Koch and Licht Model
Koch and Licht collection theory recognized the inherently turbulent nature of cyclones and the distribution of gas residence times within the cyclone. Koch and Licht describe particle motion in the entry and collection regions with the additional following assumptions:
- The tangential velocity of a particle is equal to the tangential velocity of the gas flow, i.e. there is no slip in the tangential direction between the particle and the gas.
- The tangential velocity is related to the radius of the cyclone by uRn = constant.
- Lapple Model
Lapple model was developed based on force balance without considering the flow resistance. Lapple assumed that a particle entering the cyclone is evenly distributed across the inlet opening. The particle that travels from inlet half width to the wall in the cyclone is collected with 50% efficiency.
The simulation is divided into two Cases:
CASE 1: Analysis by varying the particle diameters from 1 μm to 5 μm and velocity 3m/s
- Diameter = 1 μm
- Diameter = 2 μm
- Diameter = 3 μm
- Diameter = 4 μm
- Diameter = 5 μm
CASE 2: Analysis by varying the particle velocity from 1m/s to 5m/s and diameter 3 μm
- Inlet velocity = 1m/s
- Inlet velocity = 2m/s
- Inlet velocity = 3 m/s
- Inlet velocity = 4m/s
- Inlet velocity = 5m/s
Methodology
To carry out this simulation, we will be using discrete phase modeling (DPM). This modeling is used when we want to represent solid particles in gas or liquid. DPM consists of two phases. One is the continuous phase and the other is a discrete phase.
The continuous phase consists of fluid that is flowing within the volume. The discrete phase consists of smaller particles that are supposed to be interacting with the continuous phase. The discrete phase can also exchange momentum, mass, and energy with the fluid phase or the continuous phase.
- Pre-processing
Model creation
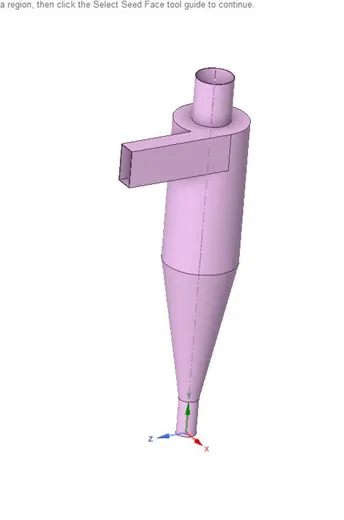
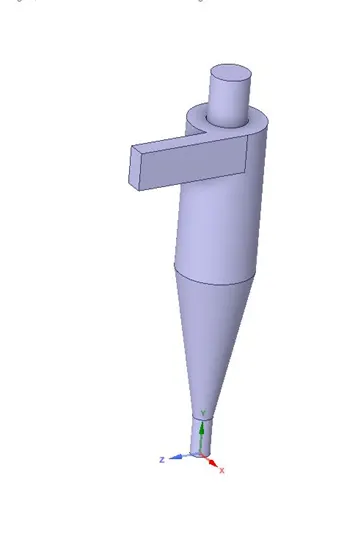
Open ANSYS Spaceclaim and import the 3d model of cyclone separator. As this is a fluent problem we need to extract the fluid volume in order to proceed with ANSYS FLUENT. For that, go to extract and click on the volume extract option. Click on the fluid boundary edges to extract the volume. After extracting the volume suppress the main model and close the SPACECLAIM.
Meshing
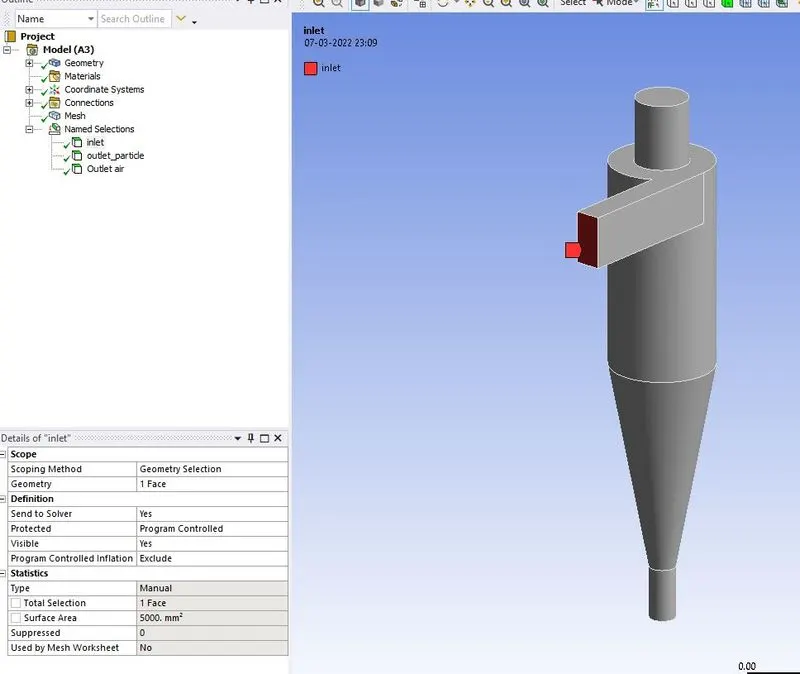
In order to identify the inlet and outlet areas, the model has been named as below. Inlet, outlet_air, and outlet_particle
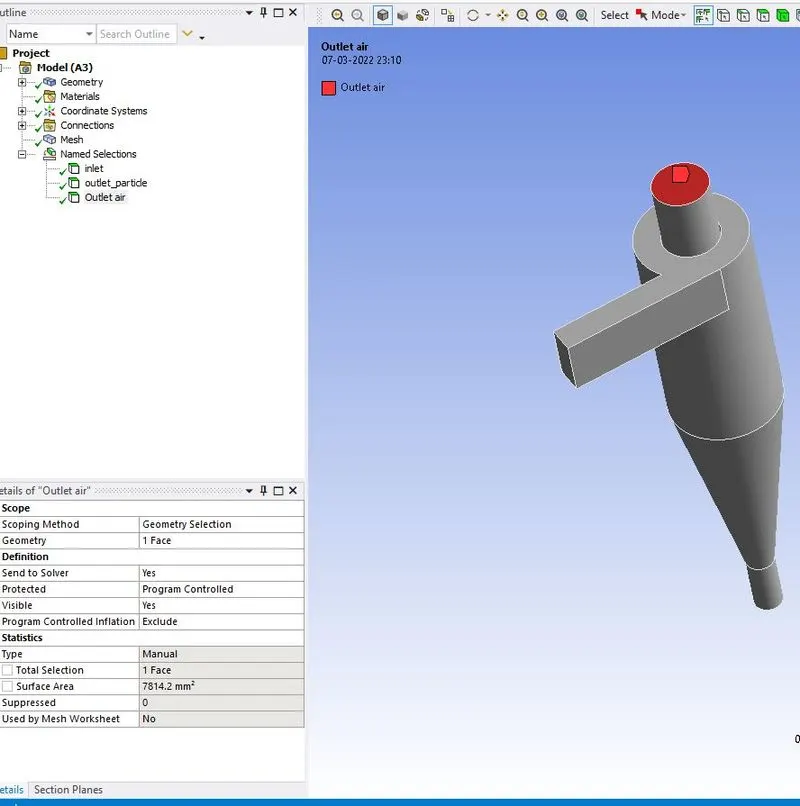
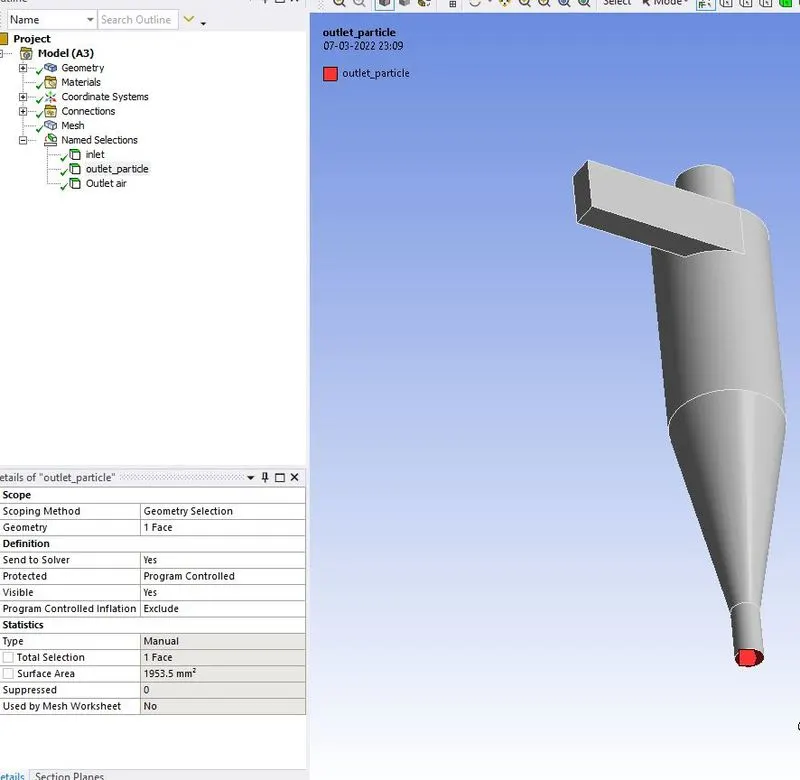
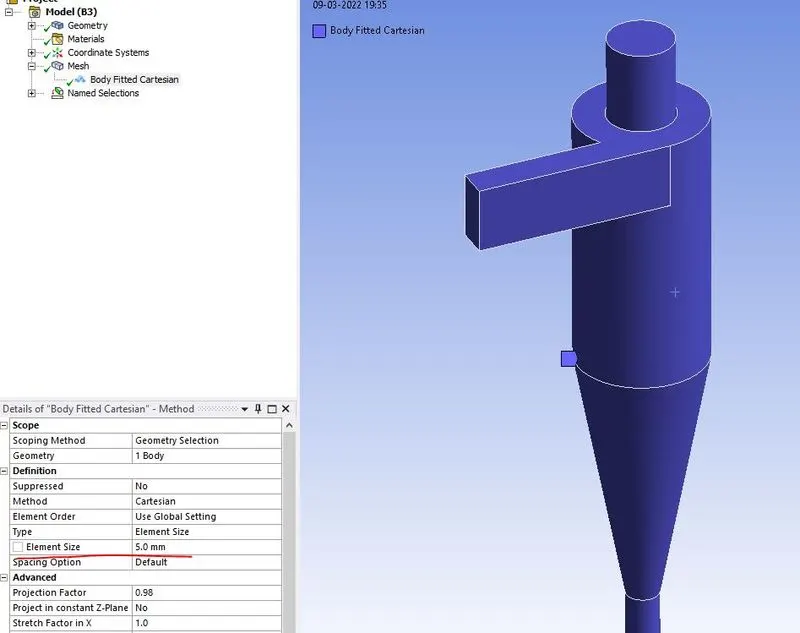
We will be doing a structured Cartesian mesh to get the particles well-tracked. Right-click on the mesh and click method. Under geometry select the entire bode. Under the method, select Cartesian. Enter element size = 5mm. Generate the mesh.
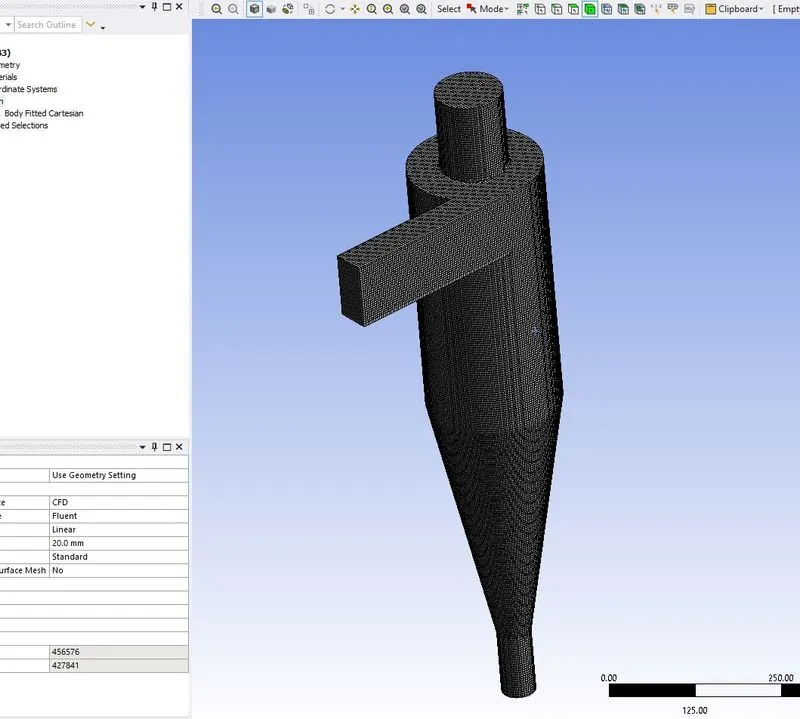
Total number of elements = 427841
Now close the meshing module and open setup.
Setting up the problem
Here we setup the problem by applying relevant
- Initial conditions
- Boundary conditions
- Material properties
- Turbulence Models
We will be doing a steady-state pressure-based analysis with gravity =9.81m/s^2.
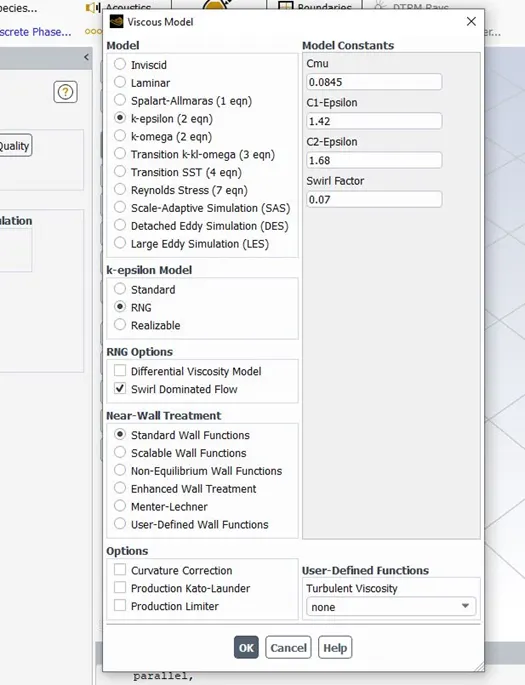
The viscous model is k-epsilon RNG (Renormalization Group). This model significantly improves the accuracy for rapidly strained flows. The effect of swirl on turbulence can be studied precisely using the RNG model with the swirl-dominated flow.
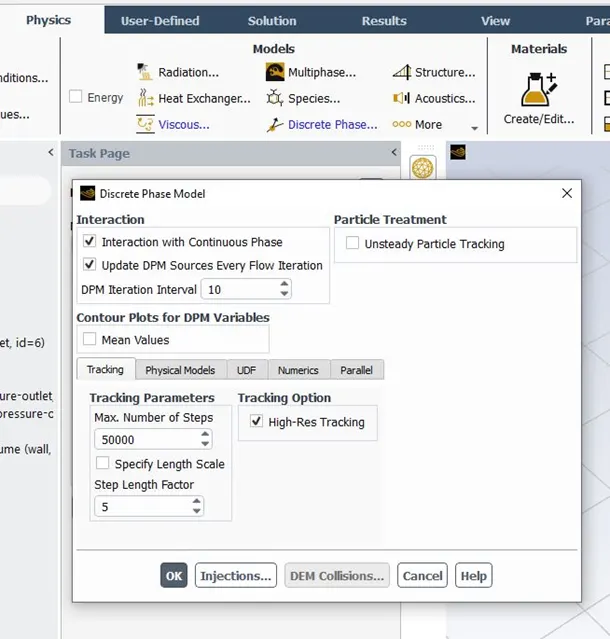
Next, we will set up DPM. Click on discrete phase under the model menu. Check interaction with continuous phase to enable the coupled flow. Enable update DPM sources every flow iteration to keep a track of particle source terms at every iteration.
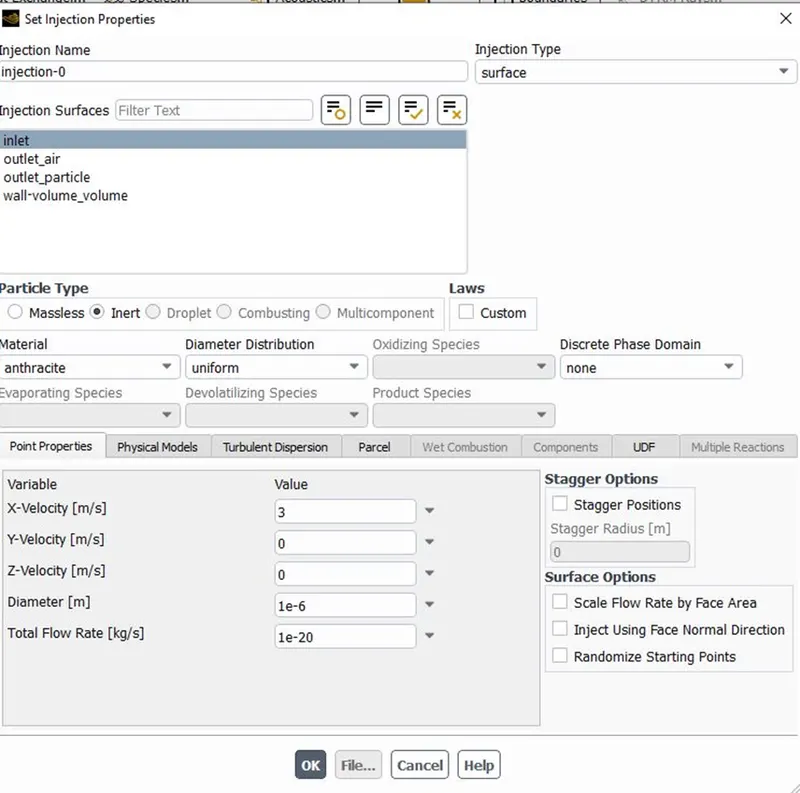
Next is to define the injection of the discrete particles on the continuous phase. Click on injections then create and select the particle type as inert. The material is Anthracite. Select surface as injection type. And select inlet as injection surface. Under point properties, we can add particle velocity and particle diameter.
For CASE 1 the particle diameter is varying from 1 μm to 5 μm and velocity is fixed at 3m/s
For CASE 2 the particle velocity is varying from 1m/s to 5m/s keeping a diameter of 5 μm.
After creating DPM, boundaries are defined.
Inlet – Velocity inlet – velocity mag = 3m/s (CASE 1)
= 1 to 5 m/s (CASE2)
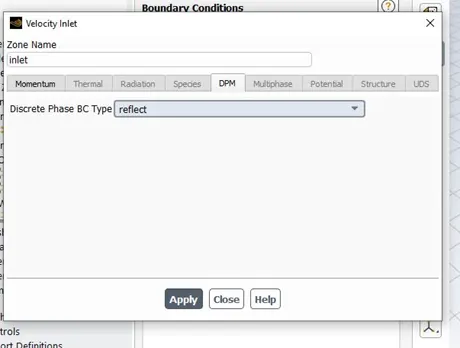
Select reflect as discrete phase BC type under DPM for inlet
Outlet_air – Escape
Outlet_particle – Trap
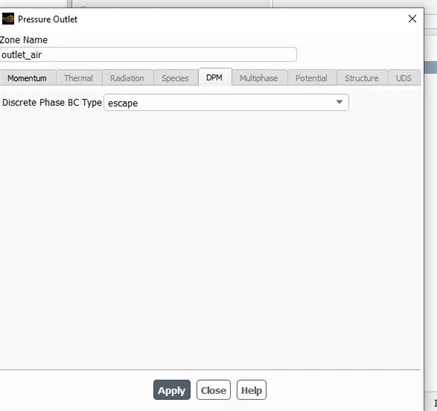
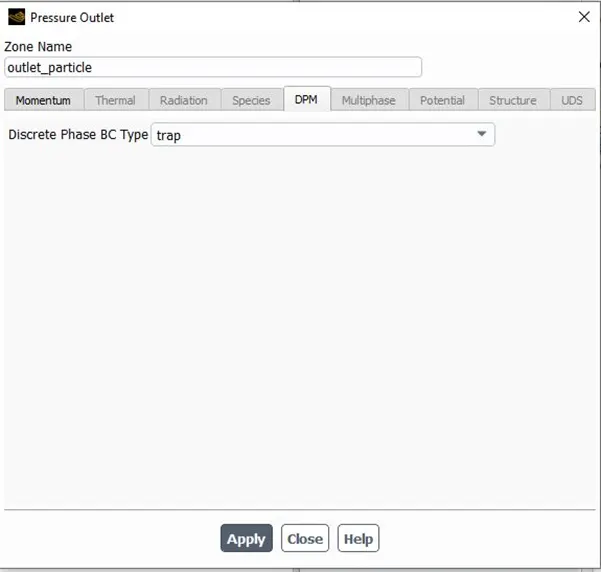
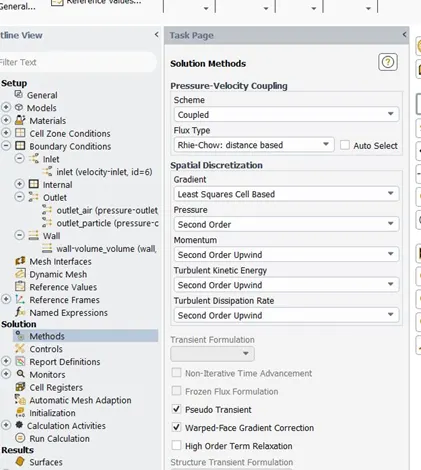
Under solution Methods, Select coupled scheme. Change spatial discretization scheme of turbulent kinetic energy and turbulent dissipation rate to second-order upwind.
Second-order upwind is the more accurate spatial discretization scheme for these sort of swirl problems.
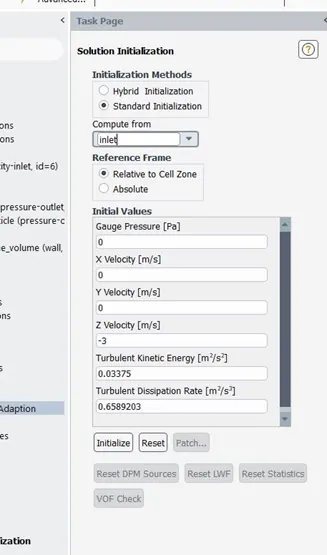
Initialize the solution from the inlet using standard initialization.
Number of iterations = 1000
As this problem involves tracking particles we have to export the particles data once the solution is converged. For that go to the File menu, click on export and click on particle history data.
Select the injection and click on browse to save. Finally, click on write.
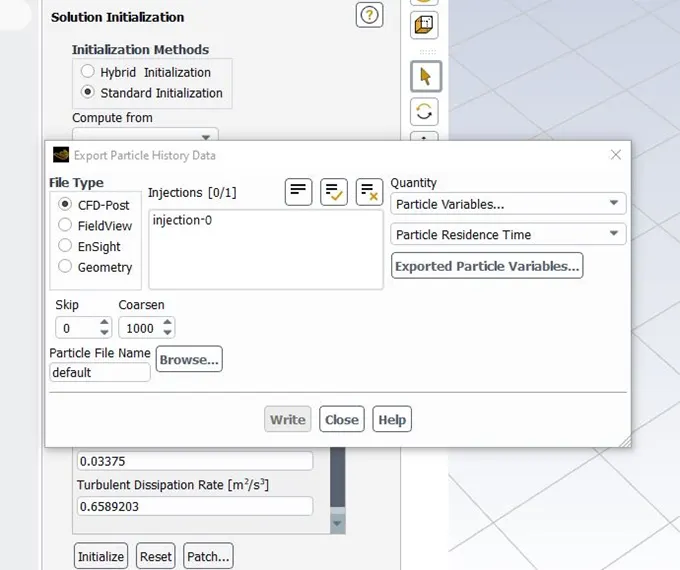
After this, we can see how many particles were tracked, escaped, and trapped.

- Solutions
The results obtained after the simulation is then loaded into the CFX post and as follows,
Case 1: Analysis by varying the particle diameters from 1 μm to 5 μm and velocity 3 m/s
- Pressure Contour
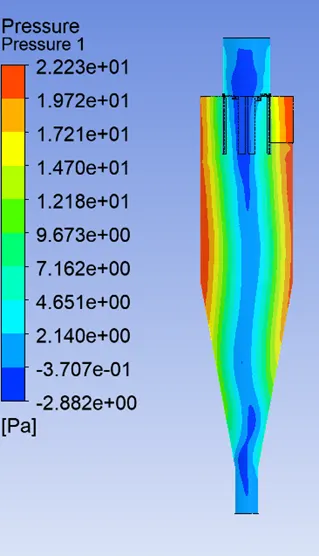
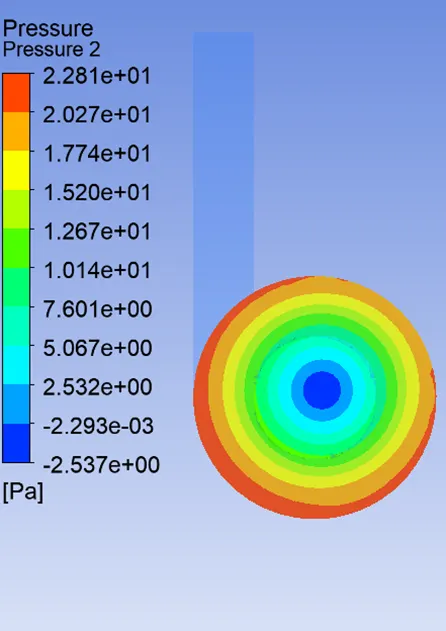
Since the flow velocity is kept constant in this case, the pressure contour will be the same for all the particle sizes.
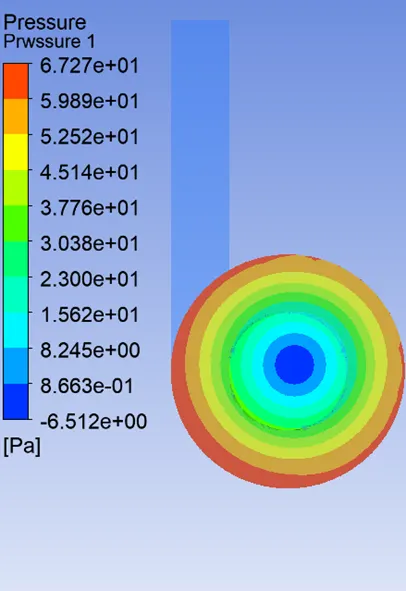
From the contour, we can observe that the pressure is maximum near the wall and it is getting reduced towards the center of the separator. We can see that negative pressure appears at the center which results in a huge pressure drop and hence the formation of a vortex in the center. Also, the pressure is very less at the top outlet region compared to other regions in the separator. Therefore most of the air escapes out through the top outlet by utilizing the vortex channel created in the center of the separator.
Pressure at inlet = 25.63 Pa
Pressure at air outlet = -0.021 Pa
Pressure Drop = 25.63-(-0.021) = 25.65 Pa
- Velocity Contour
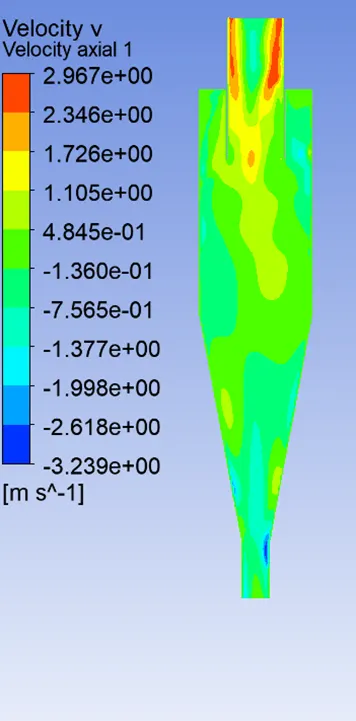
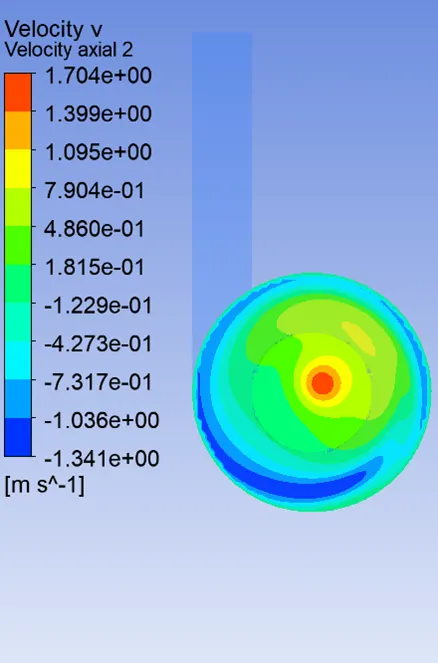
Since the flow velocity is kept constant in this case, the velocity contour will be the same for all the particle sizes.
- Anthracite Particle Time
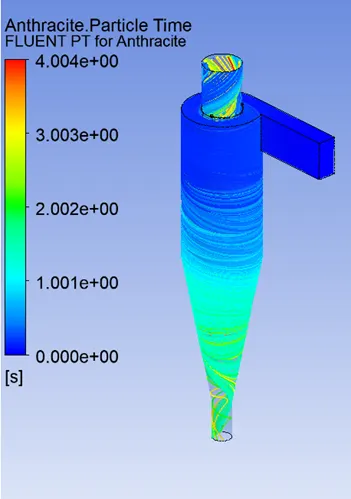
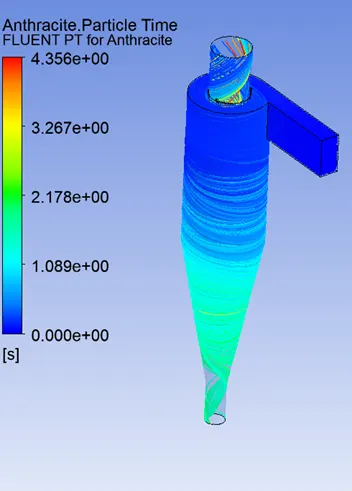
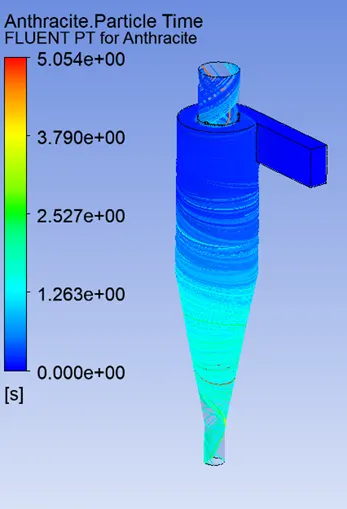 1 μm 2 μm 3 μm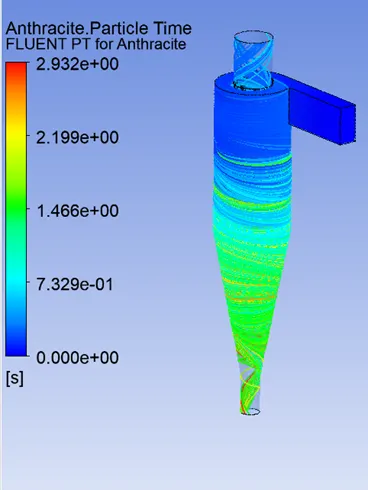
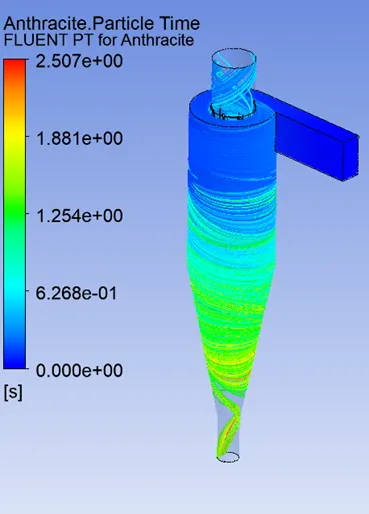
4 μm 5 μm
From the plots, we can observe that the particle time inside the separator is reducing as the size of the particle increases. Also, the number of particles escaping through the air outlet is reduced as the particle size increases.
Following animations give a detailed view of particle motion.
https://drive.google.com/file/d/1RmFon82lvn3itMe42VkXhDIqXCfZvxhk/view?usp=sharing
https://drive.google.com/file/d/1rgIpJm9BfoRLAgEVBDPx7rfm1K2tZYRg/view?usp=sharing
https://drive.google.com/file/d/1tvfiddUPsB9YCEAEs7ZHw5Bz8DpVvO0T/view?usp=sharing
https://drive.google.com/file/d/1DMU_W3tRO9Jm8iI1Of7lu78aYMTb2Xor/view?usp=sharing
https://drive.google.com/file/d/1Qtm2jpbG5GuUvzfwfwxtcK_4iVhD9pD2/view?usp=sharing
The attached table shows the details of particles and the separation efficiency.
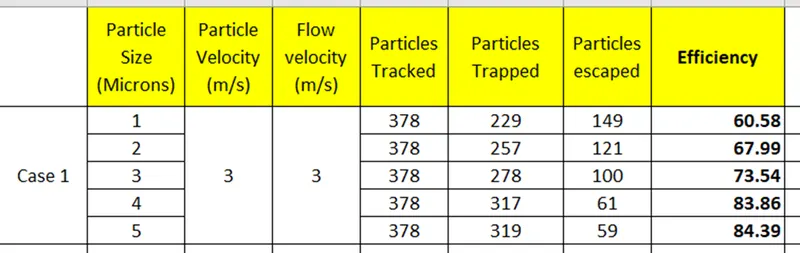
From the table, it is clear that the separation efficiency increases as the particle diameter increases.
Case 2: Analysis by varying the particle velocity from 1 m/s to 5 m/s keeping diameter 5 μm
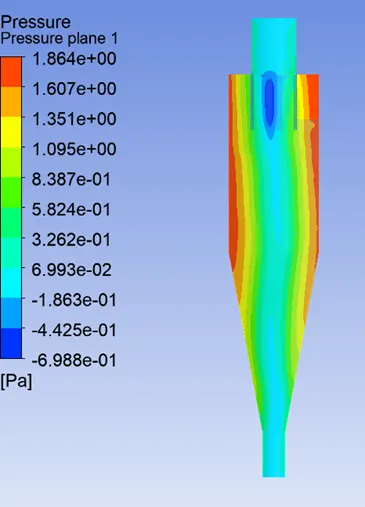
- Pressure contour
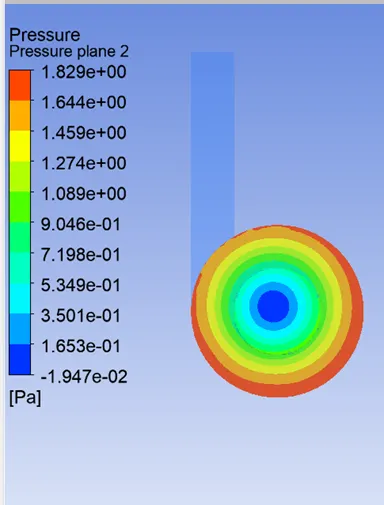 1 m/s
1 m/s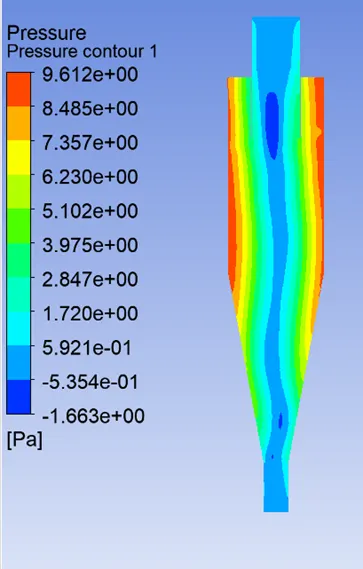
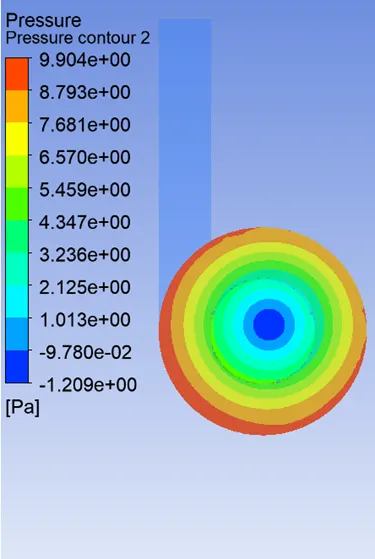 2 m/s
2 m/s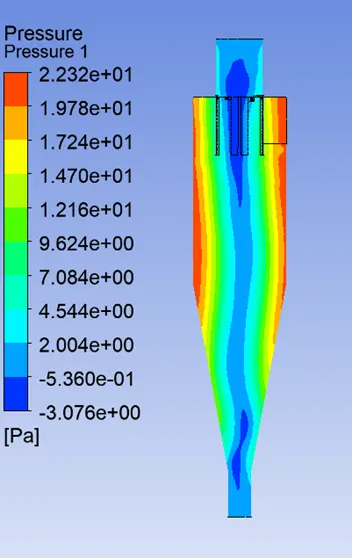
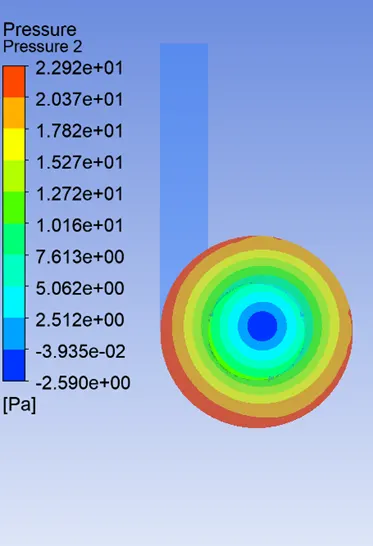 3m/s
3m/s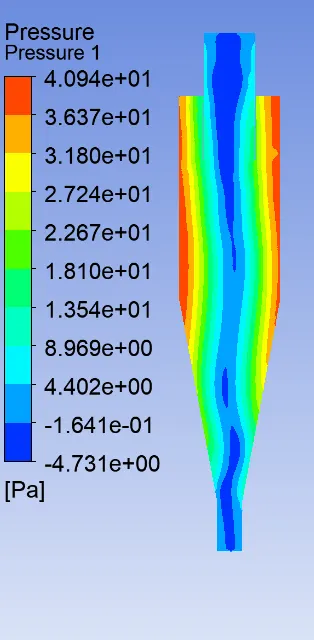
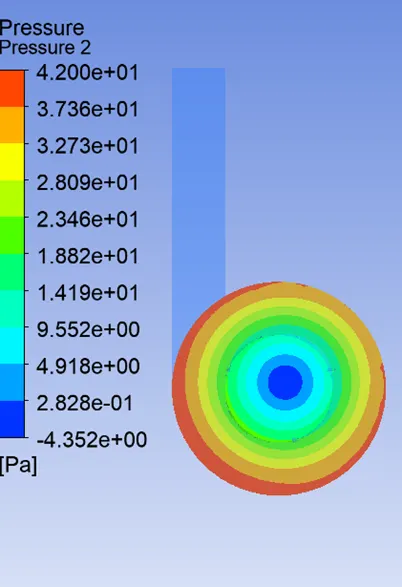 4 m/s
4 m/s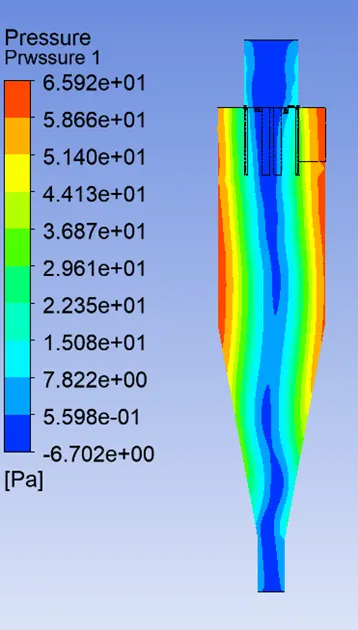
 5m/s
5m/s
When the inlet velocity is increased, the pressure values are also increased, which further increases the negative pressure at the separator center. This further increases the pressure drop.
The pressure drop for different velocities is tabulated below.
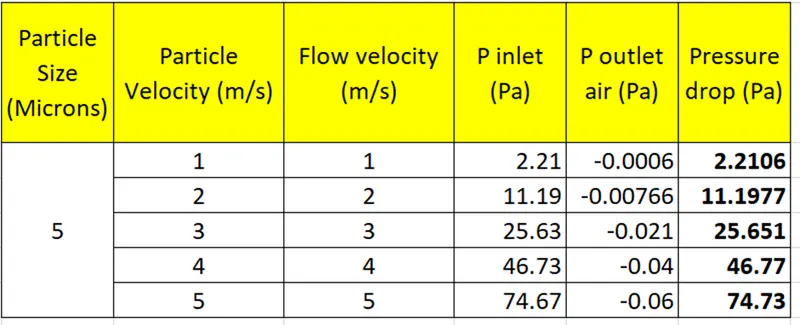
In general, from the contour, we can observe that the pressure is maximum near the wall and it is getting reduced towards the center of the separator. We can see that negative pressure has appeared at the center which results in a huge pressure drop and hence the formation of a vortex in the center. Also, the pressure is very less at the top outlet region compared to other regions in the separator. Therefore most of the air escapes out through the top outlet by utilizing the vortex channel created in the center of the separator.
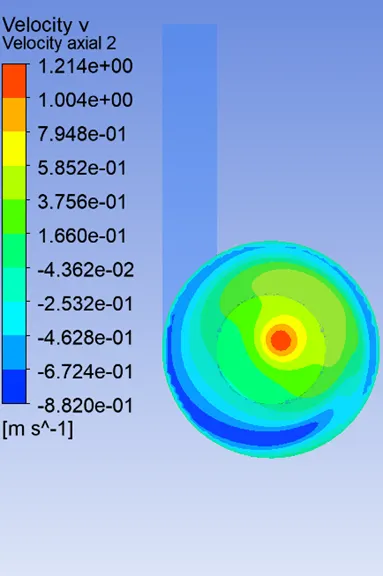
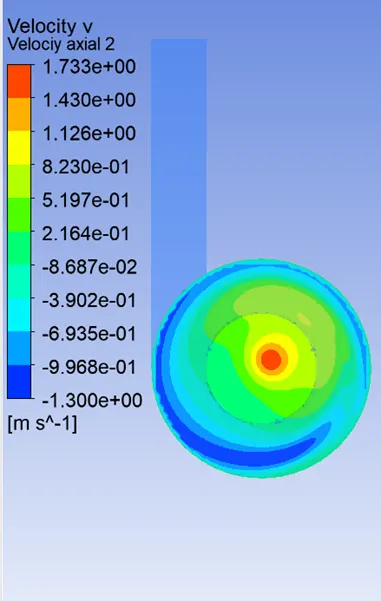
- Velocity contour
 1 m/s
1 m/s 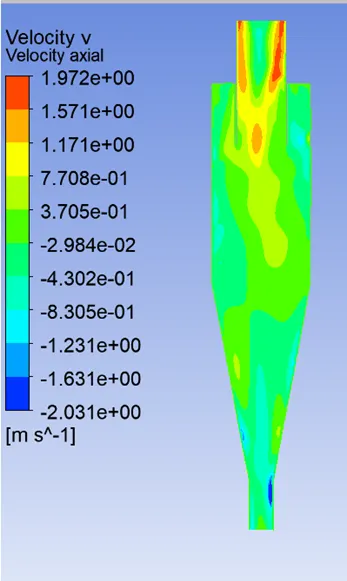
 2 m/s
2 m/s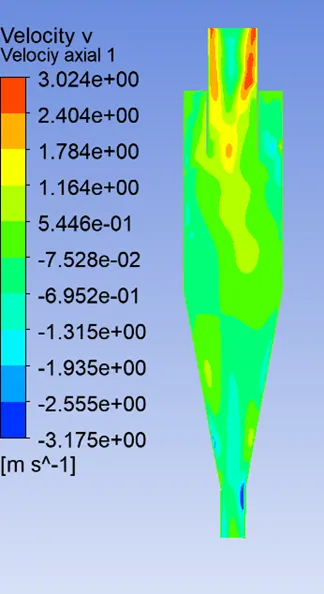
 3m/s
3m/s 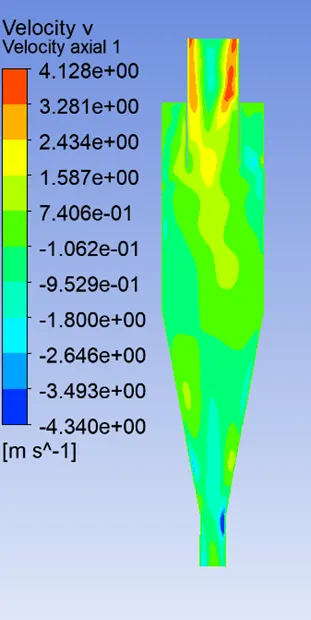
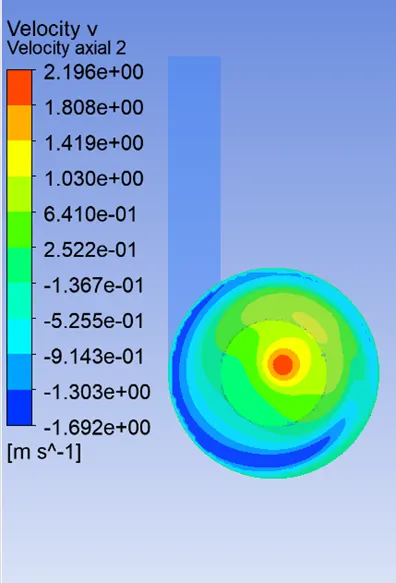 4 m/s
4 m/s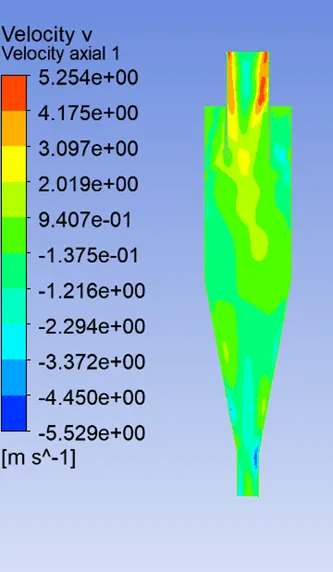
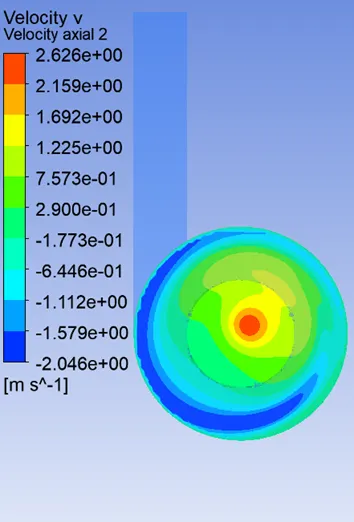 5 m/s
5 m/s
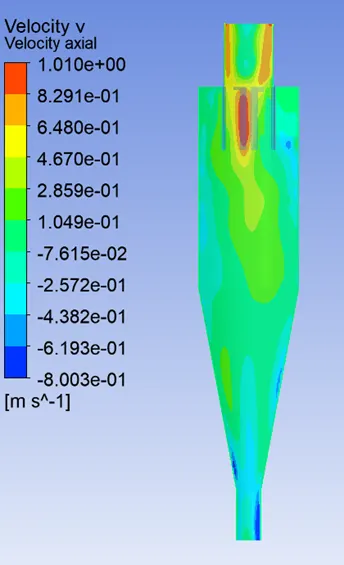
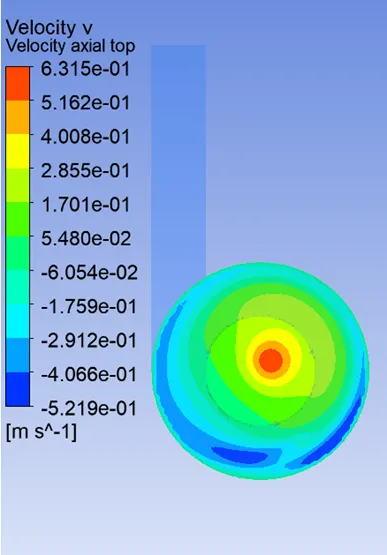
The effect of pressure drop can be seen in the velocity contour plot. The velocity at the center region is more than the other region.
- Anthracite Particle Time
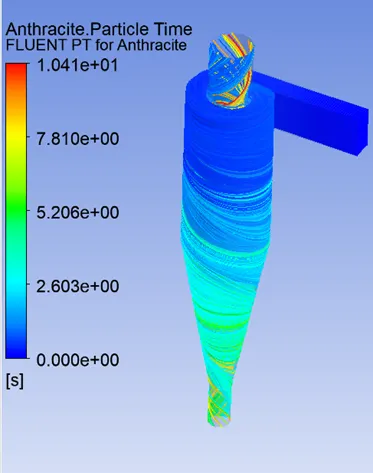
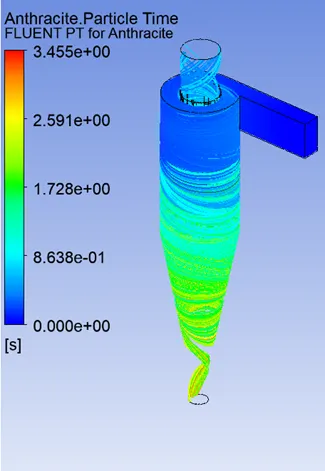
1 m/s 2 m/s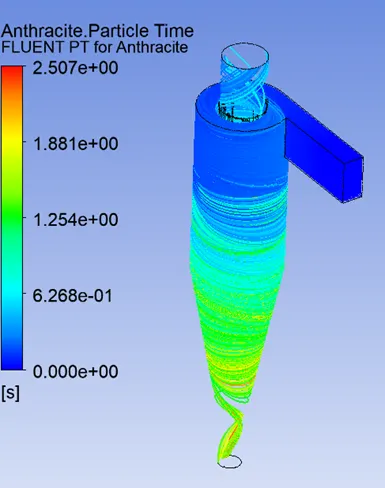
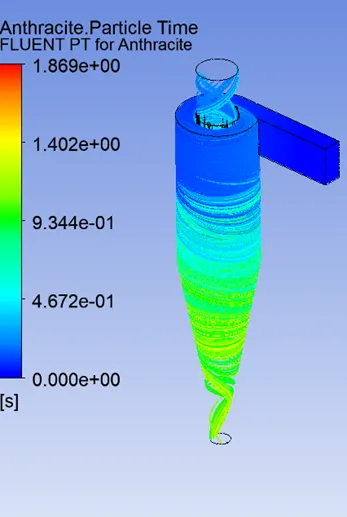
3 m/s 4 m/s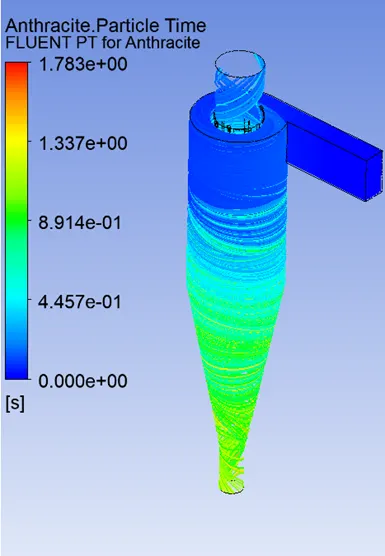
5 m/s
From the plots, we can observe that the particle time inside the separator is reducing as the inlet velocity increases. Also, the number of particles escaping through the air outlet is reduced as the velocity increases.
Following animations give a detailed view of particle motion.
https://drive.google.com/file/d/1KD9htRcNnSSY4QgcxdsWL1dKJxOHBu6H/view?usp=sharing
https://drive.google.com/file/d/1fl3E4ycaQu6WItkiyTBuGiy1aw6xRTuq/view?usp=sharing
https://drive.google.com/file/d/18loLlJauz80nPDNmN2r9-SiDJYzYpF48/view?usp=sharing
https://drive.google.com/file/d/1pDf7OSqI3e7CRZRi7TQt74woLeoW0wWD/view?usp=sharing
https://drive.google.com/file/d/1MN9SwEtFAb660uHgU4eAlfB4CaI9hcYo/view?usp=sharing
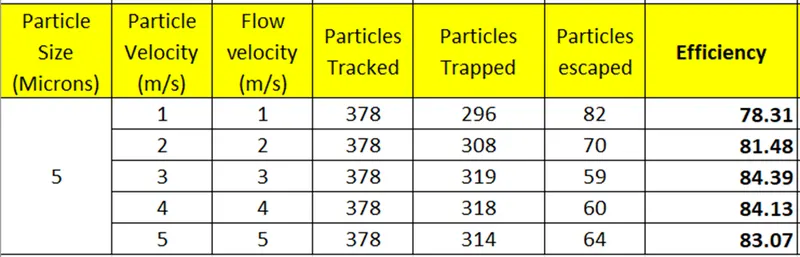
The attached table shows the details of particles and the separation efficiency.
Conclusions
- The efficiency of the cyclone separator is directly proportional to the particle size for a given cyclone separator.
- The efficiency increases as the particle size increases. This means large particles can be more easily separated than small particles.
- For a particular particle size, the effectiveness can be increased by increasing the inlet velocity. Also, there is an increase in pressure drop in the system as the inlet velocity increases.