Simulating Cyclone separator with Discrete Phase Modelling
Simulating Cyclone separator with Discrete Phase Modelling
INTRODUCTION
Cyclones are devices that employ a centrifugal force generated by a spinning gas stream to separate particles from the carrier gas. Their simple design, low maintenance costs, and adaptability to a wide range of operating conditions such as sizes and flow rates make cyclones one of the most widely used particle removal devices. By using suitable materials and methods of construction, cyclones may be adapted for use in extreme operating conditions: high temperature, high pressure, and corrosive gases. Cyclones are important particle removal devices in both engineering and process operations. An inaccuracy in cyclone efficiency prediction may result in an inefficient design of cyclone separators. Models to predict the behavior of cyclones are usually empirical. It remains largely a process of trial and error since empirical cyclones models are only applicable to specific cyclone geometries. This study reviews the prediction of four different cyclone efficiency empirical models, namely Lapple [8], Koch and Licht [7], Li and Wang [9], and Iozia and Leith [4]. All predictions are compared with published measurements from literature over a wide range of operating conditions. The result from this work will provide guidance to the cyclone designer or operation engineer to select the most appropriate cyclone model depending on inlet flow rate, temperature and pressure used. In this study, models are solved numerically using a Microsoft Excel spreadsheet.
of the chamber and is constrained to follow a spiral flow path. Any particles suspended within the fluid are subjected to an enhanced radial acceleration. The larger particles migrate outwards to the cone wall where they travel in a downward spiral to the base of the chamber and exit at the
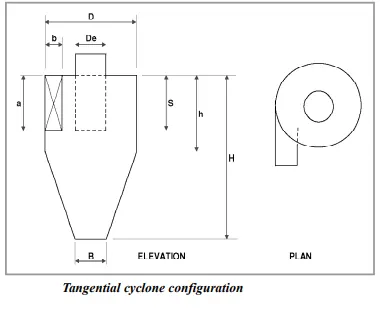

CYCLONE EFFICIENCY EMPIRICAL MODELS
1:- IOZIA AND LEITH MODELIozia and Leith's (1990) logistic model is a modified version of Barth (1956) model which is developed based on force balance. The model assumes that a particle carried by the vortex endures the influence of two forces: a centrifugal force, Z, and flow resistance, W. Core length, zc, and core diameter, dc, are given as
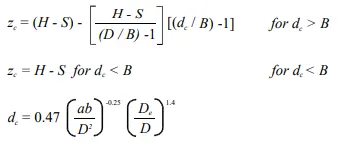
The addition made by Iozia and Leith on the original Barth (1956) models are the core length zc and slope parameter β an expression which is derived based on the statistical analysis of experimental data of cyclone with D = 0.25 m. The collection
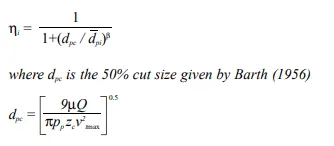
efficiency ηi of particle diameter dpi can be calculated from
2:- LI AND WANG MODEL
The Li and Wang (1989) model includes particle bounce or re-entrainment and turbulent diffusion at the cyclone wall. A two-dimensional analytical expression of particle distribution in the cyclone is obtained. Li and Wang model was developed based on the following assumptions:
• The radial particle velocity and the radial concentration profile are not constant, for uncollected particles within the cyclones.
• Boundary conditions with the consideration of turbulent diffusion coefficient and particle bounce re-entrainment on the cyclone wall are:
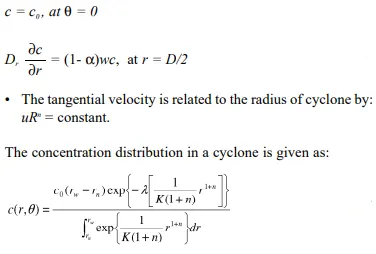
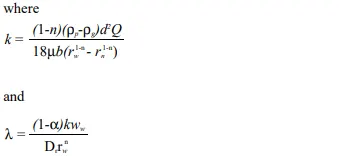
The resultant expression of the collection efficiency for particle of my size is given as
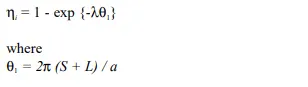
3:-KOCH AND LICHT MODEL
Koch and Licht (1977) collection theory recognized the inherently turbulent nature of cyclones and the distribution of gas residence times within the cyclone. Koch and Licht describe particle motion in the entry and collection regions with the additional following assumptions:
• The tangential velocity of a particle is equal to the tangential velocity of the gas flow, i.e. there is no slip in the tangential direction between the particle and the gas.
• The tangential velocity is related to the radius of cyclone by:
uRn = constant.
A force balance and an equation on the particles collection yields the grade efficiency ηi
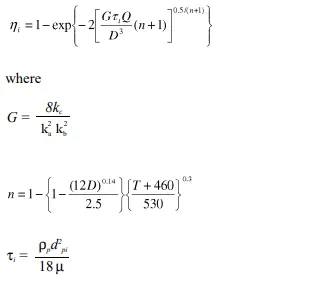
G is a factor related to the configuration of the cyclone, n is related to the vortex and τ is the relaxation term.
4:-LAPPLE MODEL
Lapple's (1951) model was developed based on force balance without considering the flow resistance. Lapple assumed that a particle entering the cyclone is evenly distributed across the inlet opening. The particle that travels from the inlet half-width to the wall in the cyclone is collected with 50% efficiency. The semi-empirical relationship developed by Lapple (1951) to calculate a 50% cut diameter, dpc, is
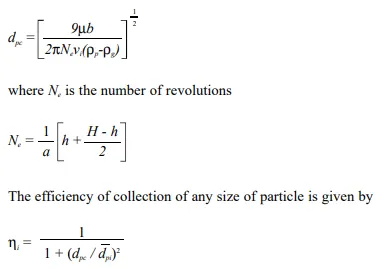
Here we will be simulating the cyclone separator for 6 CASES where
PART1-
CASE1:-particle diameter 1 μm and particle velocity 3 m/sec
CASE2:-particle diameter 3 μm and particle velocity 3 m/sec
CASE3:-particle diameter 5 μm and particle velocity 3 m/sec
PART2-
CASE1:-particle diameter 5 μm and particle velocity 1 m/sec
CASE2:-particle diameter 5 μm and particle velocity 3 m/sec
CASE3:-particle diameter 5 μm and particle velocity 5 m/sec
GEOMETRY:-
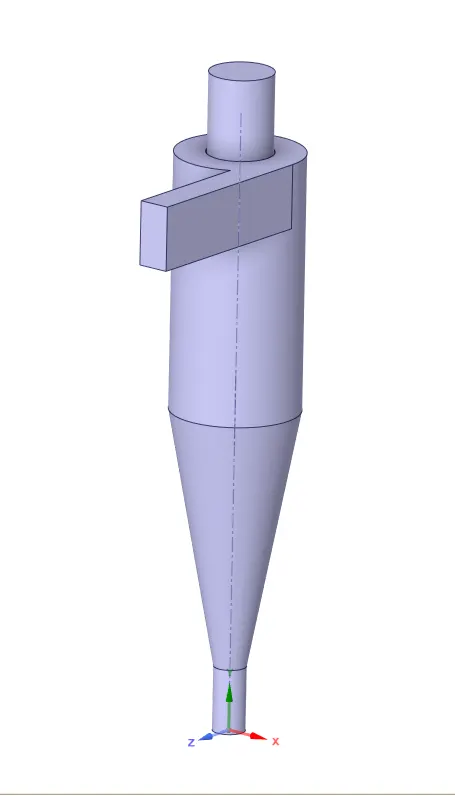
Extract the fluid volume from the cyclone separator by using the volume extract
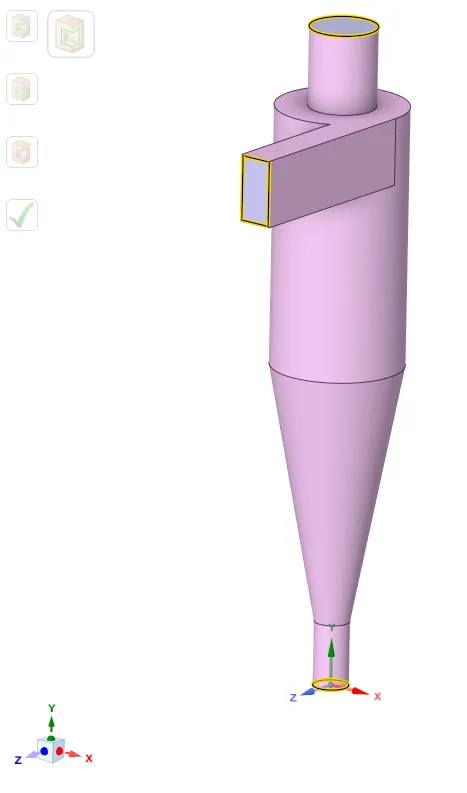 `->`
`->` 
MESHING:-
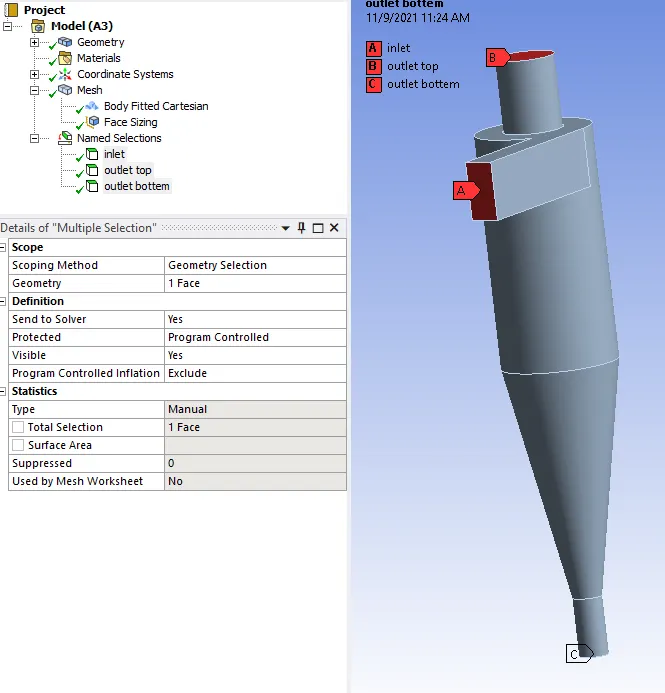
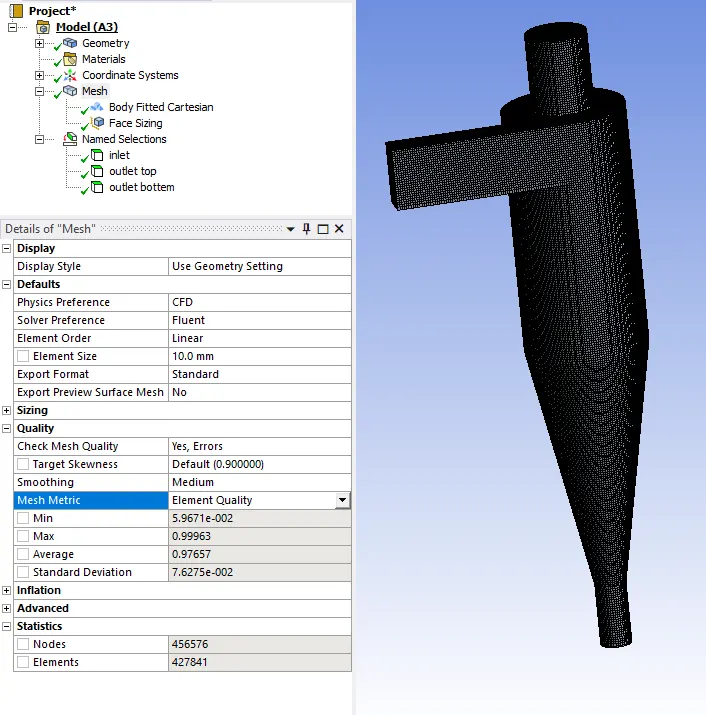
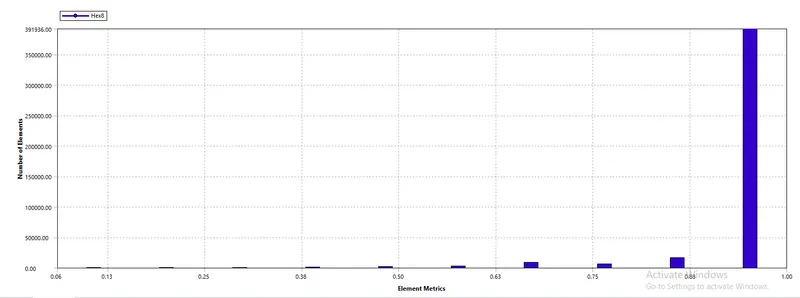
Meshing is done by using the cartesian method(10 mm) and giving the body sizing on the inlet 3 mm
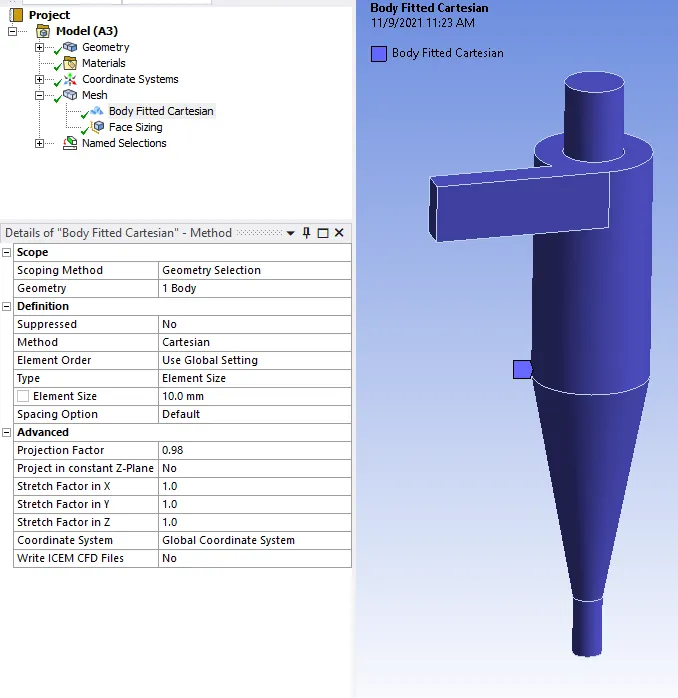
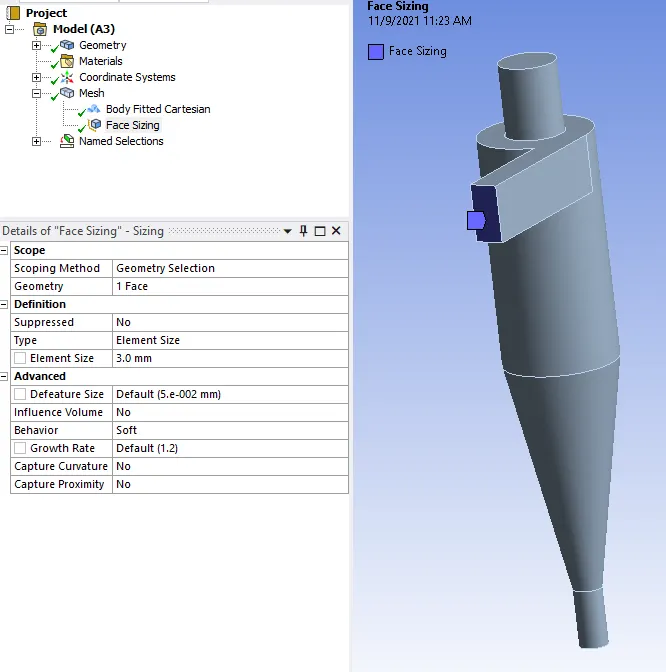
Naming the surfaces inlet, outlet bottom, outlet top
PART1-
CASE1:-particle diameter 1 μm and particle velocity 3 m/sec
SETUP:-
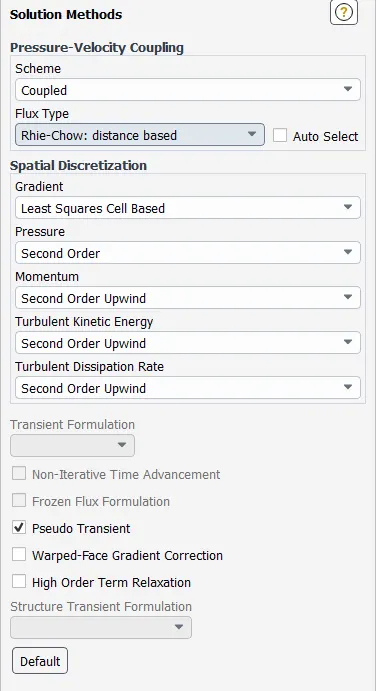
General`->` `->` Steady and gravity (y = - 9.81)
Physics`->` `->`Models`->``->`viscous`->``->` K-epsilon,RNG, check on the swirl dominated flow
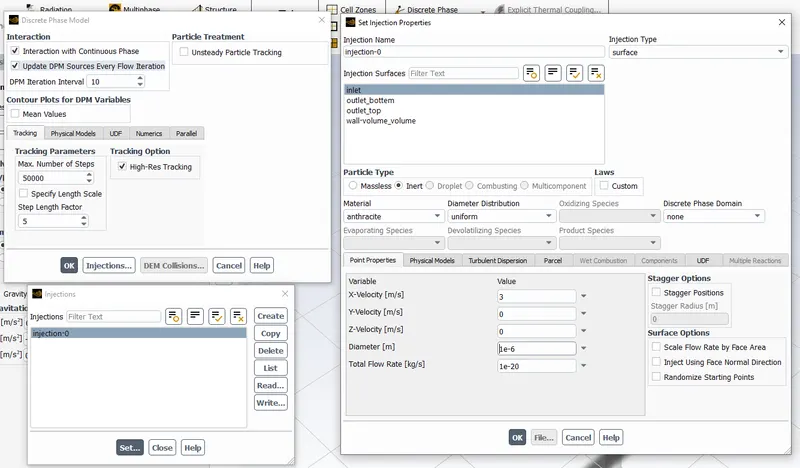
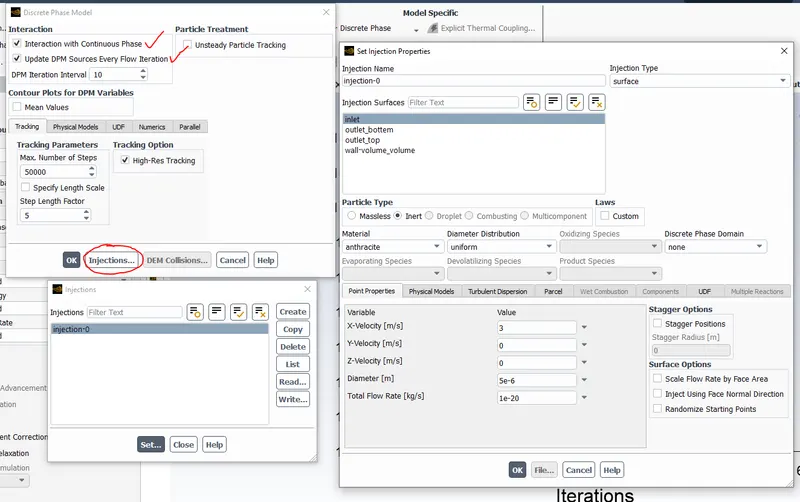
`->` `->`discrete phase
`->``->` Zones `->``->`Boundaries
Boundary Conditions:-
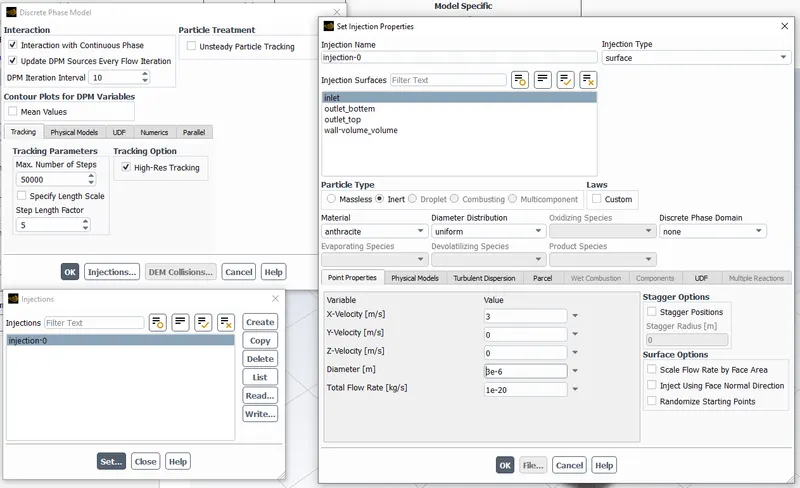
DPM
Inlet and wall:- Reflect and velocity 3 m/s
Outlet(Top):- Escape
Outlet(Bottom/dustbin) - Trap
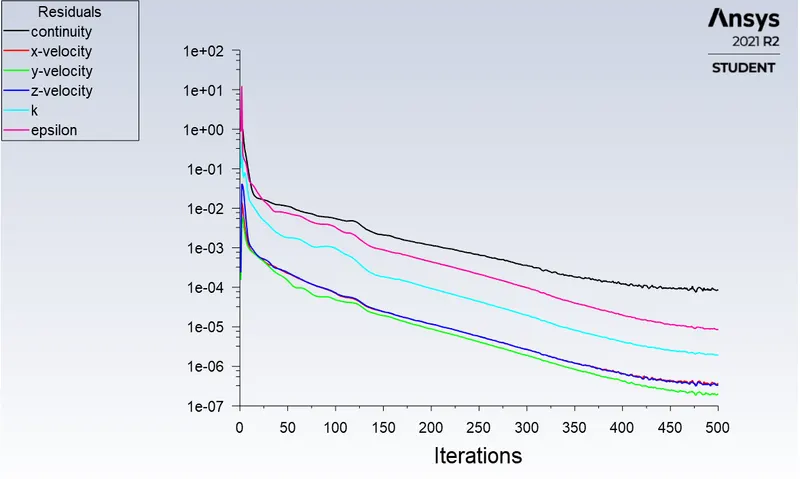
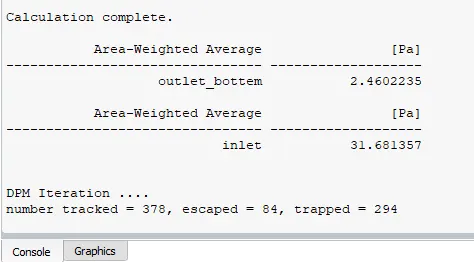
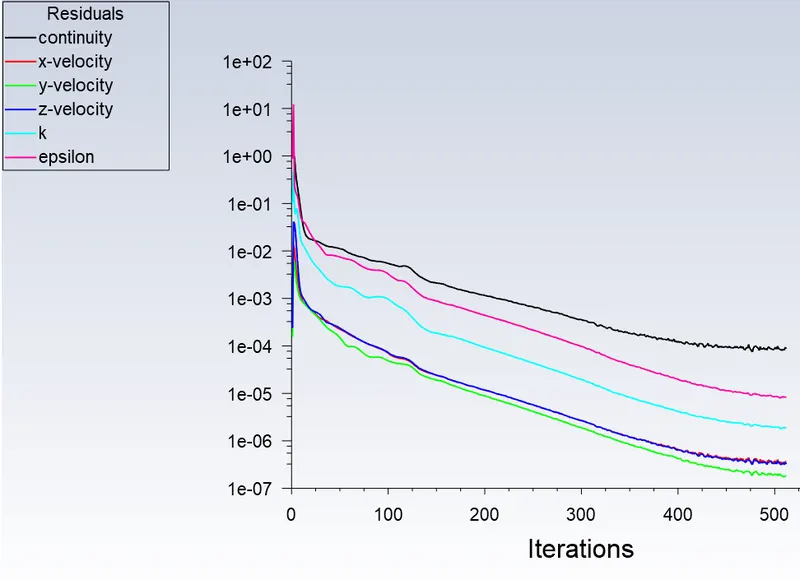
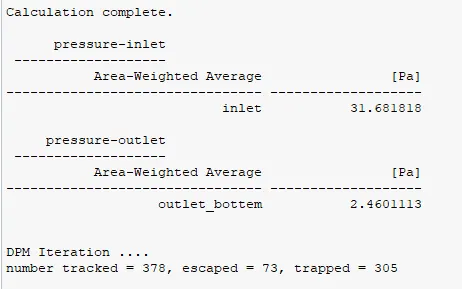
solution`->``->`Report definitions `->``->`area weighted average `->``->`calculate pressure for both inlet and outlet bottom
`->``->`Standard Initialization compute from inlet
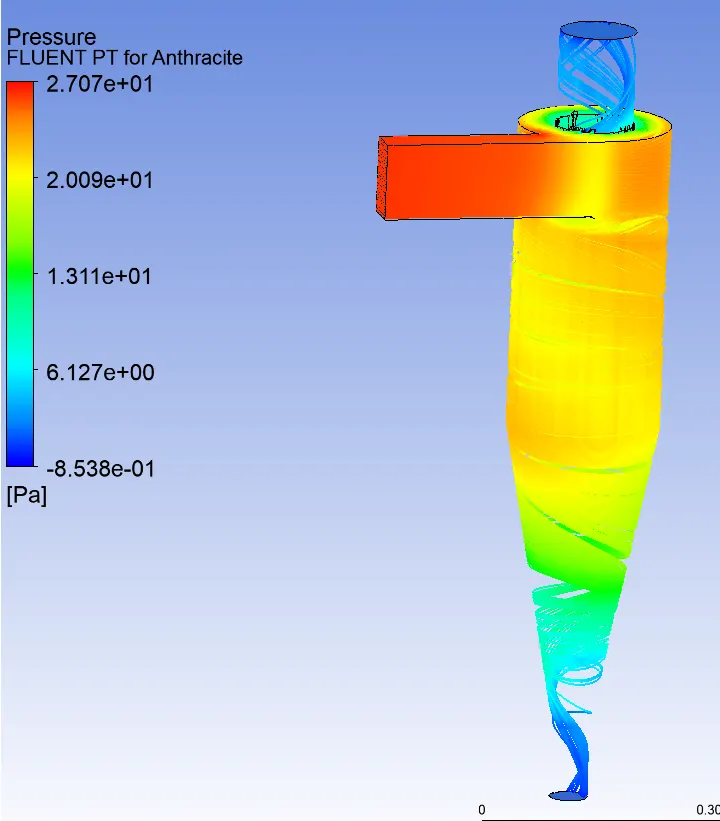
After simulation export the particle file and import in CFD post
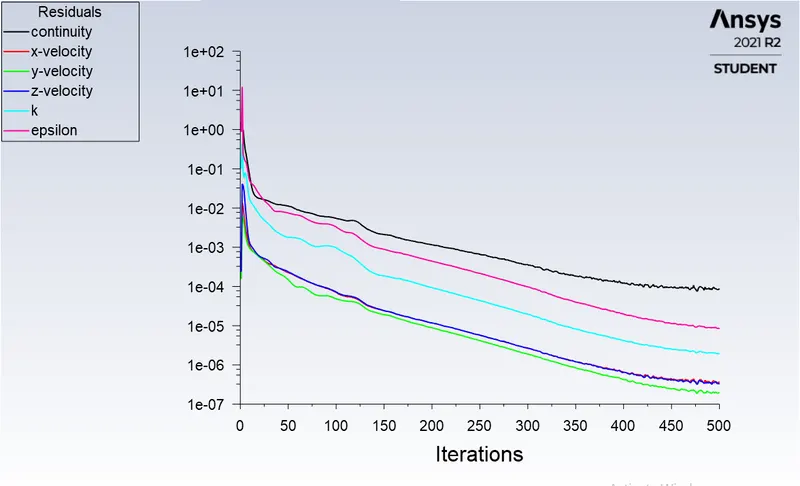
RESULTS:-
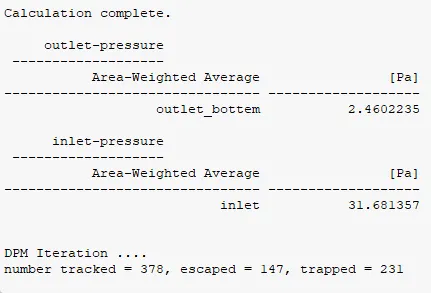
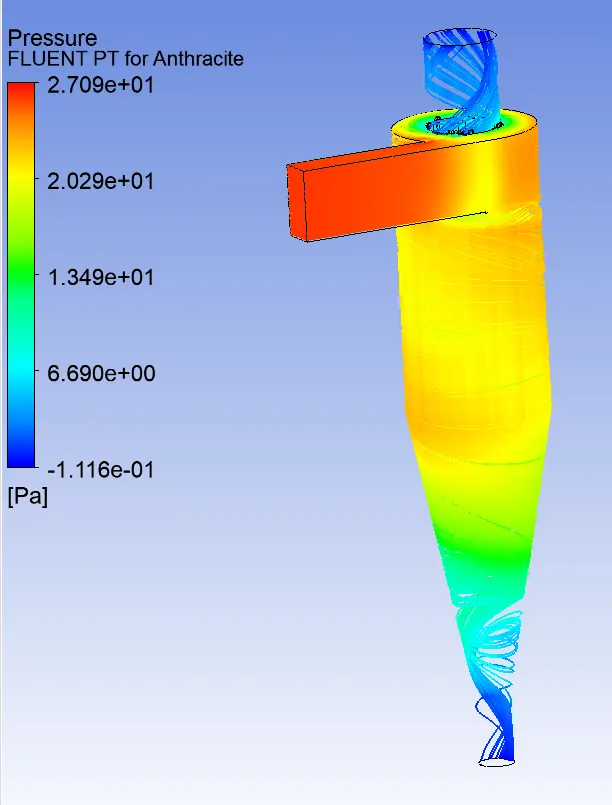
We can see the negative pressure below its because of the vortex created in the middle of the cyclone separator
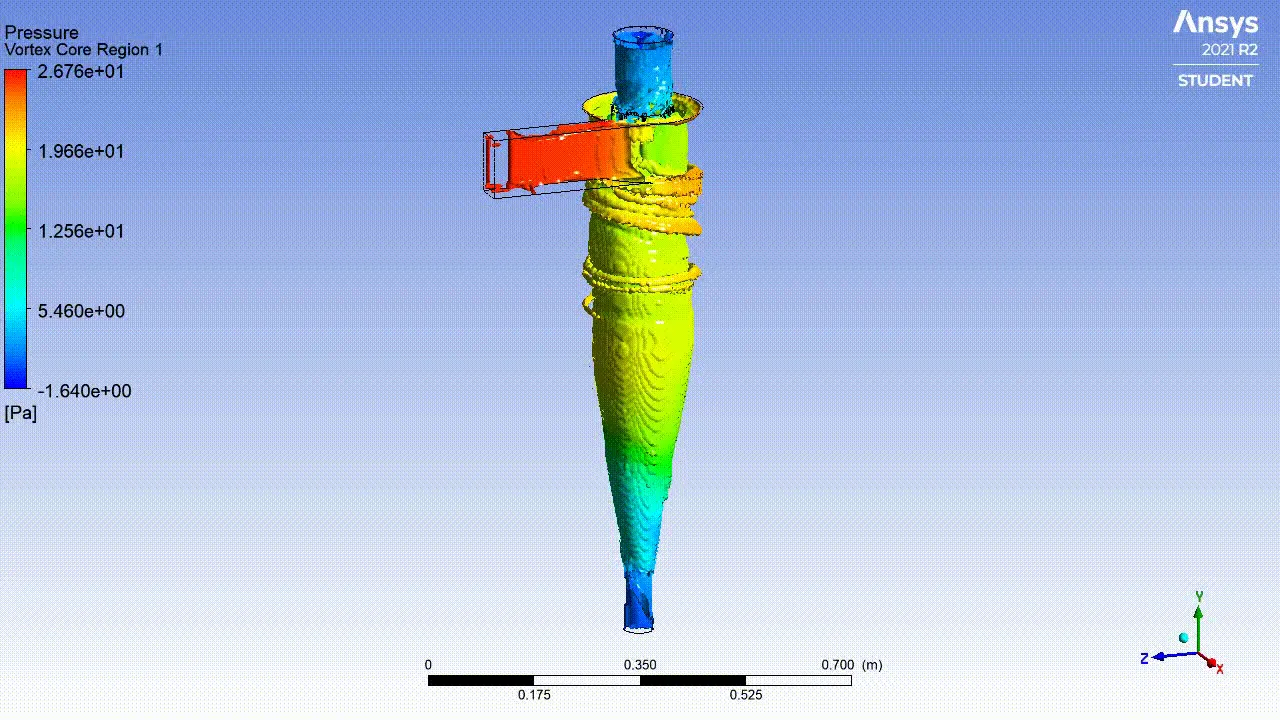
Vortex
In fluid dynamics, a vortex (plural vortices/vortexes) is a region in a fluid in which the flow revolves around an axis line, which may be straight or curved. Vortices form in stirred fluids and may be observed in smoke rings, whirlpools in the wake of a boat, and the winds surrounding a tropical cyclone, tornado, or dust devil.
Pressure in a vortex
The fluid motion in a vortex creates a dynamic pressure (in addition to any hydrostatic pressure) that is lowest in the core region, closest to the axis, and increases as one moves away from it, in accordance with Bernoulli's principle. One can say that it is the gradient of this pressure that forces the fluid to follow a curved path around the axis.
In a rigid-body vortex flow of a fluid with constant density, the dynamic pressure is proportional to the square of the distance r from the axis. In a constant gravity field, the free surface of the liquid, if present, is a concave paraboloid.
In an irrotational vortex flow with constant fluid density and cylindrical symmetry, the dynamic pressure varies as P∞ − K/r2, where P∞ is the limiting pressure infinitely far from the axis. This formula provides another constraint for the extent of the core, since the pressure cannot be negative. The free surface (if present) dips sharply near the axis line, with depth inversely proportional to r2. The shape formed by the free surface is called a hyperboloid, or "Gabriel's Horn" (by Evangelista Torricelli).
The core of a vortex in air is sometimes visible because water vapor condenses as the low pressure of the core causes adiabatic cooling; the funnel of a tornado is an example. When a vortex line ends at a boundary surface, the reduced pressure may also draw matter from that surface into the core. For example, a dust devil is a column of dust picked up by the core of an air vortex attached to the ground. A vortex that ends at the free surface of a body of water (like the whirlpool that often forms over a bathtub drain) may draw a column of air down the core. The forward vortex extending from a jet engine of a parked airplane can suck water and small stones into the core and then into the engine.
CASE2:-particle diameter 3 μm and particle velocity 3 m/sec
SETUP:-
RESULTS:-
CASE3:-particle diameter 5 μm and particle velocity 3 m/sec
SETUP:-
RESULTS:-
PART2-
Here we are going to vary the velocity with the same particle diameter
CASE1:-particle diameter 5 μm and particle velocity 1 m/sec
SETUP:-
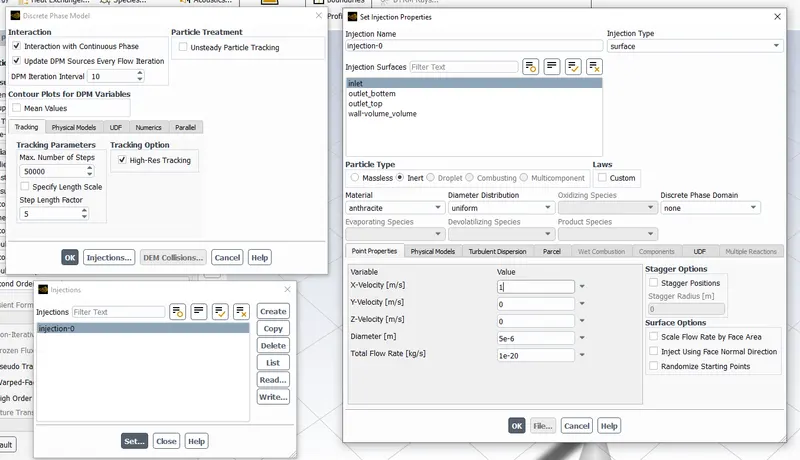
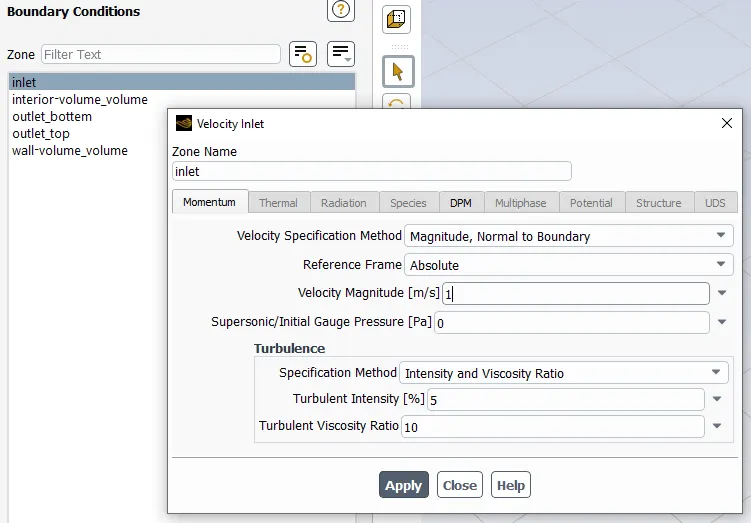
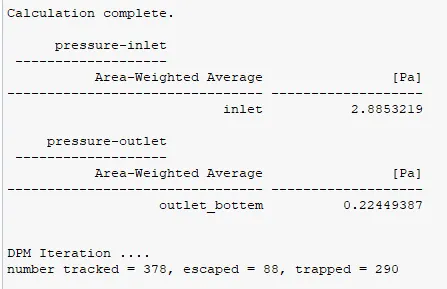
RESULTS:-
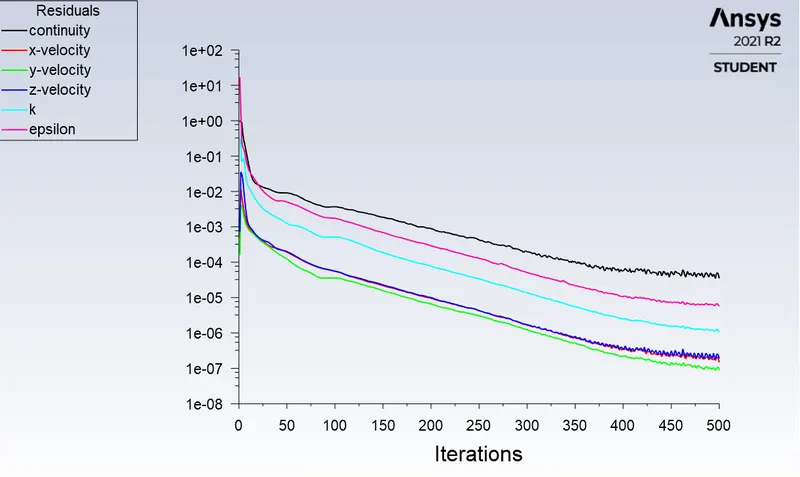
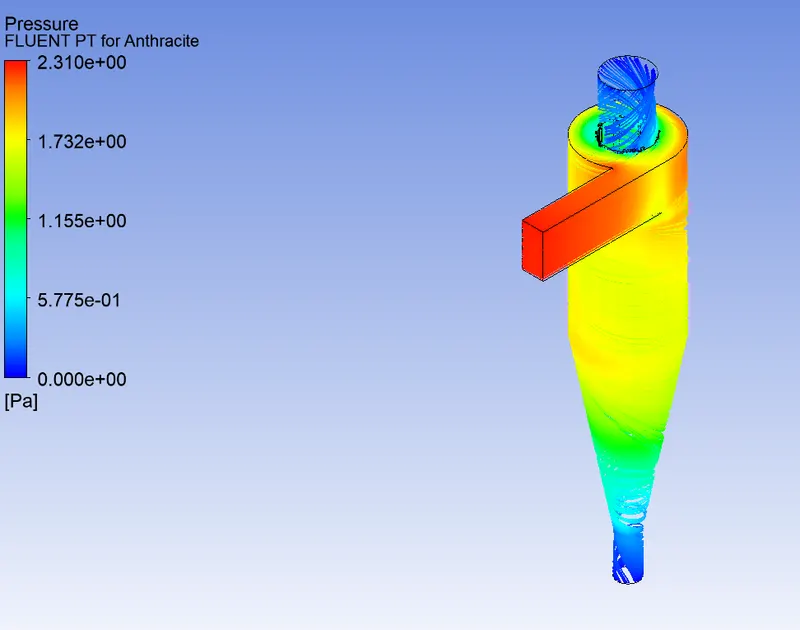
CASE2:-particle diameter 5 μm and particle velocity 3 m/sec
SETUP:-
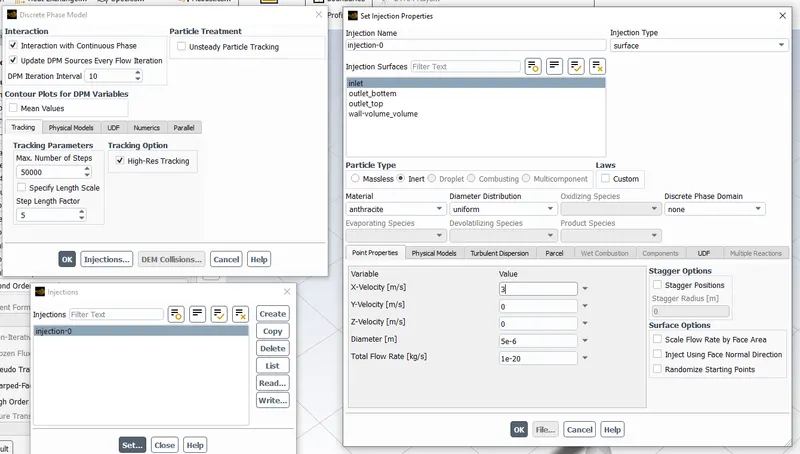
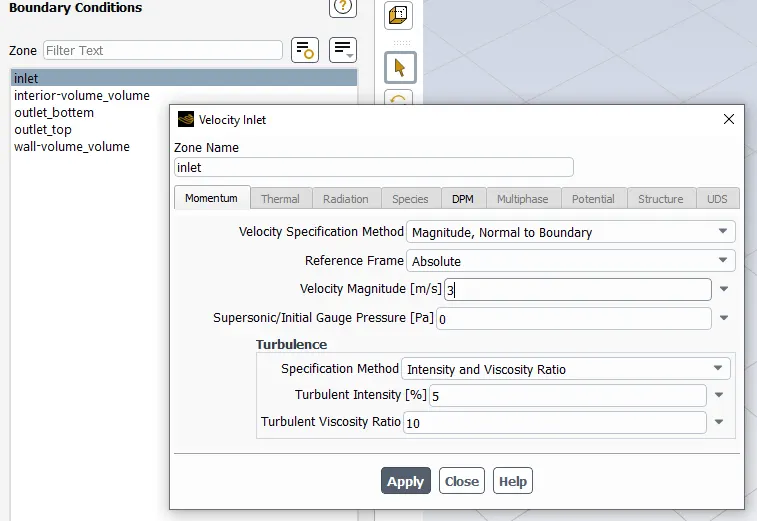
RESULTS:-
We can take the results from the PART1 CASE3 particle diameter 5 μm and particle velocity 3 m/sec
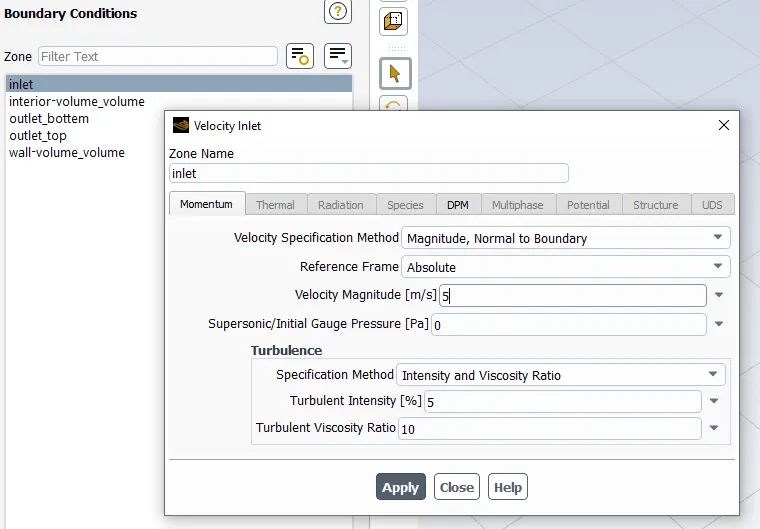
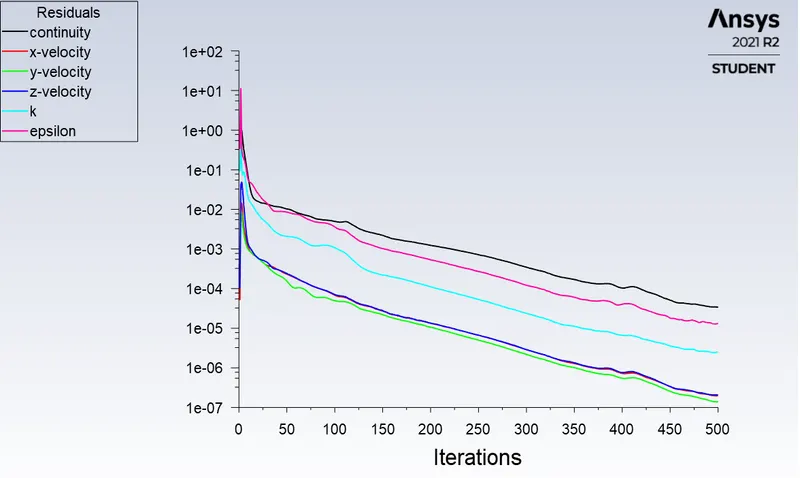
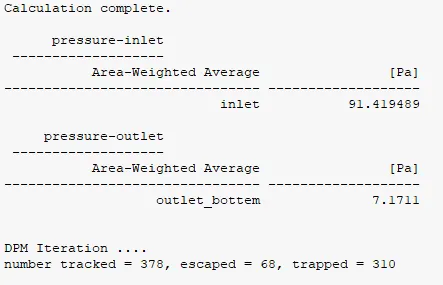
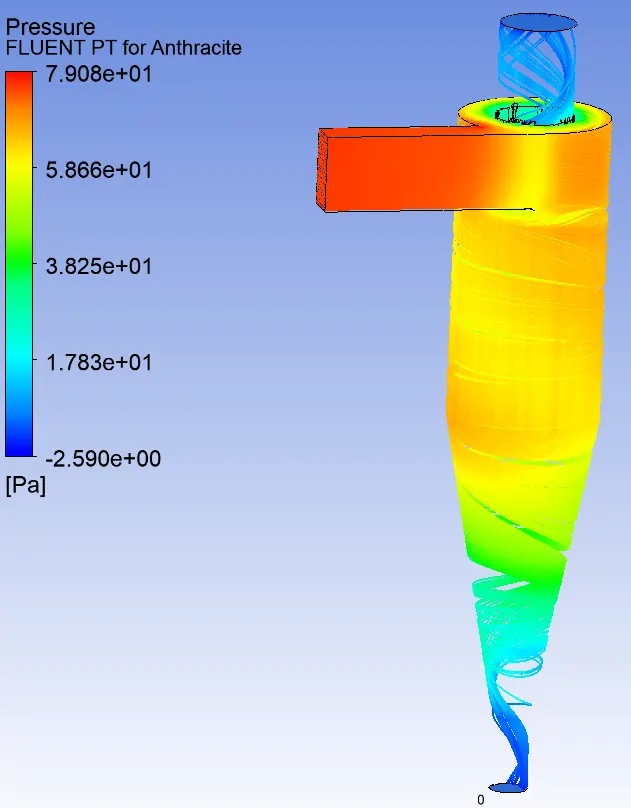
CASE3:-particle diameter 5 μm and particle velocity 5 m/sec
SETUP:-
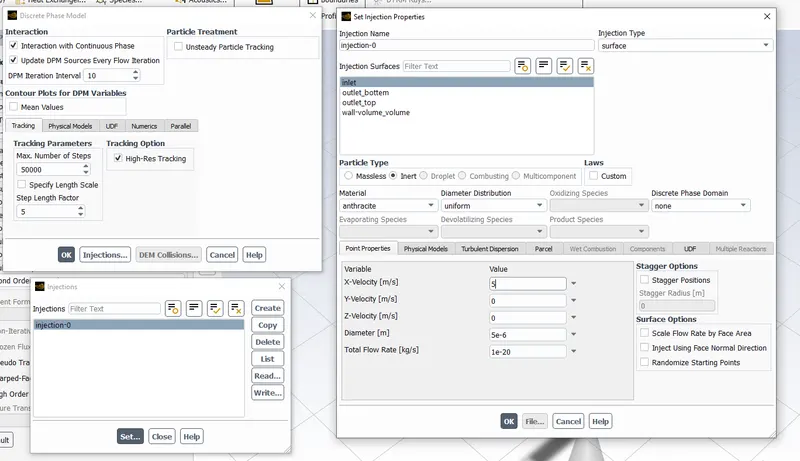
RESULTS:-
OBSERVATION:-
PART1:- vary in particle diameter with the same velocity
| Particle diameter | Number tracked | Escaped | Trapped | In-complete | Particle separation efficiency | Total pressure inlet[pa] | Total pressure outlet bottom[pa] | pressure drop | |
| CASE1 | `1 mum` | 378 | 147 | 231 | 0 | 61% | 31.68 | 2.46 | 29.22 (92%) |
| CASE2 | `3 mum` | 378 | 84 | 294 | 0 | 77% | 31.68 | 2.46 | 29.22 (92%) |
| CASE3 | `5 mum` | 378 | 73 | 305 | 0 | 80% | 31.68 | 2.46 | 29.22 (92%) |
Static pressure
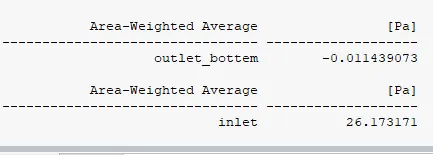
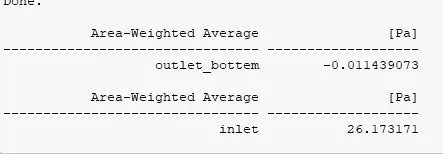
`1 mum` `3 mum`
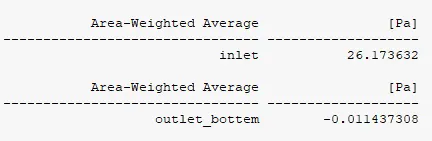
`5 mum`
There is an increase in efficiency to the increase in particle diameter and pressure drop remain same for all cases above
PART2:-vary in velocity with the same particle diameter
| Velocity m/s | Number tracked | Escaped | Trapped | In-complete | Particle separation efficiency | Total pressure inlet[pa] | Total pressure outlet bottom[pa] | pressure drop | |
| CASE1 | 1 | 378 | 88 | 290 | 0 | 76% | 2.88 | 0.22 | 2.66 (92%) |
| CASE2 | 3 | 378 | 73 | 305 | 0 | 80% | 31.68 | 2.46 | 29.22 (92%) |
| CASE3 | 5 | 378 | 68 | 310 | 0 | 82% | 91.41 | 7.17 | 84.24 (92%) |
Static pressure
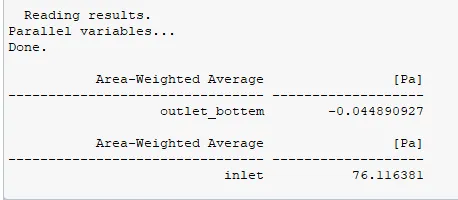
5 m/s 3 m/s
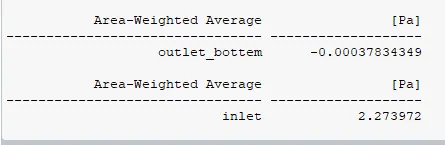
1 m/s
As we can see the change in the pressure in inlet and outlet with change in velocity and the percentage difference is the same in total pressure (static + dynamic pressure)
Whereas in static pressure We can see the pressure drop
| Velocity m/s | Static pressure inlet [pa] | Static pressure outlet [pa] | Pressure drop |
| 1 | 2.2739 | -0.00037 | 2.27427 |
| 3 | 26.1736 | -0.01143 | 26.1850 |
| 5 | 76.1163 | -0.04489 | 76.154 |
CONCLUSION:-
- For Increase in particle diameter there is an increase in efficency and pressure drop remain same
-
we can see the change in the pressure in the inlet and outlet with change in velocity and the percentage difference is the same in total pressure (static + dynamic pressure) Whereas the static pressure We can see the pressure drop more
- There are no incomplete particles in simulation it's because of the structural mesh