State of charge estimation
1. Simulate the 3 test cases from the harness dashboard and write a detailed report on the results
Lithium-ion battery packs are widely used energy storage systems in electric vehicles. The battery management system (BMS) is responsible for safe operations, performance, and battery life under diverse charge-discharge and environmental conditions. When designing a BMS the cell voltage and temperature, state of charge, state of health, and the charging profile have to be controlled and maintained.
Also, it indicates whether there has been a fault, for example, that any cell has reached an over-temperature condition or under-voltage condition.
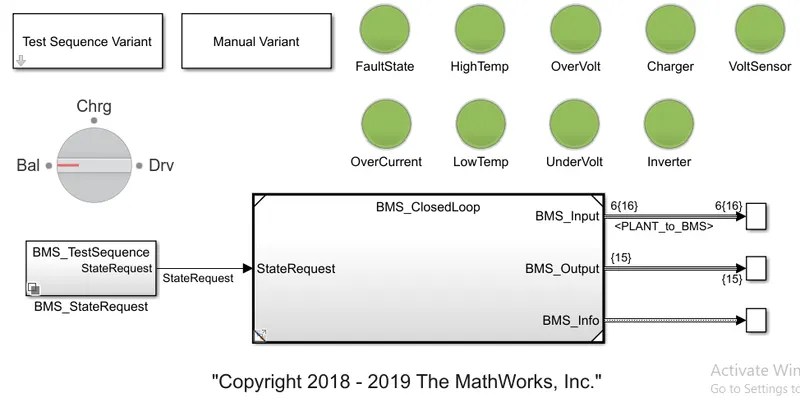
Through the harness dashboard model, we will see how the faults parameters can be indicated, and we can also get an insight of the BMS model and it also discusses the various subsystems used here.
The harness dashboard is shown below -
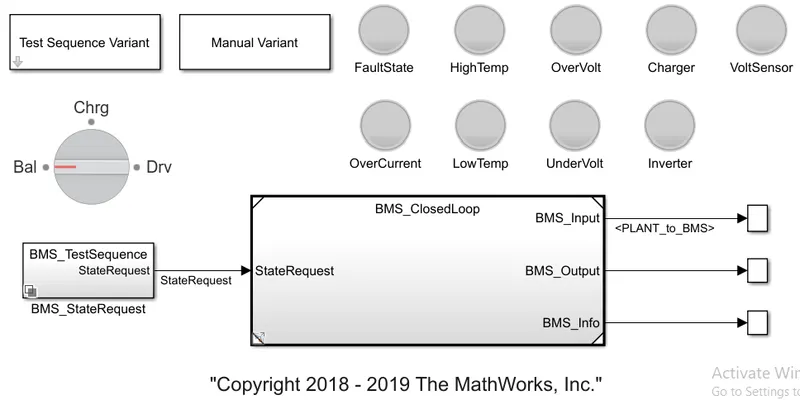
Now we run 3 test cases and comment on the results.
TEST - 1
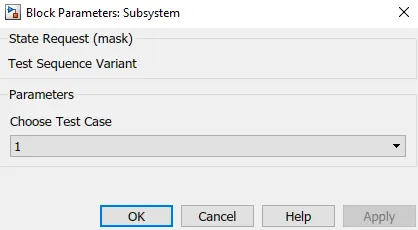
We select case 1 in the test sequence variant subsystem block as shown below.
The test-1 conditions are shown below.
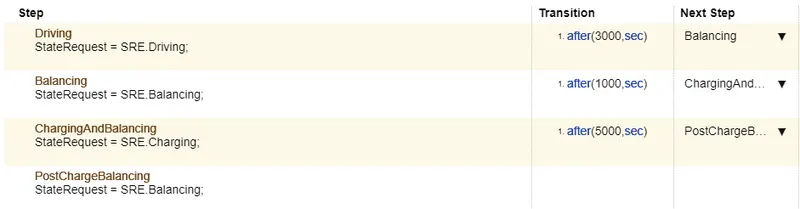
We can observe from the above table that the driving is done for 3000 seconds and then balancing will be done 1000 seconds after driving for 3000 seconds which is 4000 seconds, during which the vehicle is in standby mode. The next stage after balancing is charging, which takes 9000 seconds. Post-charge balancing is carried out till the simulation is completed.
We simulate selecting test-1 and obtain results as shown below.
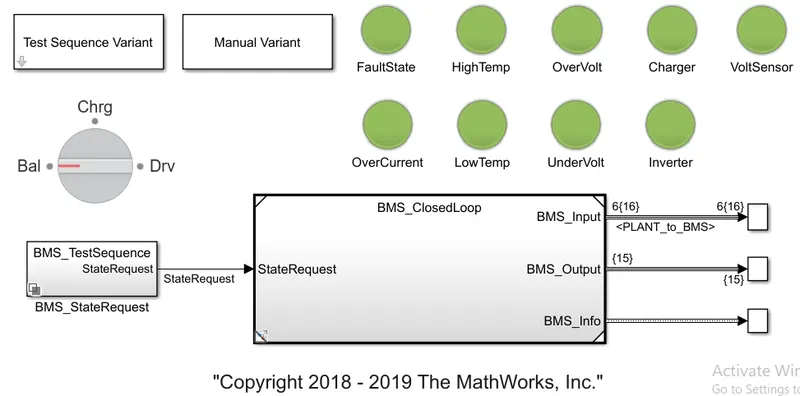
The scope results for test 1 is shown below:
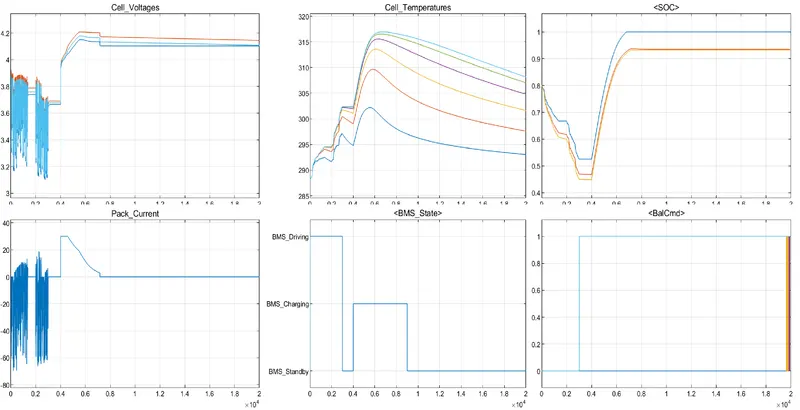
The above plots are explained below-
- The first plot shows us the cell voltages of each of the 6 cells. The fluctuating voltage between 3.2 and 3.7 is provided during the driving state time (between 0 and 3000 seconds), indicating that the nominal voltage was 3.7 and it decreased to 3.2 per cell. During the charging phase, it rises to 4.2 V (between 4000 to 9000 seconds). The fully charged voltage of the battery is 4.2. As the BMS will be in standby mode for the rest of the simulation, the voltages will not diminish.
- The entire battery pack's current trend is shown in the second plot. As the battery loses current when driving, it is displayed in the negative direction (till -60A). The current rises to 30A during charging and then drops to 0 during standby.
- The third plot shows the trend of the battery pack's cell temperatures, which range from 290K to 315K. The temperature of the cells rises during battery depletion and gradually drops during charging and standby mode. We can observe that the sixth cell has the highest temperature, indicating that it is discharged the most.
- The BMS states are depicted in the fourth plot. As previously stated, the driving time ranged from 0 to 3000 seconds, the charging time ranged from 4000 to 9000 seconds, and the standby time ranged from 9000 to 20000 seconds.
- The SOC trend is shown in the fifth plot. The SOC rapidly decreases to 0.45 during driving and fully charging back to 100% charging. In standby mode, the SOC will not change.
- The cell balancing signals are shown in the sixth plot. From the sixth cell of the battery pack to the first cell, the balancing of cells is presented in descending sequence. The temperature block in the cell confirms this.
TEST - 2
We select case 2 in the test sequence variant subsystem block as shown below.
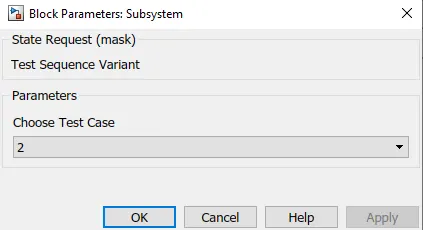
The test-2 conditions are shown below.

In test 2, the driving state will be maintained for 10000 seconds. The charging operation begins next.
We simulate selecting test-2 and obtain results as shown below.
The scope results for the second test are shown below.
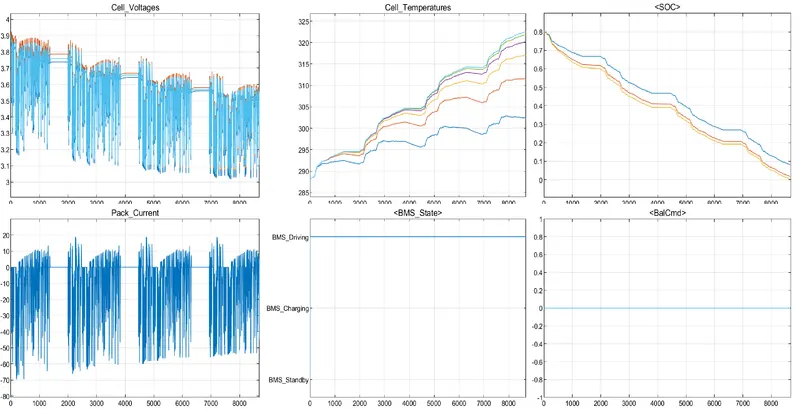
The above plots are explained in the following points.
- The BMS enters a driving mode in this second situation until the battery pack's SOC is depleted. The battery pack discharges current for 8692 seconds as seen in the graph. We may deduce that the battery pack lasts only 8962 seconds on a single charge. Here, there is no charging or standby mode. The vehicle continues to run until the battery pack is entirely depleted.
- The voltages range from 3.7 to 3V. This 3V is the individual cell's cutoff voltage. The battery pack can discharge up to 60A of electricity, which is its maximum capacity.
- The temperature of the cells continues to rise as a result of the constant discharge of current.
- The SOC continues to fall until it hits 0%, as the battery has not been charged or put in standby mode.
- Cell balancing is not performed while charging. The cells have been discharged evenly until they are shut off, hence there is no cell balancing signal.
- Using this sort of case scenario will allow us to better grasp the battery's endurance and life duration.
TEST - 3
We select case 3 in the test sequence variant subsystem block as shown below.
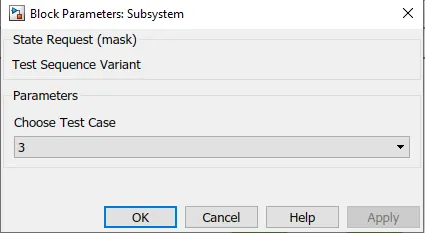
The test-3 conditions are shown below.

There is just one BMS state shown in the above table, which is charging. The charging of the vehicle takes place from 0 to 20000 seconds.
We simulate selecting test-3 and obtain results as shown below.
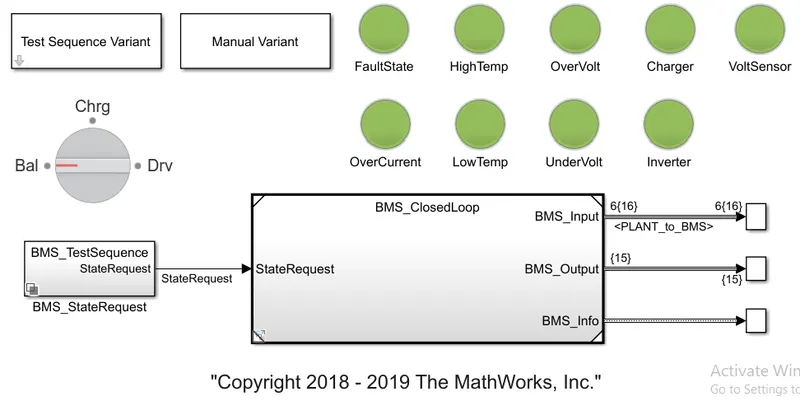
The scope results for the third test are shown below.
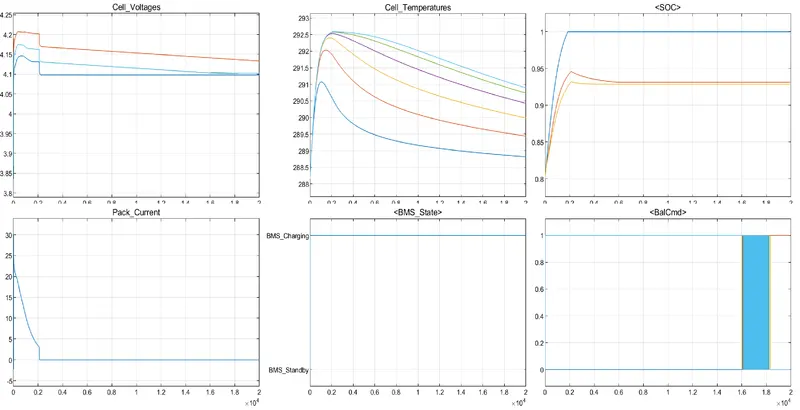
The above plots are explained in the following points.
- The charging condition will be maintained throughout the simulation. There is no driving or standby state in this test. The SOC was set to 80% at the beginning and then the pack was fully charged.
- After the completion of charging, the pack current increased to 30A and then decreased to 0. The in-rush current is limited by the contactor circuits. After being fully charged, the battery can no longer take current.
- The voltage of a fully charged cell ranges between 4 and 4.2V.
- The cell temperatures are also higher at first due to the initial charging current , but then will be quickly stabilized with the help of the contactors.
- According to the plot, the balancing orders were followed from the sixth cell to the first cell.
The BMS model was thoroughly examined and 3 separate test case situations were run in the closed-loop harness test whose results are discussed in detail.
2. What is coulomb counting? Refer to the above model and explain how BMS implements coulomb counting for SOC estimation?
SOC stands for the state of charge of a battery. SOC represents the amount of energy left inside the battery concerning the total amount of energy left inside the battery concerning the total amount of energy in a battery at the fully charged condition. SOC can help a user determine when to charge the battery at that time. There is no direct method to calculate SOC for a Li-ion battery but there are several ways in which we can calculate SOC with the help of some additional parameters.
The easiest method to calculate the SOC of a battery is by using a battery voltage translation method. This method is not accurate but helps to approximately and quickly calculate SOC and can be used in devices like power banks where SOC is shown in range and not the exact percentage. For example, a typical power bank shows SOC in the range from 0-25%, 25-50%, 50-75%, 75-100%.
There are several limitations to this method and hence more accurate methods are needed like the Coulomb counting method. The fuzzy logic method, the Kalman filter, the RBF Neural network, the Fuzzy neural network, the hybrid methods, etc.
Each method has its limitations, accuracy, and complexity and hence proper decision should be made while selecting methods for SOC estimation. A few indirect methods have been discovered to measure the SOC:
- Chemical method: applicable only to cells that give open access to their electrolytes (non-sealed lead-acid batteries for instance). The SOC can be measured from the specific gravity (hydrometer) or the electrolyte's pH (pH meter).
- Voltage method: measures the present voltage of the battery to find its SOC using the discharge characteristics of the voltage Vs SOC. Not a preferred method because temperature variations are not accounted for in this method which causes the terminal voltage of a cell to vary from its OCV.
COULOMB COUNTING METHOD:
The coulomb counting method is also known as the battery current integration method. In this method, a discharging/charging current is measured and integrated over time to calculate the amount of energy remaining inside the battery. In this method, SOC is taken at the previous step SOC(t-1) and the amount of energy removed/added at the current time step is subtracted/added from the SOC of the previous time step SOC(t-1) to obtain the amount of energy present in the battery at the present instant.
The SOC estimation in the Coulomb counting method is done using the below equation,

`SOC(t-1)=SOC` at previous time-step
`eta`=efficiency
`t`=current time-step
`t-1`=previous time-step
`Q`=Charge capacity of the battery
This method is accurate and reliable than the voltage translational method but does not take into account the discharge rate, temperature, hysteresis, age of the battery, etc.
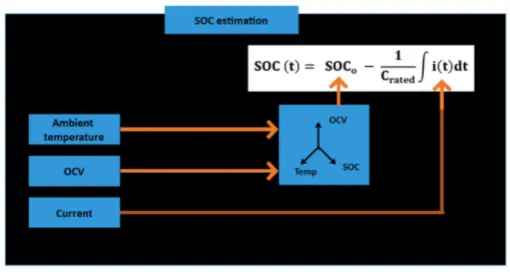
The above is a generalized form of how a BMS works for SOC estimation. Depending on the method used for SOC estimation various parameters are taken as input by the BMS. These parameters are used further to calculate the SOC using various relations as per the method and SOC is given at the output. In our case, the temperature is not needed since the Coulomb counting method is independent of the working temperature of the battery.
To compute the estimated SOC of the BMS, we must insert the plant block into this model, which incorporates BMS ECU, and PLANT.
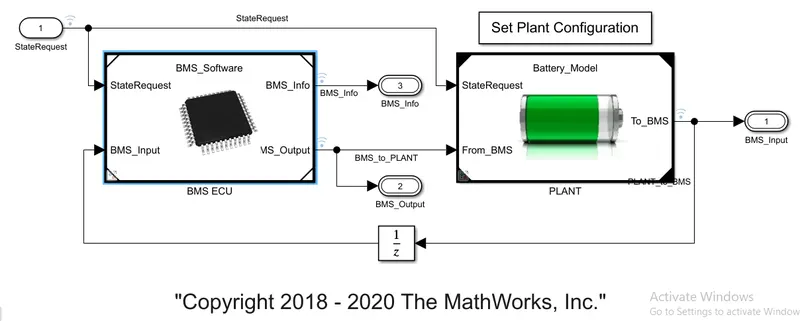
We require an accurate estimate of the battery SOC before we charge the car. In the plant block, we don't assess the state of charge; instead, we measure things like battery pack current, cell voltage, and cell voltage signals using signals from the BMS block. After entering the BMS ECU block, we can see the state machine, SOC estimation, and balancing logic block. In this section, we will look into the SOC estimates.
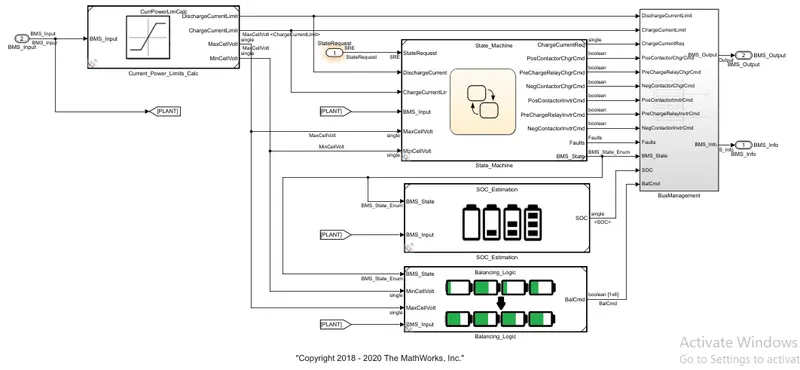
When we go into the SOC estimation block, we can find a subsystem as shown below.
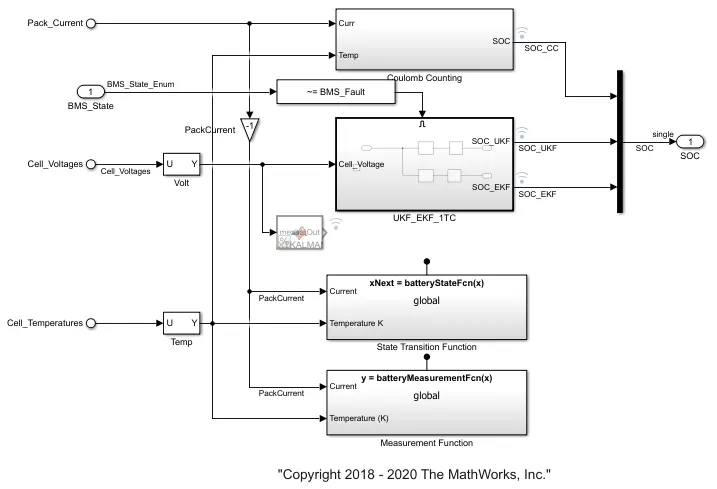
Three distinct states of charge estimating strategies are shown in this SOC estimate block. Each strategy has its own set of benefits and drawbacks. Coulomb counting is the first approach, while unscented(ukf) and extended Kalman filter are the other two (ekf). We are talking about the Coulomb counting approach here.
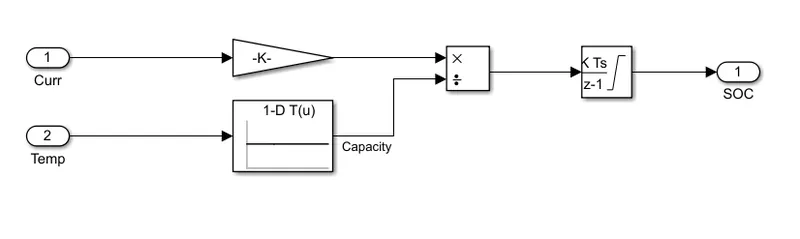
In the Coulomb counting method block, it accepts 2 input signals, current, and temperature, with the current signal going to the gain block and the temperature signal going to the battery time and current lookup tables. Both blocks are linked to the split block, and these signals are sent to the discrete-time integrator to track the change, which then aids in the calculation of the state of charge.
The positives of this are its simplicity and cheap capital cost, while the disadvantage includes a buildup of current sensor error and its inability to recover from the erroneous state condition, due to a lack of voltage measurement feedback.
One of the most difficult aspects of coulomb counting is calibrating the initial battery SOC. In various applications, rest is required for startup, and the initial SOC is calculated using the voltage. Kalman filtering is a technique for estimating unknown variables based on observations collected over time.