PARSING NASA THERMODYNAMIC DATA, CALCULATING THE MOLECULAR WEIGHT AND PLOTTING THE T-Cp, T-H, AND T-S DIAGRAMS FOR ALL THE ELEMENTS IN THE DATA FILE
AIM -
1. Write a function that extracts the 14 coefficients and calculates the enthalpy, entropy, and specific heats for all the species in the given data file.
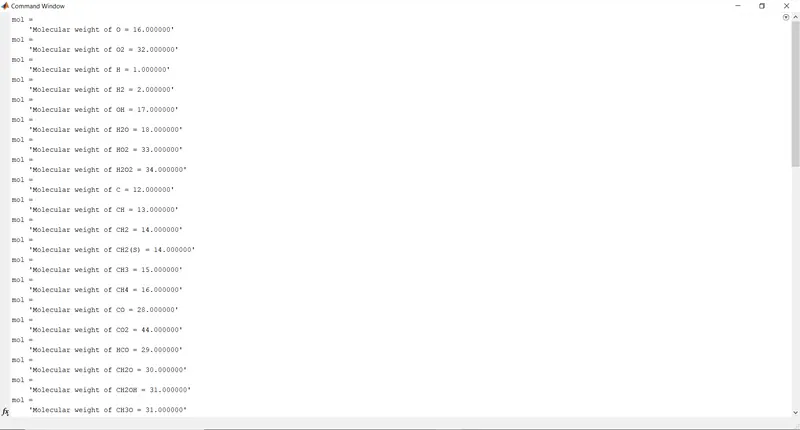
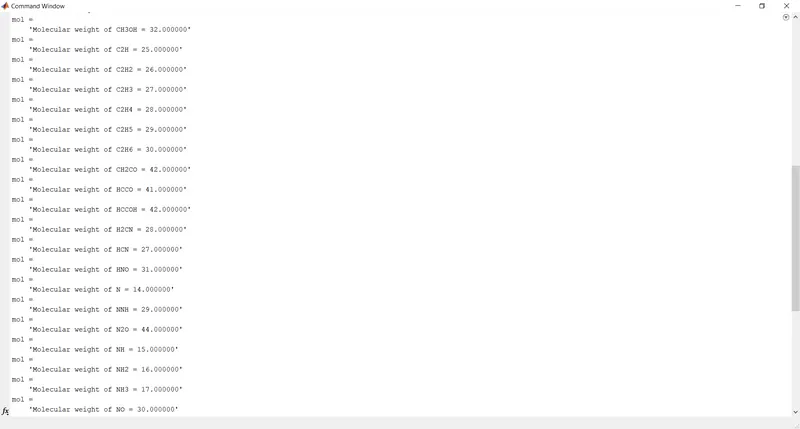
2. Calculate the molecular weight of each species and display it in the command window.
3. Plot the Cp, Enthalpy, and Entropy for the local temperature range (low temperature: high temperature) specific for each species.
4. Save the plots as images with appropriate names and dump them in separate folders for each species with a suitable name. All of these should be generated automatically.
THEORY -
Before writing the program, we should be familiar with the basic concepts.
SPECIFIC HEAT -
The specific heat of a substance is defined as the amount of heat required to raise a unit mass of the substance through a unit rise in temperature. The heat capacity is an extensive property that describes how much heat energy it takes to raise the temperature of a given system. However, it would be pretty inconvenient to measure the heat capacity of every unit of matter. What we want is an intensive property that depends only on the type and phase of a substance and can be applied to systems of arbitrary size. This quantity is known as the specific heat capacity. Experiments show that the transferred heat depends on three factors: 1) The change in temperature, 2) the mass of the system, 3) the substance and phase of the substance.
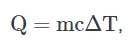
where Q is the symbol for heat transfer, m is the mass of the substance, and `DeltaT` is the temperature change. The symbol c stands for specific heat and depends on material and phase.
The specific heat is the amount of heat necessary to change the temperature of 1 kg of mass by 1-degree celsius. Its SI unit is J/(kg. K). The total heat capacity C is simply the product of the specific heat capacity c and the mass of the substance m.
ENTHALPY -
The enthalpy of a substance, h, is defined as h= u + pv.
u is the internal energy, p and v being the pressure and volume of the system. The state of a gas is defined by several properties including the temperature, pressure, and volume which the gas occupies. From a study of the first law of thermodynamics, we find the internal energy of a gas is also a state variable, that is, a variable that depends only on the state of the gas and not on any process that produced that state. For a gas, an additional state variable is the enthalpy which is defined to be the sum of the internal energy u plus the product of pressure p and volume v. The enthalpy can be made into an intensive or specific variable by dividing by the mass
ENTROPY -
Generally, entropy is defined as a measure of randomness or disorder of a system. This concept was introduced by a German physicist named Rudolf Clausius in the year 1850. From a thermodynamic viewpoint, entropy is used to describe the behavior of a system in terms of thermodynamic properties such as temperature, pressure, and heat capacity. This thermodynamic description takes into consideration the state of equilibrium of the systems. its SI unit is J/K. Entropy is an extensive property which means that it scales with the size or extent of a system.
The greater disorder will be seen in an isolated system, hence entropy also increases. When chemical reactions take place, if the reactants break into more number of products, entropy also gets increased. A system at higher temperatures has greater randomness than a system at a lower temperature. From these examples, it is clear that entropy increases with a decrease in regularity.
The change in entropy can be formulated as below -
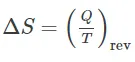
where `DeltaS` is the change in entropy, Q is the heat transfer, which is positive for heat transfer into and negative for heat transfer out of, and T is the absolute temperature at which the reversible process takes place.
NASA came up with polynomials that can be used to evaluate thermodynamic properties such as Cp, H, and S. They have also documented the coefficients that are required to evaluate these polynomials for 1000+ species.
The formulae for the same has been mentioned below, where R is the universal gas constant and T is the temperature
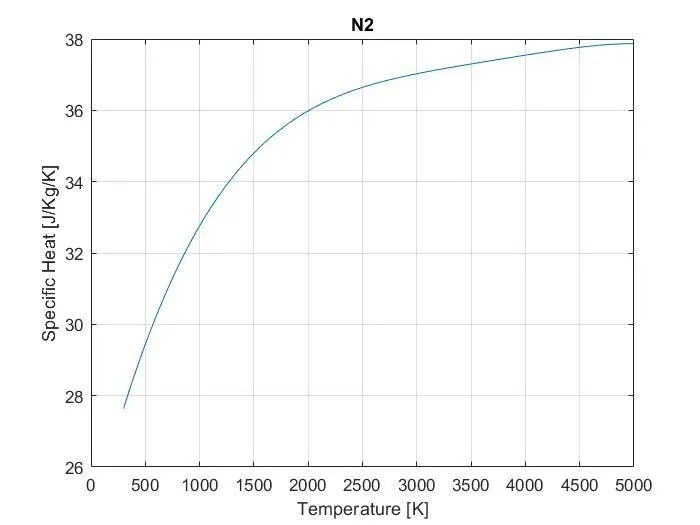
Cp/R = a1 + a2*T + a3*T^2 + a4*T^3 + a5*T^4
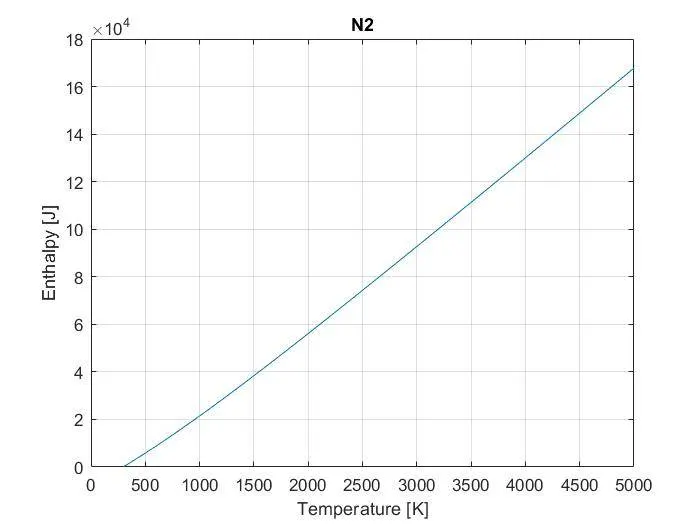
H/RT = a1 + a2*T/2 + a3*T^2/3 + a4*T^3/4 + a5*T^4/5 + a6/T
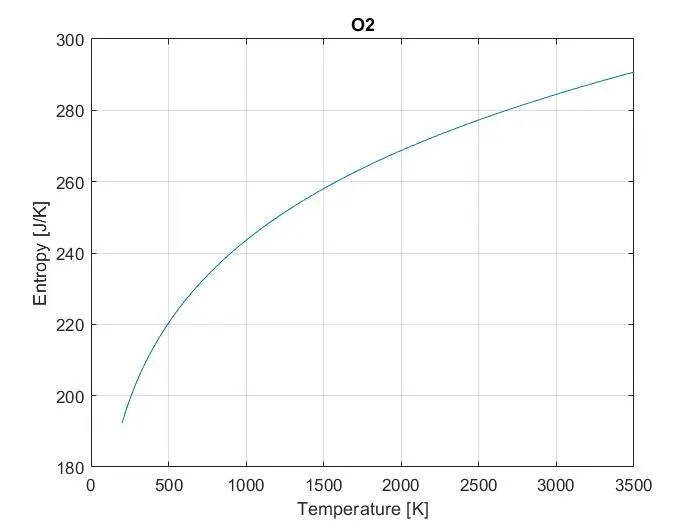
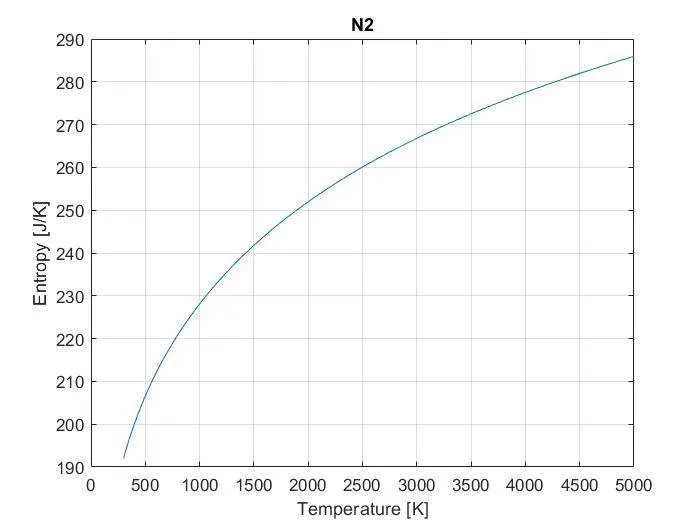
S/R = a1lnT + a2*T + a3*T^2/2 + a4*T^3/3 + a5*T^4/4 + a7
The first 7 coefficients are high-temperature coefficients and the second 7 coefficients are low-temperature coefficients in the data file provided. So we will be using the above relations derived by NASA in our code to attain the T-Cp diagram, T-H diagram, T-S diagram of all the elements in the data file.
Also, we need to calculate the molecular weight of each of those elements.
MOLECULAR WEIGHT -
Molecular weight is a measure of the sum of the atomic weight values of the atoms in a molecule. Molecular weight is used in chemistry to determine stoichiometry in chemical reactions and equations. Both atomic weight and molecular weight are defined relative to the mass of the isotope carbon -12, which is assigned a value of 12 amu. The reason the atomic weight of carbon is not precisely 12 is that it is a mixture of isotopes of carbon.
The following syntaxes are used while writing the program and is explained below -
tline = fgetl(fileID)It returns the next line of the specified file, removing the newline characters.
-
If the file is nonempty, then
fgetlreturnstlineas a character vector. -
If the file is empty and contains only the end-of-file marker, then
fgetlreturnstlineas a numeric value-1.
C = strsplit(str)
C = strsplit(str,delimiter)
C = strsplit(str,delimiter,Name,Value)
C = strsplit(str) splits str at whitespace into C. A whitespace character is equivalent to any sequence in the set {' ','f','n','r','t','v'}.
If str has consecutive whitespace characters, then strsplit treats them as one whitespace.
C = strsplit(str,delimiter) splits str at the delimiters specified by delimiter.
If str has consecutive delimiters, with no other characters between them, then strsplit treats them as one delimiter.
C = strsplit(str,delimiter,Name,Value) specifies additional delimiter options using one or more name-value pair arguments.
X = str2num(chr)X = str2num(chr) converts a character array or string scalar to a numeric matrix. The input can include spaces, commas, and semicolons to indicate separate elements. If str2num cannot parse the input as numeric values, then it returns an empty matrix.
k = findstr(str1, str2)k = findstr(str1, str2) searches the longer of the two input arguments for any occurrences of the shorter argument, returning the starting index of each such occurrence in the double array k. If no occurrences are found, then findstr returns the empty array, []. The input arguments str1 and str2 can be character vectors or string scalars.
The search performed by findstr is case sensitive. Any leading and trailing blanks in either input argument are explicitly included in the comparison.
tf = strcmp(s1,s2)tf = strcmp(s1,s2) compares s1 and s2 and returns 1 (true) if the two are identical and 0 (false) otherwise. Text is considered identical if the size and content of each are the same. The return result tf is of data type logical. The input arguments can be any combination of string arrays, character vectors, and cell arrays of character vectors.
mkdir folderName
mkdir parentFolder folderName
mkdir folderName creates the folder folderName. If folderName exists, MATLAB issues a warning. If the operation is not successful, mkdir throws an error to the Command Window.
mkdir parentFolder folderName creates folderName in parentFolder. If parentFolder does not exist, MATLAB attempts to create it.
cd
cd newFolder
oldFolder = cd(newFolder)
cd displays the current folder.
cd newFolder changes the current folder to newFolder. Folder changes are global. Therefore, if you use cd within a function, the folder change persists after MATLAB finishes executing the function.
oldFolder = cd(newFolder) returns the existing current folder to oldFolder, and then it changes the current folder to newFolder.
saveas(fig,filename)
saveas(fig,filename,formattype)
saveas(fig,filename) saves the figure or Simulink block diagram specified by fig to file filename. Specify the file name as a character vector or string that includes a file extension.
saveas(fig,filename,formattype) creates the file using the specified file format, formattype. If you do not specify a file extension in the file name, for example, 'myplot'then the standard extension corresponding to the specified format automatically appends to the file name. If you specify a file extension, it does not have to match the format. saveas uses formattype for the format, but saves the file with the specified extension. Thus, the file extension might not match the actual format used.
After understanding and using the above concepts, we write the required program.
The code is shown below. Every step has been explained in the program
%To write a code to parse the data from the file 'THERMO.dat' and use the
%information to solve the equations of Cp, H, and S formulated by NASA
%To plot T-Cp, T-H, T-S diagrams for all the elements listed in the file
%To calculate the molecular weight of the elements listed in the file and
%to print the same in the command window

clear all
close all
clc

%Reading the header information from THERMO.dat
thermo_data = fopen('THERMO.dat','r');
Header=fgetl(thermo_data);

%To read and store the global temperature values using str2num
line_2=fgetl(thermo_data);
global_temps=strsplit(line_2,' ');

global_t1=str2num(global_temps{2});
global_t2=str2num(global_temps{3});
global_t3=str2num(global_temps{4});

%Ignoring the next 3 lines
line_3=fgetl(thermo_data);
line_4=fgetl(thermo_data);
line_5=fgetl(thermo_data);

%Parsing the species block
%Getting the element name and local temperatures of the elements
for i=1:53
    element_line_1=fgetl(thermo_data);
    local_temps=strsplit(element_line_1,' ');

    %Storing the names of each element name from the data
    element_name=local_temps{1};

    %Storing the local temperatures of the elements from the file
    z=length(local_temps);
    local_t1=str2num(local_temps{z-3});
    local_t2=str2num(local_temps{z-2});
    local_t3=str2num(local_temps{z-1});

    %To read and store a1-a5 coefficients of the elements
    element_line_2=fgetl(thermo_data);
    a=findstr(element_line_2,'E');

    a1=element_line_2(1:a(1)+3);
    a1=str2num(a1);

    a2=element_line_2(a(1)+4:a(2)+3);
    a2=str2num(a2);

    a3=element_line_2(a(2)+4:a(3)+3);
    a3=str2num(a3);

    a4=element_line_2(a(3)+4:a(4)+3);
    a4=str2num(a4);

    a5=element_line_2(a(4)+4:a(5)+3);
    a5=str2num(a5);

    %To read and store a6-a10 coefficients of the elements
    element_line_3=fgetl(thermo_data);
    b=findstr(element_line_3,'E');

    a6=element_line_3(1:b(1)+3);
    a6=str2num(a6);

    a7=element_line_3(b(1)+4:b(2)+3);
    a7=str2num(a7);

    a8=element_line_3(b(2)+4:b(3)+3);
    a8=str2num(a8);

    a9=element_line_3(b(3)+4:b(4)+3);
    a9=str2num(a9);

    a10=element_line_3(b(4)+4:b(5)+3);
    a10=str2num(a10);

    %To read and store a10-a14 coefficients of the elements
    element_line_4=fgetl(thermo_data);
    c=findstr(element_line_4,'E');

    a11=element_line_4(1:c(1)+3);
    a11=str2num(a11);

    a12=element_line_4(c(1)+4:c(2)+3);
    a12=str2num(a12);

    a13=element_line_4(c(2)+4:c(3)+3);
    a13=str2num(a13);

    a14=element_line_4(c(3)+4:c(4)+3);
    a14=str2num(a14);

    %To calculate the values of Cp(Specific heat), H(Enthalpy), and S(Entropy) for each of the elements
    %Universal Gas Constant, R = 8.314Jmol^-1K^-1
    %Also, as we need to plot a graph of the above parameters wrt to
    %temperature, we will be needing more values
    T=linspace(local_t1,local_t2,1000);
    R=8.314;

    for j=1:length(T)

        %Considering the low and high-temperature coefficients, we find the parameter
        %values of the low-temperature and high-temperature range
        if T1

            %To calculate the final molecular weight including all the
            %extra elements in the compound
            mol_wt=mol_wt+atomic_wt(position)*(n-1);

        end
    end

    %To print the molecular weight of the element as asked
    mol=sprintf('Molecular weight of %s = %f',element_name,mol_wt)

end
ERRORS -
1. The below error stating 'Index exceeds the number of array elements (6), line 141'.
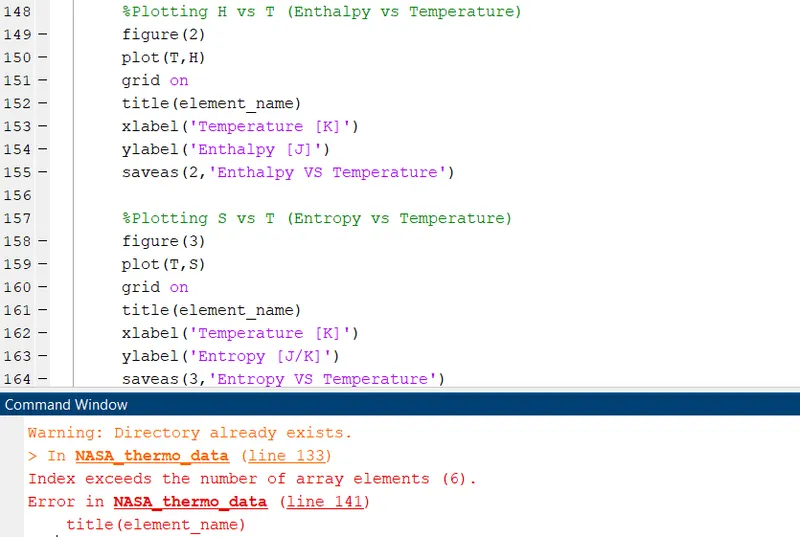
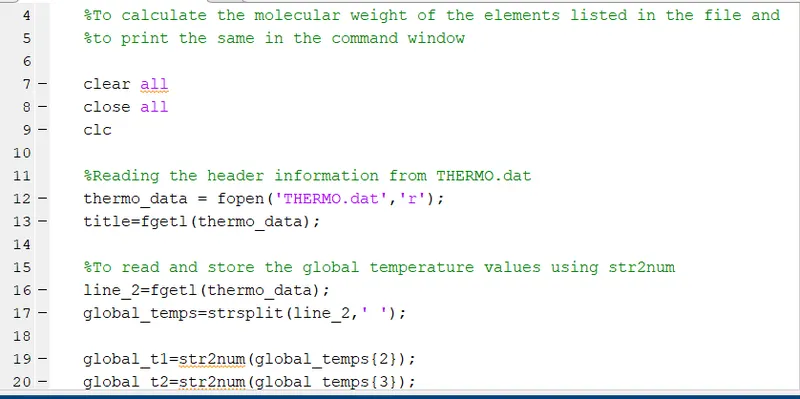
We can see that in the second image, line 13, the word title has been already assigned a value. So in line 141/152/161, when we use the title command for the plot, it shows as an error. It was solved when the word in line 13 was changed to Header (any other word than the title).
2. Incorrect molecular weight
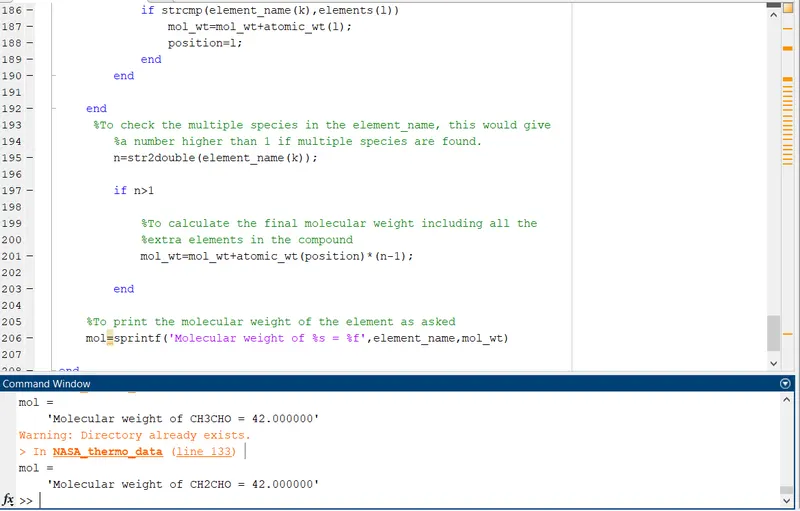
in the above-attached image, we can see that the molecular weight of CH2CHO is 42. But the actual molecular weight of the compound is 12+(1*2)+12+1+16 = 43. So in the program, we are getting the wrong result. The correction that was made is to place the 'if n>1' condition inside the looping condition so that the extra elements in the compound can be considered correct. The correction is shown in the below image
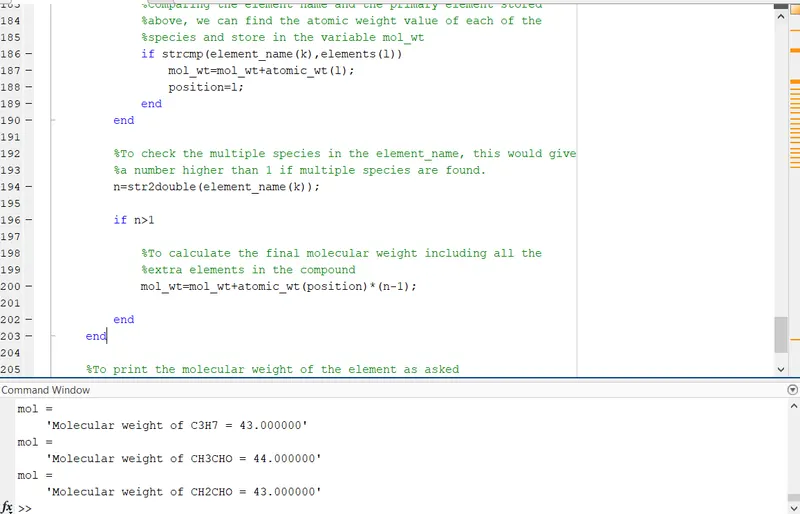
The molecular weights of the compounds in the above image are correct.
RESULTS -
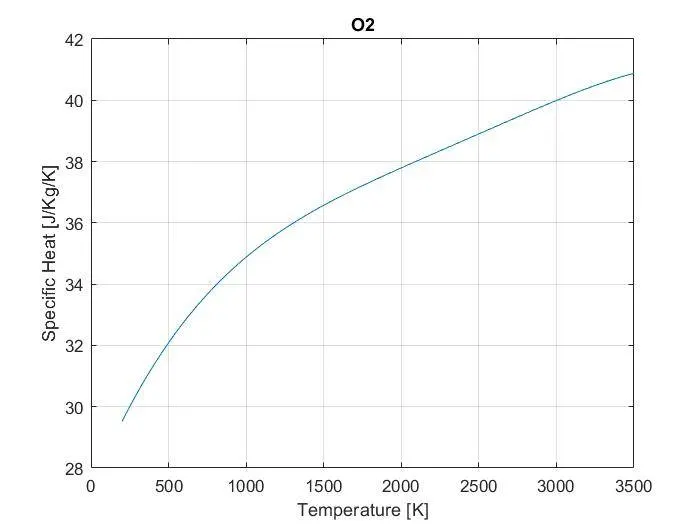
1. The plots of O2 are attached below -
- T-Cp diagram of O2
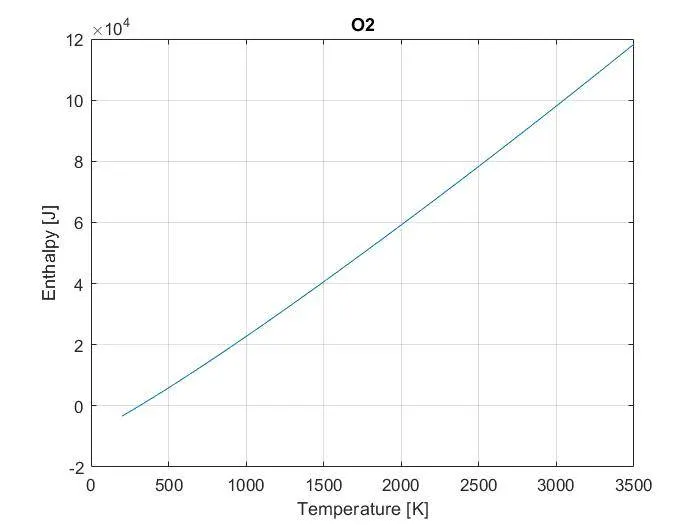
- T-H diagram of O2
- T-S diagram of O2
2. The plots of N2 are shown below -
- T-Cp diagram of N2
- T-H diagram of N2
- T-S diagram of N2
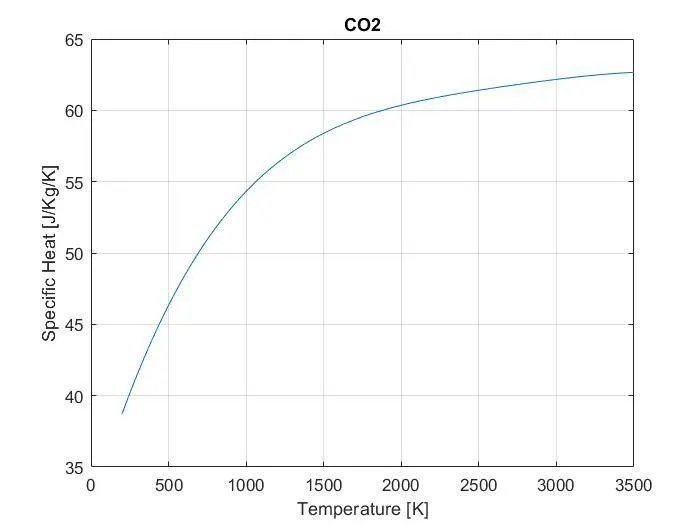
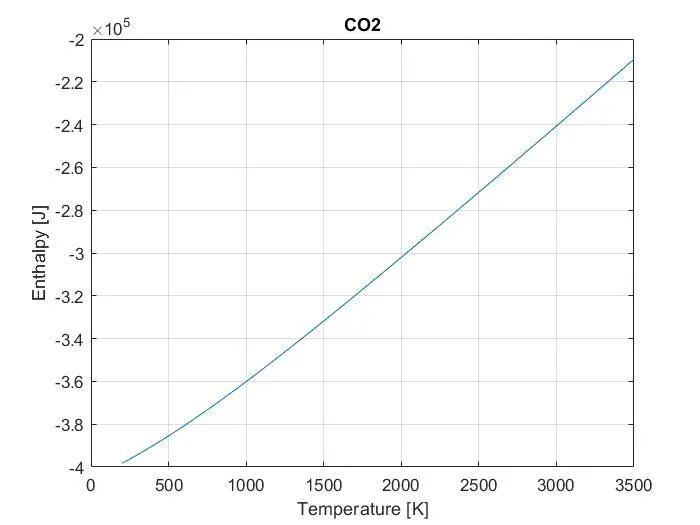
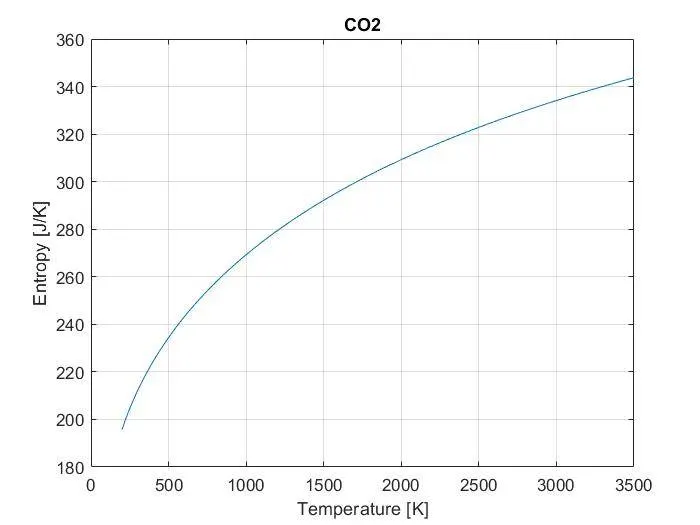
3. The plots of CO2 are shown below -
- T-Cp diagram of CO2
- T-H diagram of CO2
- T-S diagram of CO2
4. The screenshot of all the folders created through the program containing the T-Cp, T-H, T-S plots of the elements is attached below.
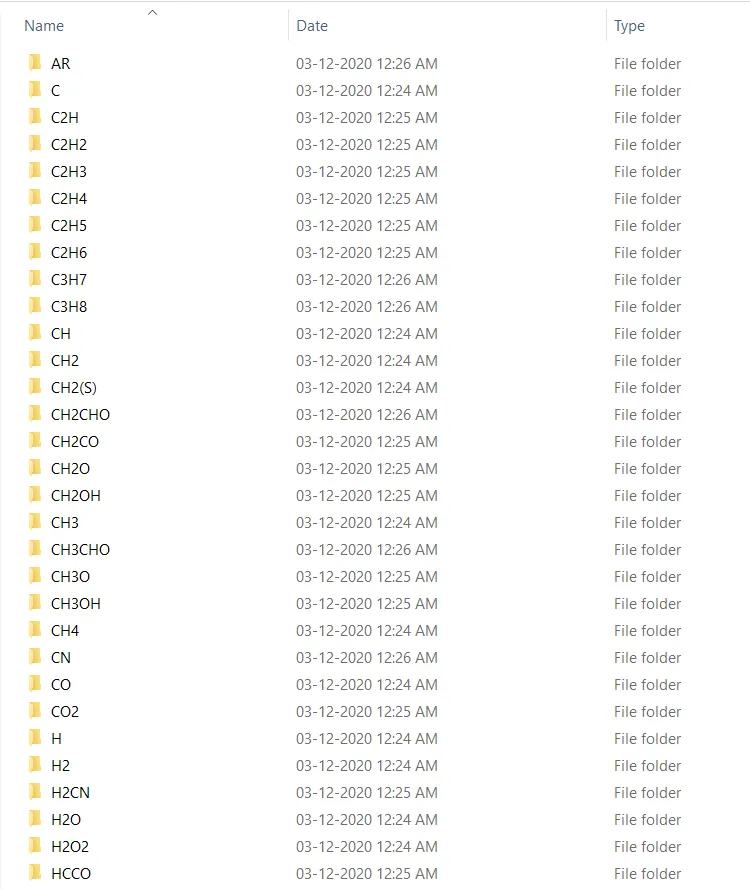
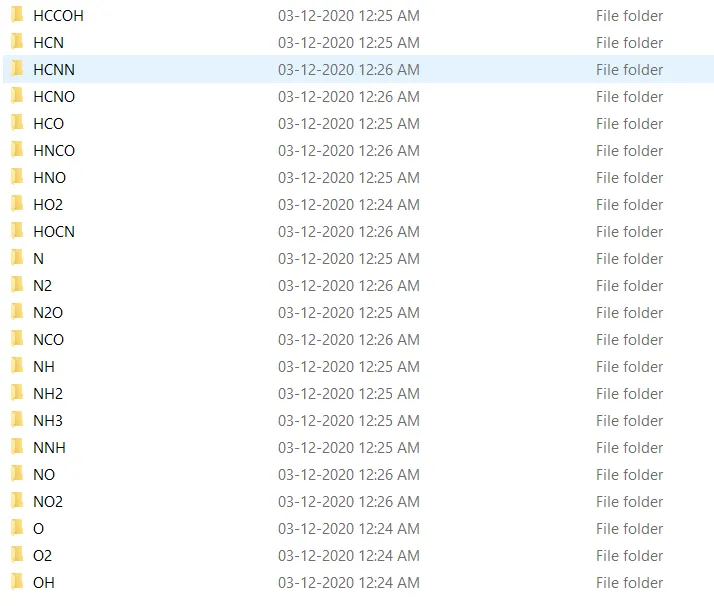
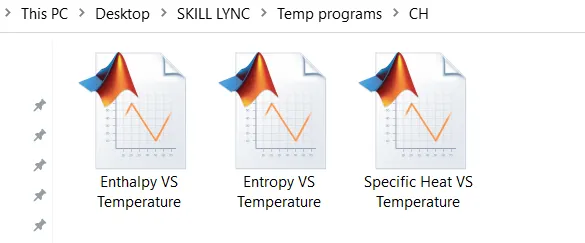
When we open the folders, we will find 3 MATLAB figures as shown below for each element in the data file.
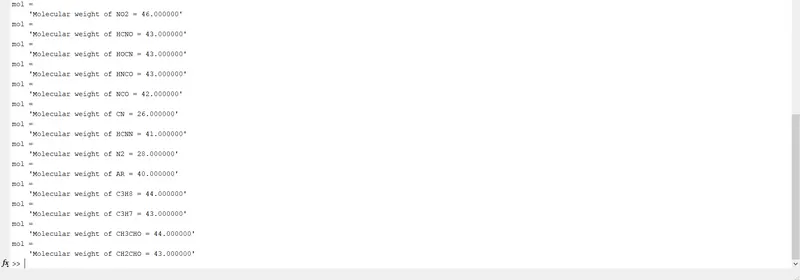
5. The screenshot of the command window containing the molecular weights of all the elements is attached below.
CONCLUSION -
We have written a program that parses the data from the file 'THERMO.dat' and solves the equations of Cp, H, and S as derived by NASA. We also plot T-Cp, T-H, and T-S diagrams for all the elements in the data file and save them in separate folders of their own. We also calculate the molecular weight of all the elements in the data file and print them on the command window. All results have been attached above.
REFERENCES -
1. https://in.mathworks.com/help/matlab/ref/.html
2. https://www.britannica.com/science/molecular-weight
3. https://www.grc.nasa.gov/www/k-12/airplane/enthalpy.html
5. https://courses.lumenlearning.com/boundless-physics/chapter/specific-heat/