Week 7 State of charge estimation
Introduction to Battery Technology for Electric Vehicle - Challenges
Week 7 State of charge estimation
Aim:-
1. Simulate the 3 test cases from the harness dashboard and write a detailed report on the results
Hint :(Download the file from the link and go to SOC estimation model-ECU block)
Solution:-
With the help of Simulink models like BMS ClosedLoop and BMS ClosedLoop Harness Dashboard as shown below, 3 test cases from BMS ClosedLoop Harness Dashboard have been simulated and their results are explained.
BMS ClosedLoop
BMS ClosedLoop Simulink model has BMS ECU and a PLANT where, to simulate the 3 test cases, changes have been made in the Set Plant Configuration of the model.
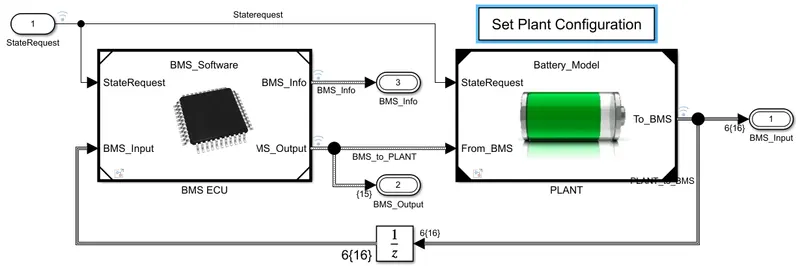
Set Configuration
In the Set Plant Configuration of the BMS ClosedLoop model, Battery 1 Pack 1RC is selected for the test case simulation.
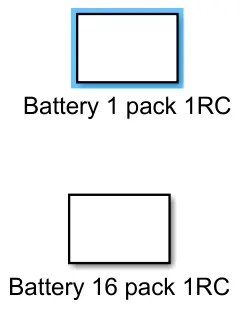
BMS ClosedLoop Harness Dashboard
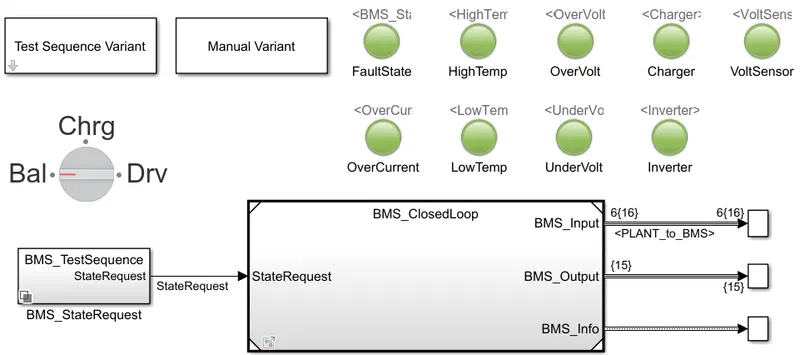
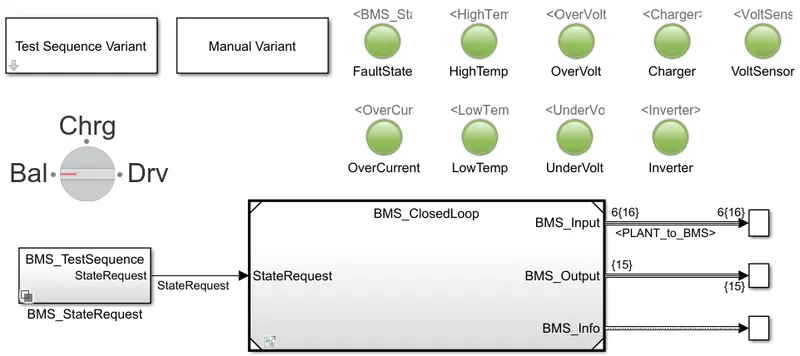
Below is the BMS ClosedLoop Harness Dashboard model in which the test cases will be selected from the Test Sequence Variant. After compiling the Simulink model the results understand through the lamps as shown below. If the lamps are red that means there is a fault occurred and if the lamps are all green then the Simulation is working fine without any error.
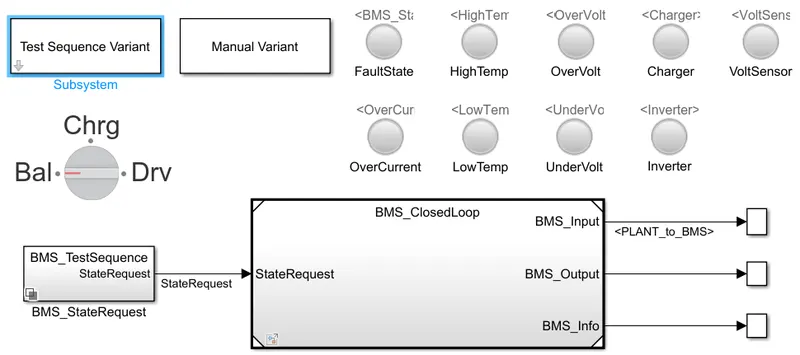
Test Case 1:-
1st Test case is selected to simulate one of the three test cases for the BMS ClosedLoop Harness Dashboard from the Test Sequence Variant.
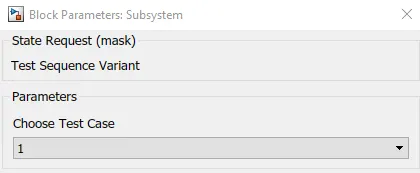
BMS ClosedLoop Harness Dashboard
After the Simulation is run no error can be seen in BMS ClosedLoop Harness Dashboard. All the lights are green which means every function is working properly.
Output
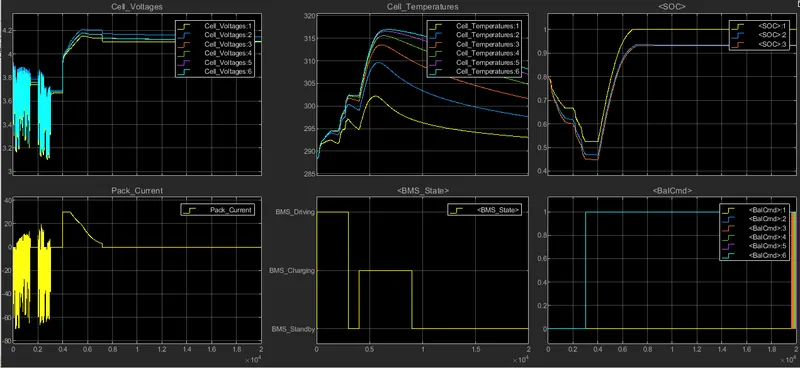
Below is the scope output for 1st test case Simulation.
Initially, BMS shows all cells are at the Driving state till 3000 secs, then it is in the Standby state for 1000 secs. It starts charging at 4000 secs hence SOC increases, Cell Temperature increases, also Cell Voltage and Cell Current rise. After Charging, when the SOC is 100% all the cells go to the Standby state and remain on Standby.
Test Case 2:-
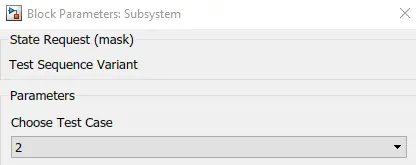
2nd Test case is selected to simulate one of the three test cases for the BMS ClosedLoop Harness Dashboard from the Test Sequence Variant.
BMS ClosedLoop Harness Dashboard
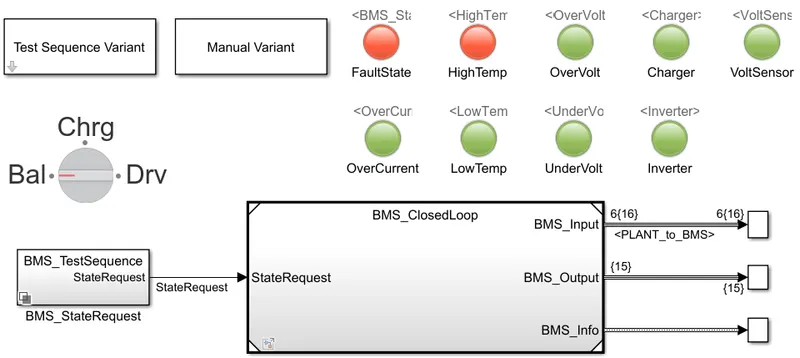
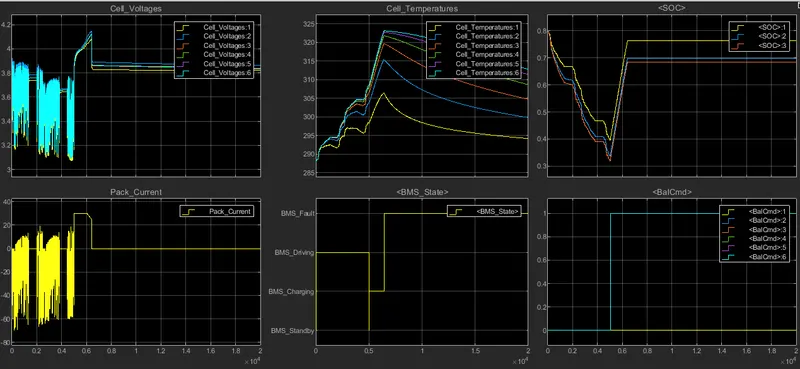
In this test case after the Simulation is run, fault can be seen occured at BMS State and Cell Temperature as red light can be seen instead of green.
Output
Below is the scope output for 2nd test case Simulation.
In this case, a fault state has occurred after the driving cycle 0f 5000 secs as SOC does not follow the Charging state.
Test Case 3:-
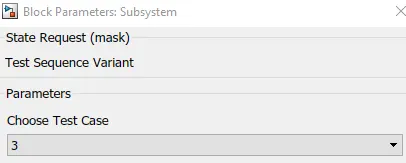
3rd Test case is selected to simulate one of the three test cases for the BMS ClosedLoop Harness Dashboard from the Test Sequence Variant.
BMS ClosedLoop Harness Dashboard
After the Simulation is run no error can be seen in BMS ClosedLoop Harness Dashboard. All the lights are green which means every function is working properly.
Output
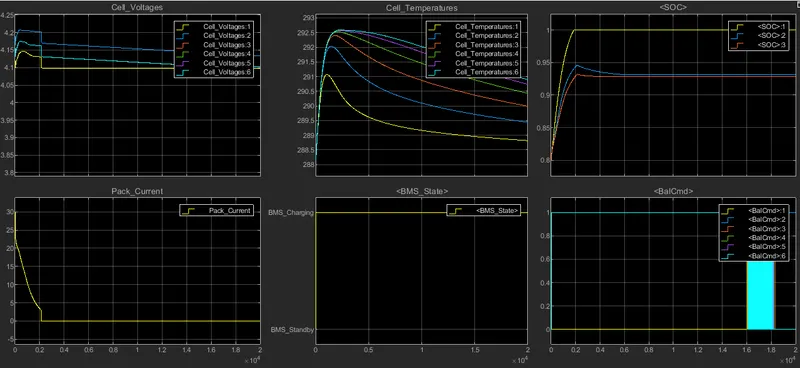
Below is the scope output for 3rd test case Simulation.
In this test case, no error can be seen as the BMS function properly. At the Charging state, SOC can be seen to increase and reaches 100%. Meanwhile Pack Current decreases and Cell Voltage increases and remains constant when SOC is 100%.
Aim:-
2. What is coulomb counting? Refer to the above model and explain how BMS implements coulomb counting for SOC estimation.
Solution:-
Coulomb Counting
In this block, the Current is integrated over time. Coulomb Counting helps to estimate the SOC. In this method, a charging/discharging current is measured and integrated over time to calculate the amount of energy remaining inside the battery.

In a battery management system (BMS), Coulomb counting is often used to estimate the state of charge (SoC) of a battery. The BMS typically includes a Coulomb counter circuit that measures the battery's current flow and integrates it over time to determine the amount of charge that has been transferred in and out of the battery.
The Coulomb counter circuit in a BMS typically consists of a current sensor, an analog-to-digital converter (ADC), and a microcontroller. The current sensor measures the current flowing in and out of the battery, and the ADC converts the analog current signal to a digital signal that can be processed by the microcontroller. The microcontroller then calculates the amount of charge that has been transferred by integrating the current signal over time.
To improve the accuracy of the SoC estimate, the BMS may also incorporate other methods such as voltage-based estimation, temperature compensation, and adaptive algorithms that take into account the battery's aging and other factors that affect its performance. The SoC estimate is typically used to monitor the battery's health, prevent overcharging and over-discharging, and optimize the battery's performance and lifespan.
Coulomb counting is a widely used method in BMSs because it is simple, reliable, and cost-effective. However, it does have some limitations, such as the need for accurate current measurement and the assumption that the battery's capacity remains constant over time. Therefore, it is often used in combination with other methods to improve the accuracy and reliability of the SoC estimate.