Week 7 State of charge estimation
1. Simulate the 3 test cases from the harness dashboard and write a detailed report on the results :
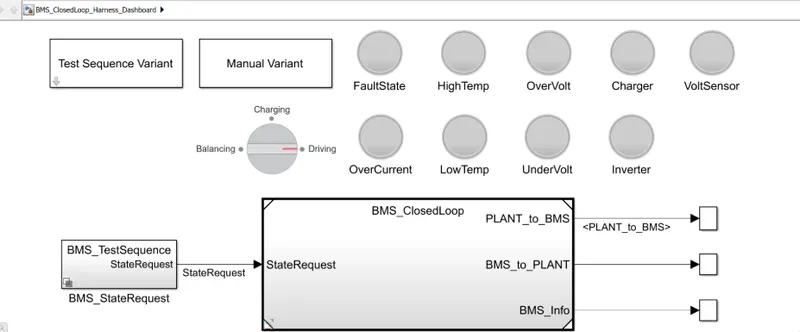
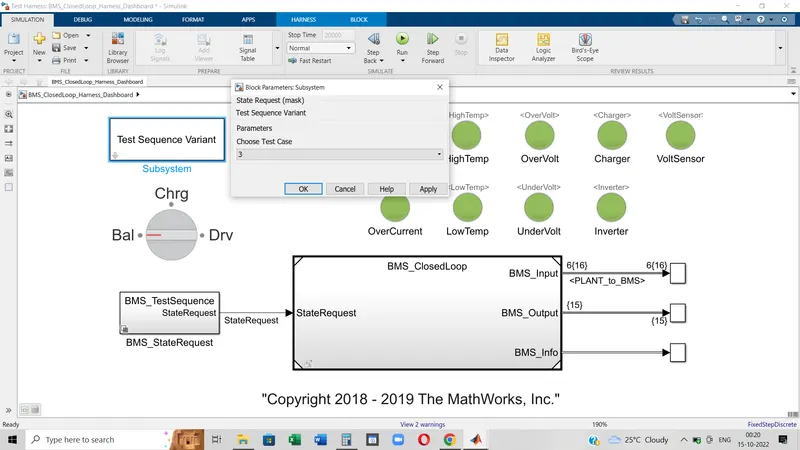
- This is the model which has three different test conditions.
- From the Test sequence Variant block we can change the condition and see the outputs.
- The model is designed to run for 20000 seconds.
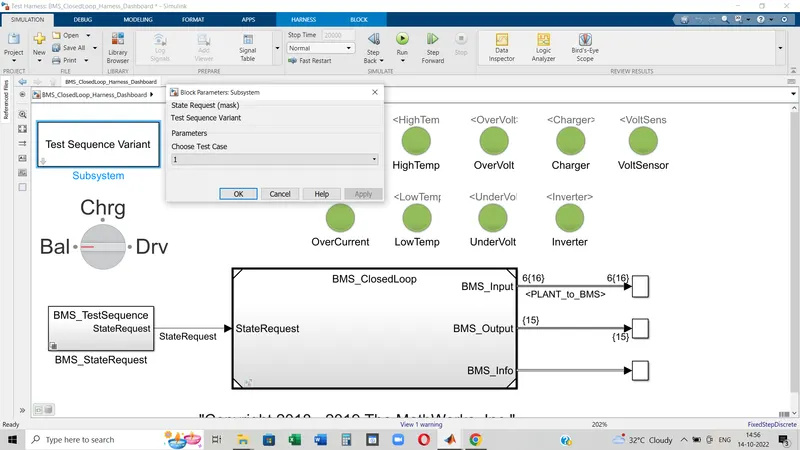
The 1st Test condion,
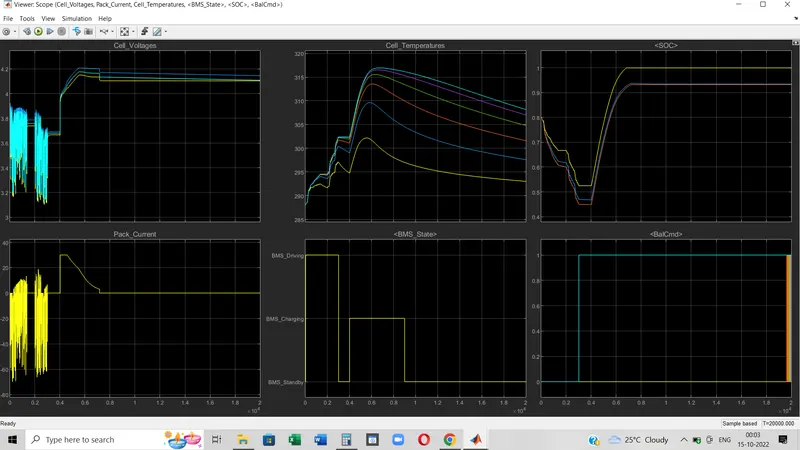
- The above graph is the output of 1st test condition which is shown in the picture before the graph output block.
- In the BMS state graph, we can observe the model or battery pack was on driving condition for the first 2000 seconds then it goes to standby mode for some time. Next, it goes to the charging condition and after 9000 seconds it comes to again stand by mode.
- During the driving condition, the SOC is gradually decreasing. When the BMS is in charging mode for that particular period SOC has risen up and the battery gets charged. After that when BMS comes to the standby mode then SOC remains full.
- Cell temperature is also different as those are located at different positions. So the cell is near to the cooling arrangement that has a low temp compared to others.
- Cell Voltage and Current have fluctuated constantly during the driving mode and then it comes to constant.
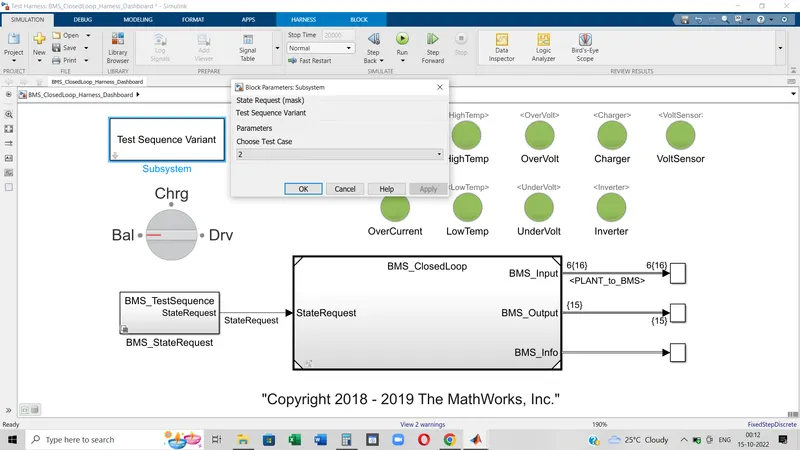
In the 2nd test condition,
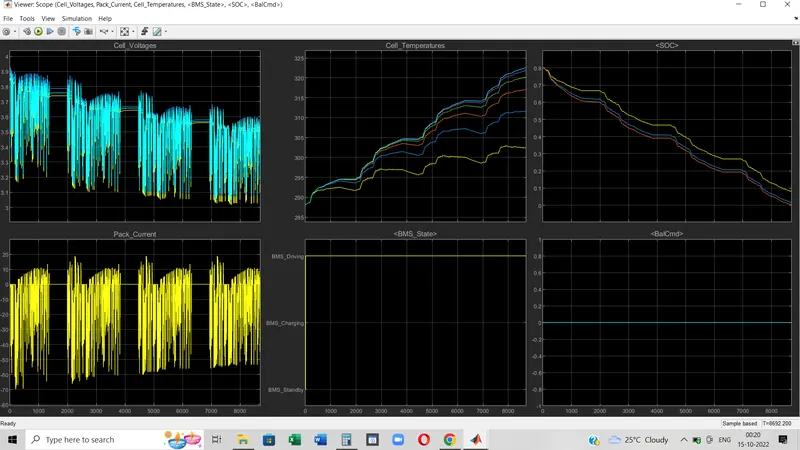
- Cell voltage and current have several fluctuations as it has more driving modes.
- In the BMS state graph, the driving mode persists up to the end of the sample time.
- The Cell temperature has risen up as cells are in working mode throughout the whole time period. But different cells have different temperatures because of the cooling arrangement. Generally which cells lie on the same surface of the cooling arrangement gets low-temperature rise compared to others that are a bit high distance from the cooling surface.
- SOC has gradually fallen and after 8500 seconds it comes to zero charges. Next battery pack should be run in charging mode otherwise that can not proceed to run a single distance.
3rd condition,
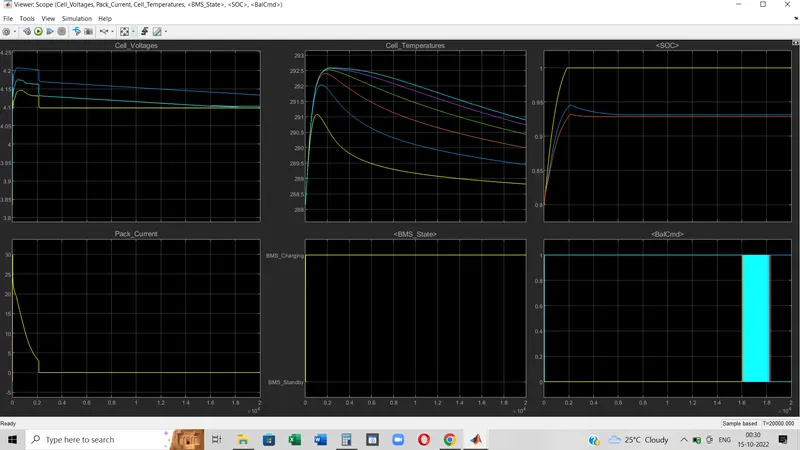
- Here the Battery Management System has run in a Charging state throughout the sample time(20000 seconds).
- So the cell voltage firstly rises to the max value and then comes to the nominal value and persists till the last.
- Battery pack current is zero throughout the time period though in starting it has surge and for that goes up to 30 Amp.
- Battery SOC condition almost lies in full but which cell has a higher temp(in the graph of cell temp blue, orange), SOC is compared to lower than the yellow. Because the yellow cell has lowest temp rise so the SOC of it continues at 1. But due to higher temperature the capacity reduces and the SOC of other cells came down to near 0.95.
2. What is coulomb counting? Refer to the above model and explain how BMS implements coulomb counting for SOC estimation :
SOC estimation is a fundamental challenge for battery use. The SOC of a battery, which is used to describe its remaining capacity, is a very important parameter for a control strategy. As the SOC is an important parameter, which reflects the battery performance, so accurate estimation of the SOC can not only protect the battery, prevent over-discharge, and improve the battery life but also allow the application to make rational control strategies to save energy. However, a battery is a chemical energy storage source, and this chemical energy cannot be directly accessed. This issue makes the estimation of the SOC of a battery difficult.
Definition and classification of SOC estimation methods:
The SOC is one of the most important parameters for batteries, but its definition presents many different issues [5]. In general, the SOC of a battery is defined as the ratio of its current capacity (Qt) to its nominal capacity (Qn). The nominal capacity is given by the manufacturer and represents the maximum amount of charge that can be stored in the battery. The SOC can be defined as follows:

The various mathematical methods of estimation are classified according to methodology. The classification of these SOC estimation methods is different in the various literature. However, some literature allows a division into the following four categories.
(i)Direct measurement: this method uses physical battery properties, such as the voltage and impedance of the battery.
(ii)Book-keeping estimation: this method uses discharging current as the input and integrates the discharging current over time to calculate the SOC.
(iii)Adaptive systems: the adaptive systems are self-designing and can automatically adjust the SOC for different discharging conditions. Various new adaptive systems for SOC estimation have been developed.
(iv)Hybrid methods: the hybrid models benefit from the advantages of each SOC estimation method and allow a globally optimal estimation performance. The literature shows that the hybrid methods generally produce a good estimation of SOC, compared to individual methods.
Coulomb Counting Method:
The Coulomb counting method measures the discharging current of a battery and integrates the discharging current over time in order to estimate SOC. The coulomb counting method is done to estimate the SOC(t), which is estimated from the discharging current, I(t), and previously estimated SOC values, SOC(t-1), SOC is calculated by the following equation:

But there are several factors that affect the accuracy of the Coulomb counting method including temperature, battery history, discharge current, and cycle life.
This method relies on Book-Keeping estimation.
Modified Coulomb Counting Method:
To improve the Coulomb counting method, a new technique called the modified Coulomb counting method is proposed. The modified Coulomb counting method uses the corrected current to improve the accuracy of estimation.
The corrected current is the function of discharging current. There is a quadratic relationship between the corrected current and discharging current of the battery. By the practice of experimental data, the corrected current is calculated by the following form:

where k2, k1, and k0 are constant values obtained from the practice experimental data.
In the modified Coulomb counting method, SOC is calculated by the following equation:

The experimental results show that the accuracy of the modified Coulomb counting method is superior to the conventional Coulomb counting method.
In the model, BMS closed loop :
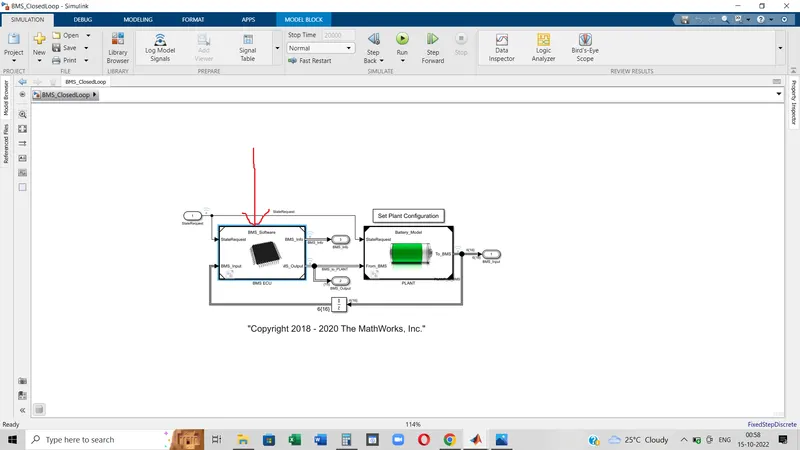
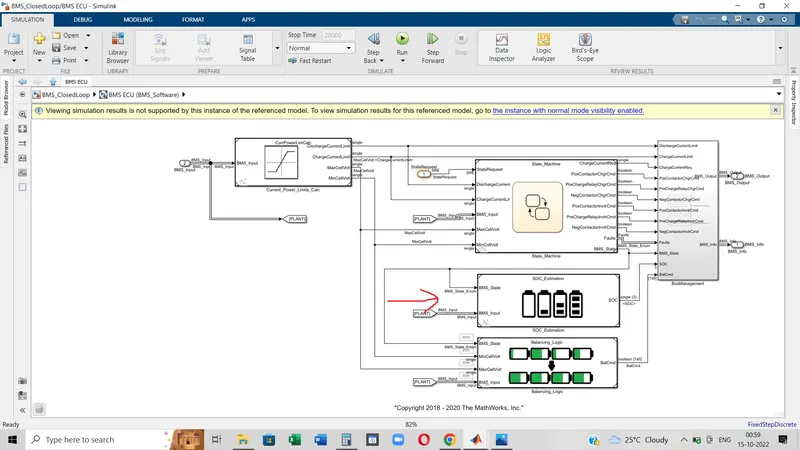
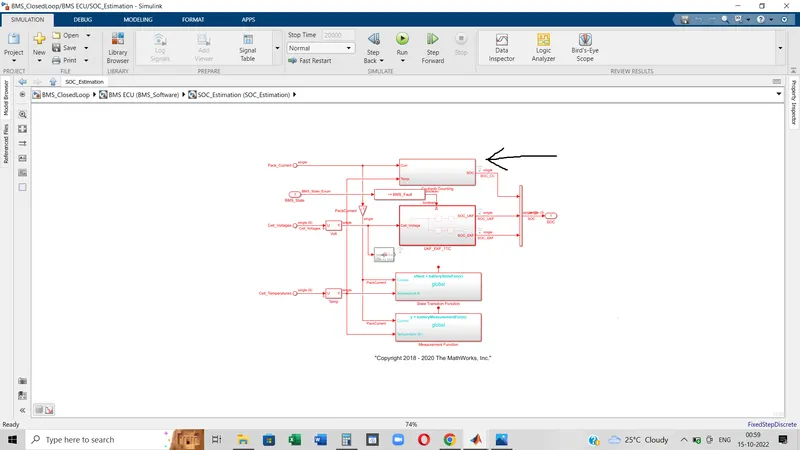
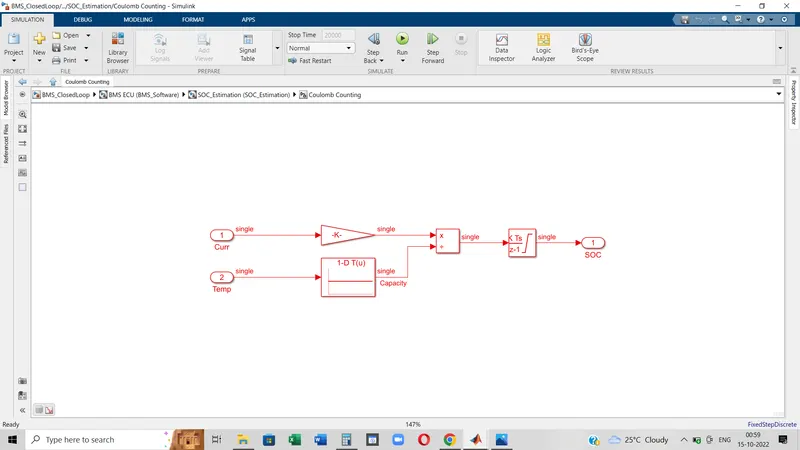
- Chronologically pictures have been arranged to show the Coulomb Counting Method.
- In the model BMS closed loop, inside the BMS_ECU subsystem, the is a subsystem named SOC_Estimation.
- Inside the SOC_Estimation, a subsystem named Coulomb Counting exists where the mathematical algorithm is implanted to count the State of Charge.
- Here the current is passed through the gain block to multiply the current by 1/3600 to get it in each second.
- As the capacity of the cell is dependent on the temperature so by the 1-D lookup table the graph has been formed with capacity and temp and that is been divided.
- Next the current/capacity is integrated to get the SOC.