Week-4 Challenge WOT Condition Part-2
(1)
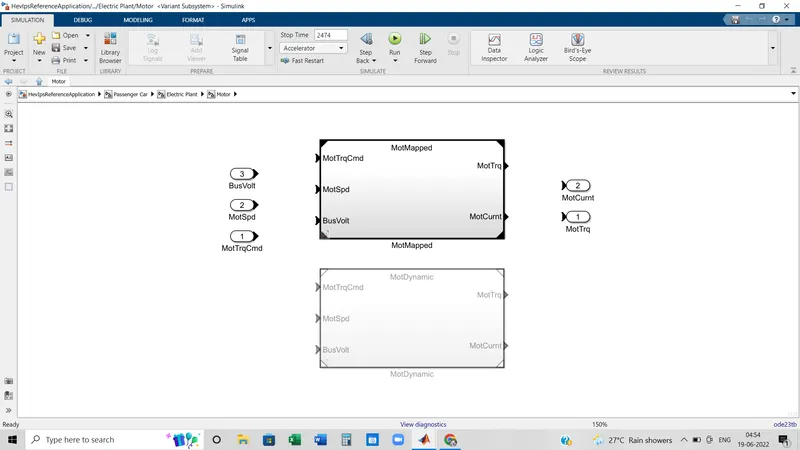
Mapped Model:
- Mapped models are where the data points are assigned in the look-up table.
- It is simple and doesn't run by real parameters.
- Simulation time is much lesser than the dynamic model of an engine or motor or generator.
- The model uses a set of steady-state lookup tables to characterize engine performance.
- In the case of CI or SI engines, the tables provide overall engine characteristics, including actual torque, fuel flow rate, BSFC, and engine-out exhaust emissions.
When to use(in case of engine)
-
If you have engine data from a dynamometer or a design tool like GT-POWER
-
For quasi-steady-state engine simulations.
Dynamic Model:
- Here, output data are combined with the input parameters.
- Dynamic models run in real-time simulation
- After taking output values it adds all the data and gives further output.
- It takes more time compared to the mapped model as here output depends on the various subsystems.
- The accuracy of this model is higher as it considers all the real output of all subsystems.
- The model decomposes the engine behavior into engine characteristics that are separated into lower-level components. By combining components in this way, the models capture the dynamic effects. (In case of engine)
When to use(in case of engine)
-
If you need a more detailed dynamic model and have component-level data.
-
To analyze the impact of individual engine components on the overall performance.
Steps to :
- Firstly we need to select the vehicle and specify the model as it is EV or HEV or has CI or SI engine.
- In this case I have chosen HEV so it has Engine block and motor. Here the motor also works as generator.
- In the powertrain blockset , go to passenger car subsystem.
- Next, inside the passenger car subsystem, go to Electric plant.
- Inside this block, generator and motor two subsystem exist. Choose any one.
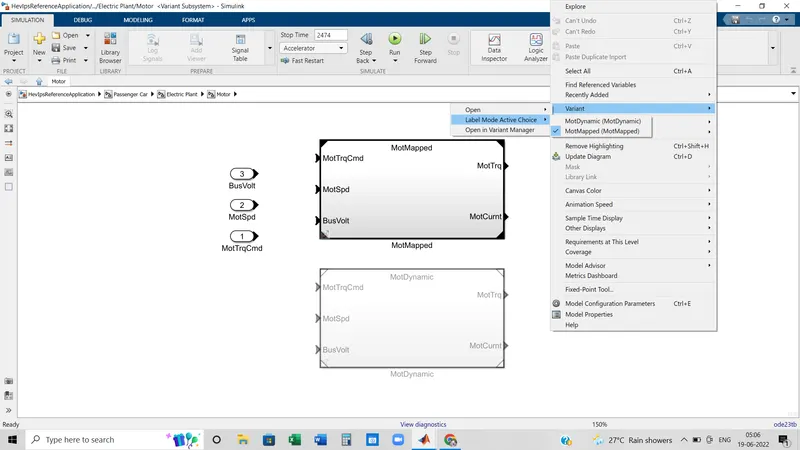
- As I have chosen motor block, so after entering inside the motor block, right click on any blank space.
- Choose Variant option.
- Under the variant, go to the 'Label mode active choice'.
- Now under this there is two options. Those are MotDynamic and MotMapped.
- Choose any one option as per the experiment condition.
(2)
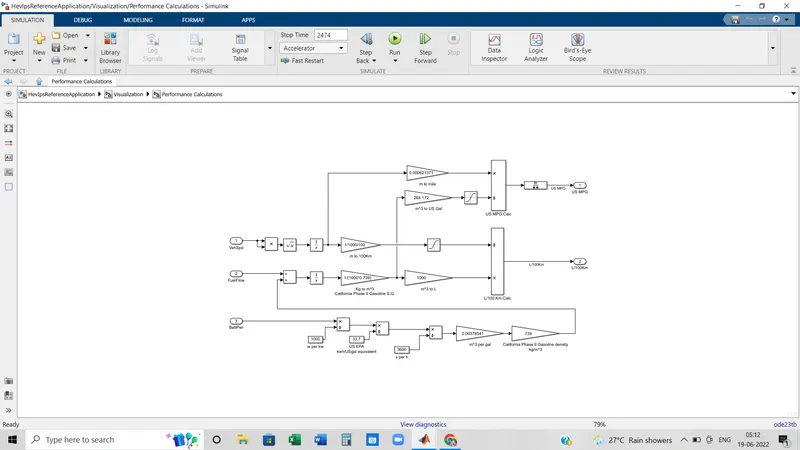
In the case of HEV, the Following factors are involved to calculate the miles per gallon fuel:
- vehicle speed
- fuel flow
- battery power
In the case of EVs, the Following factors are involved to calculate the miles per gallon fuel:
- vehicle speed
- battery power
Calculation:
- To calculate the distance, vehicle speed is integrated. After getting the distance it needs to convert in miles.
- Battery Power is converted into m^3/gallon.
- After converting battery power to m^3/gallon, It will be added.
- The total added values will be integrated and then it needs to convert into gallon and litre.
- Now the distance value in mile will be divided by fuel in gallon to get the fuel flow in Miles per gallon.
- We can also divide the Litre value by 100 km to calculate how much fuel will be used per 100 km.
(3)
Reference HEV Powertrain :
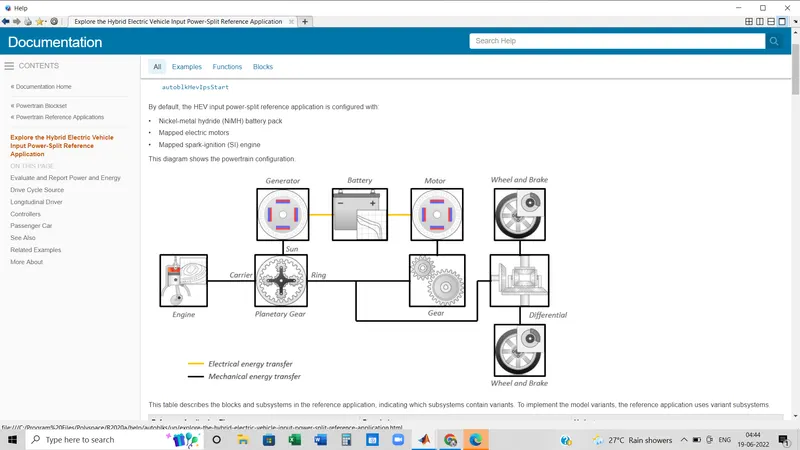
Case-1 (Reference model)
Initially,
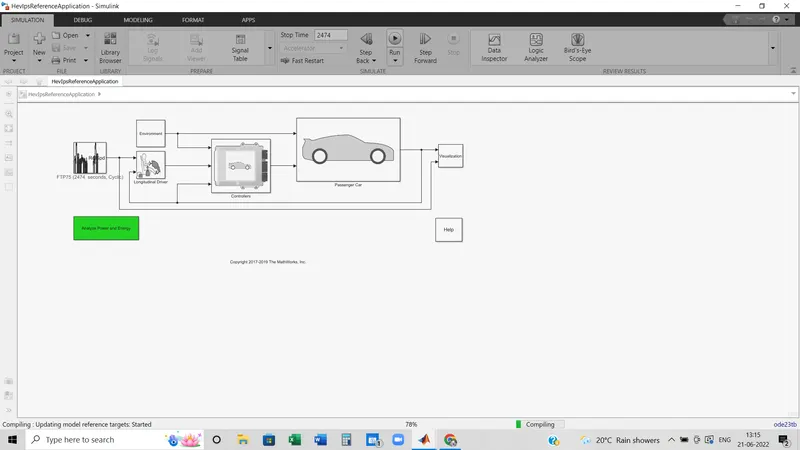
- the drive cycle is as per the reference model which is FTP75 and the simulation time is 2474 seconds.
- Here the grade is zero
- wind velocity has been taken zero
Result of Case-1
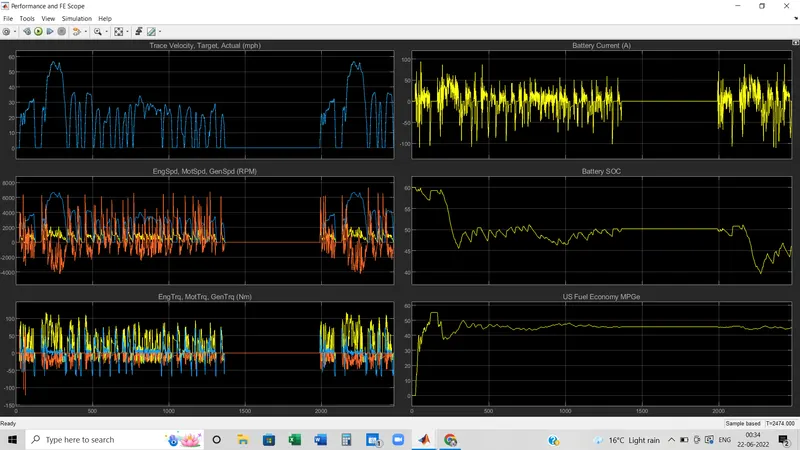
The result consists of 6 plots :
- Trace velocity, Target actual (Mile per hour) w.r.t. Time: It is the drive cycle that is the default in the reference power train model. The drive cycle is FTP75 and the simulation time for that particular drive cycle is 2474 seconds.
- Battery Current(A) w.r.t. Time: Battery current flow with the vehicle movement.
- Engine Speed, Motor Speed, Generator Speed w.r.t. Time: In the HEV model when the battery gets diffused the engine rotates
- Battery State of Charge w.r.t. Time: As the time goes battery charge decrease. During the acceleration period, SOC decreases frequently.
- Engine Torque, Motor Torque, Generator Torque w.r.t. Time:
- Fuel Economy w.r.t. Time:
Case-2 (change in Drive Cycle)
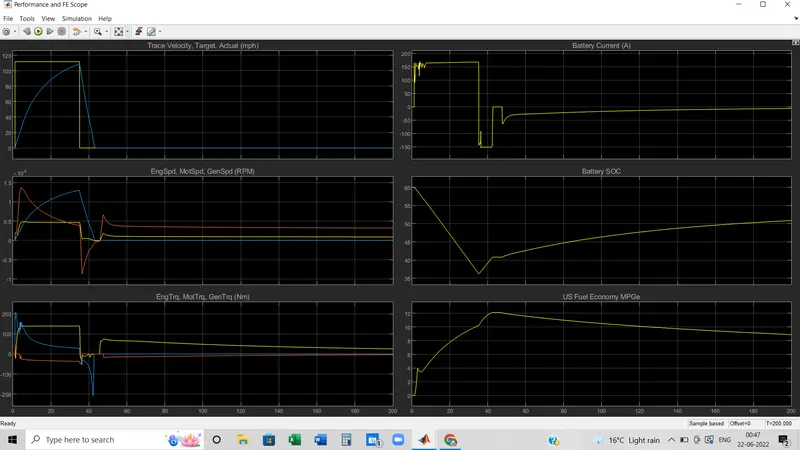
The result consists of 6 plots:
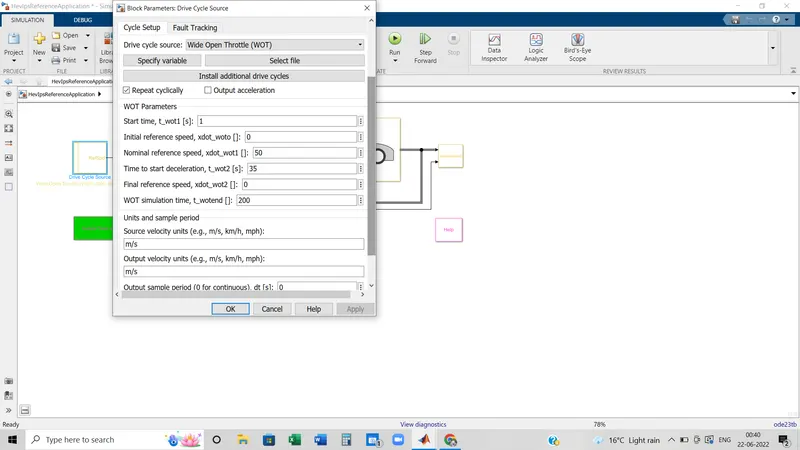
- Trace velocity, Target actual (Mile per hour) w.r.t. Time: From the reference model default drive cycle has been removed and Added WOT. In the WoT initial speed is 0 and the max speed is 60 m/s. After 35 seconds vehicle will start to decelerate.
- Battery Current(A) w.r.t. Time: Initially the current required to start the vehicle motor is high and with the speed reduction the current has also been reduced. The motor is required only to generate starting torque.
- Engine Speed, Motor Speed, Generator Speed w.r.t. Time: This plot shows the different speeds of the engine, motor, and generator. Up to 35 seconds motor speed has been gradually increased and then it stopped. Till that moment generator speed was negative but after 35 seconds as the battery need to be recharged so it started to rotate and it values get positive.
- Battery State of Charge w.r.t. Time: Initially the state of charge was at 60%. When the vehicle is in acceleration mode the state of charge is decreasing. At the end of acceleration, the state of charge is at 33 %. After 35 seconds the battery starts to recharge again. After a certain time battery gets fully charged.
- Engine Torque, Motor Torque, Generator Torque w.r.t. Time: It shows the torque condition of the engine, motor, and generator. After 35 seconds Generator torque is negative which shows that the battery needs to recharge. Similarly, engine torque reduced gradually due to the power increment.
- Fuel Economy w.r.t. Time: The max fuel economy is 12 MPG, and the min fuel economy is 8.4 MPG.
Case-3 ( Modification in Environment Block):
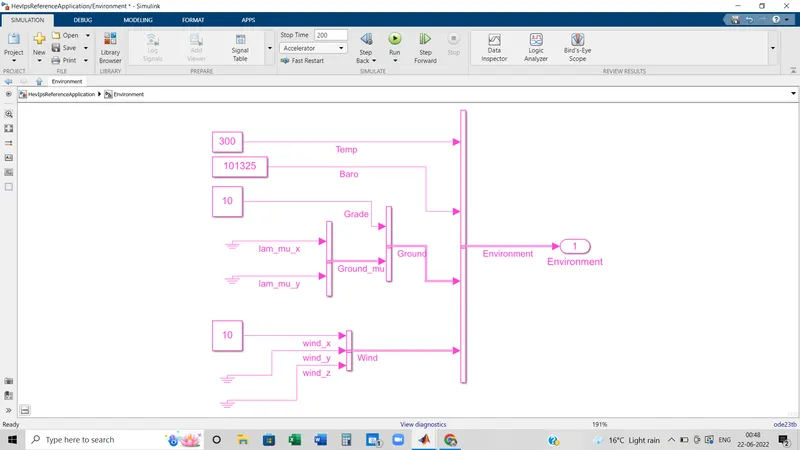
Here the grade is added to 10 degrees and the wind velocity is 10 m/s.
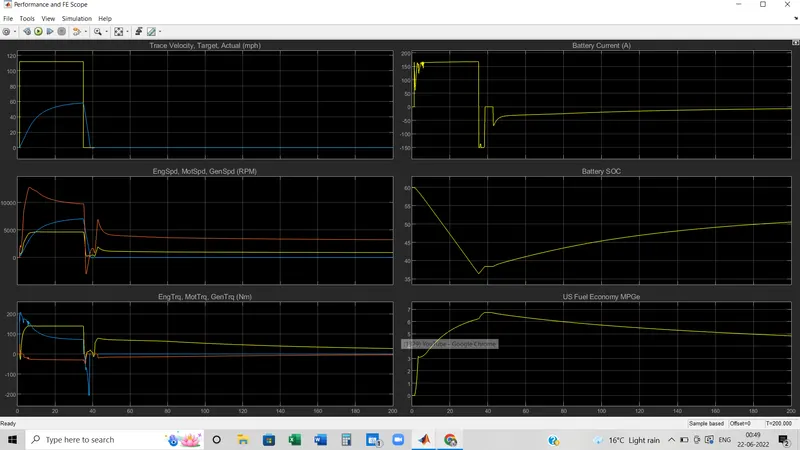
- Trace velocity, Target actual (Mile per hour) w.r.t. Time: Now it clearly shows due to the grade and wind velocity vehicle can not achieve the required max speed. Though the max velocity is 115 mile/h vehicle has only achieved 60 mile/h.
- Battery Current(A) w.r.t. Time: Battery current supply has not been changed from the before one. The battery supplied the current for 35 seconds and the current has also decreased with the reduction of speed.
- Engine Speed, Motor Speed, Generator Speed w.r.t. Time: It shows the different speeds of the engine motor, and generator. Up to 35 seconds motor speed has been gradually increased and then it stopped. Till that moment generator speed was negative but after 35 seconds the battery need to be recharged so it started to rotate and it values get positive.
- Battery State of Charge w.r.t. Time: Till the acceleration period battery charges have gradually decreased and after that battery starts to recharge.
- Engine Torque, Motor Torque, Generator Torque w.r.t. Time: It shows the torque condition of the engine, motor, and generator. After 35 seconds Generator torque is negative which shows that the battery needs to recharge. Similarly, engine torque reduced gradually due to the power increment.
- Fuel Economy w.r.t. Time: US fuel economy has changed from the before one. Here the max value is 6.8 MPG and the min value is 4.97 MPG.
The result comes in the scope which lies in the visualization subsystem block.
Conclusion:
| Parameters | WOT without Grade and wind velocity | WOT with Grade and wind velocity |
| Grade | 0 | 10 |
| Wind velocity | 0 | 10 |
| Max Speed (mph) | 116 | 60 |
| Initial SOC | 60 | 60 |
| SOC at end of acceleration | 35 | 36 |
| Max fuel economy | 12 | 6.8 |
| Min fuel economy | 8.4 | 4.97 |
| Acceleration time | 35 | 35 |
| Deceleration time | 8 | 4 |
(4) EV Reference Powertrain:
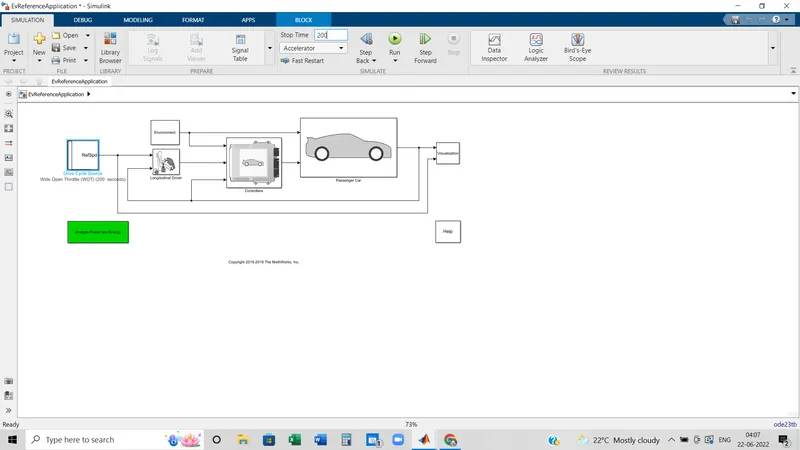
Case-1(Added WOT without changing Grade and Wind Velocity) :
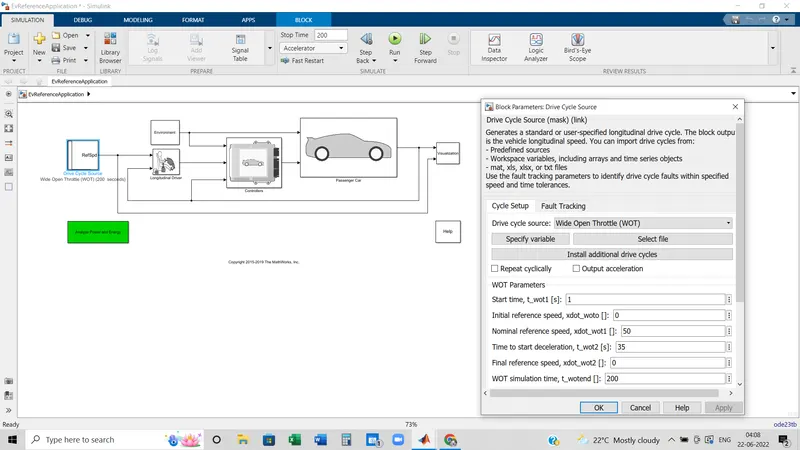
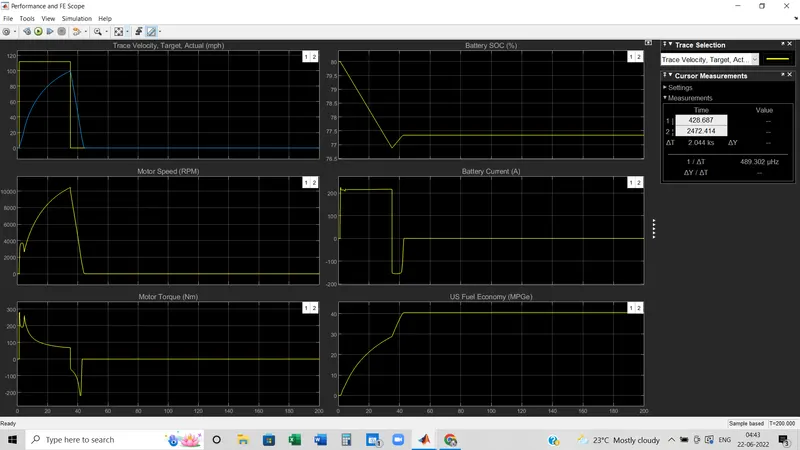
Result consists 6 plots:
- Trace velocity, Target actual (Mile per hour) w.r.t. Time: Though the max velocity is 115 mile/h vehicle has only achieved 100 mile/h.
- Battery Current(A) w.r.t. Time: The battery supplied the current for 35 seconds and the current has also decreased with the reduction of speed.
- Motor Speed w.r.t. Time: It shows the different speeds of the motor. Up to 35 seconds motor speed has been gradually increased and then it stopped. After 35 seconds the battery need to be recharged.
- Battery State of Charge w.r.t. Time: Till the acceleration period battery charges have gradually decreased and after that battery needs to be put to recharge.
- Motor Torque w.r.t. Time: It shows the torque condition of the motor.
- Fuel Economy w.r.t. Time: US fuel economy has changed from the before one. Here the max value is 40.5 MPG and the min value is 29 MPG.
Case-2(WOT with Grade=10 and Wind velocity 10 m/s):
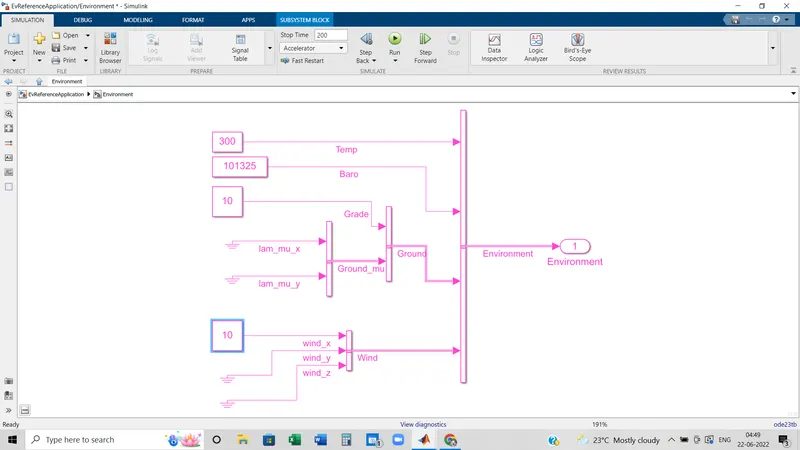
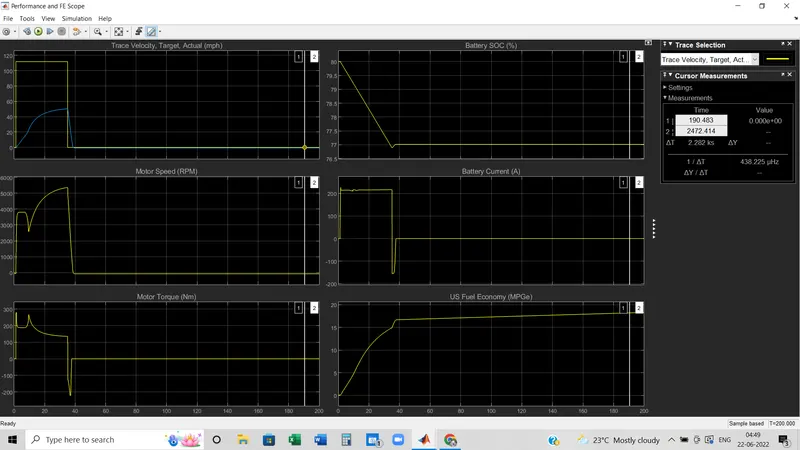
Result consists 6 plots :
- Trace velocity, Target actual (Mile per hour) w.r.t. Time: Now it clearly shows due to the grade and wind velocity vehicle can not achieve the required max speed. Though the max velocity is 115 mile/h vehicle has only achieved 50 mile/h.
- Battery Current(A) w.r.t. Time: Battery current supply has not been changed from the before one. The battery supplied the current for 35 seconds and the current has also decreased with the reduction of speed.
- Motor Speed w.r.t. Time: It shows the speeds of the engine motor. Up to 35 seconds motor speed has been gradually increased and then it stopped. After 35 seconds the battery needs to be recharged.
- Battery State of Charge w.r.t. Time: Till the acceleration period battery charges have gradually decreased and after that battery needs to be put to recharge.
- Motor Torque w.r.t. Time: It shows the torque condition of the motor. After 35 seconds Motor torque is negative which shows that the battery needs to recharge.
- Fuel Economy w.r.t. Time: US fuel economy has changed from the before one. Here the max value is 18 MPG and the min value is 15 MPG.
Conclusion:
| Parameters | WOT without Grade and wind velocity | WOT with Grade and wind velocity |
| Grade | 0 | 10 |
| Wind velocity | 0 | 10 |
| Max Speed (mph) | 100 | 50 |
| Initial SOC | 80 | 80 |
| SOC at end of acceleration | 76.9 | 76.9 |
| Max fuel economy | 40.5 | 18 |
| Min fuel economy | 8.4 | 4.97 |
| Acceleration time | 35 | 35 |
| Deceleration time | 8 | 4 |
Comparing HEV reference powertrain and EV reference powertrain:
| Properties | HEV Reference Powertrain | EV Reference Powertrain | ||
| WOT without grade & wind velocity | WOT with grade & wind velocity | WOT without grade & wind velocity | WOT with grade & wind velocity | |
| Grade | 0 | 10 | 0 | 10 |
| Wind velocity | 0 | 10 | 0 | 10 |
| Max Speed (mph) | 116 | 60 | 100 | 50 |
| Initial SOC | 60 | 60 | 80 | 80 |
| SOC at end of acceleration | 35 | 36 | 76.9 | 76.9 |
| Max fuel economy | 12 | 6.8 | 40.5 | 18 |
| Min fuel economy | 8.4 | 4.97 | 29 | 15 |
| Acceleration time | 35 | 35 | 35 | 35 |
| Deceleration time | 8 | 4 | 8 | 4 |