Week 7 State of charge estimation
"Week 7 State of charge estimation"
AIM:
To Study the State of Charge Estimation.
OBJECTIVES :
-
Simulate the 3 test cases from the harness dashboard and write a detailed report on the results.
-
What is coulomb counting? Refer to the above model and explain how BMS implements coulomb counting for SOC estimation.
State of Charge Estimating :
An overview of new and current developments in state of charge (SOC) estimating methods for battery is given where the focus lies upon mathematical principles and practical implementations. As the battery SOC is an important parameter, which reflects the battery performance, so accurate estimation of SOC cannot only protect battery, prevent overcharge or discharge, and improve the battery life, but also let the application make rationally control strategies to achieve the purpose of saving energy. This paper gives a literature survey on the categories and mathematical methods of SOC estimation. Based on the assessment of SOC estimation methods, the future development direction of SOC estimation is proposed.
Introduction:
Rising crude oil prices and worldwide awareness of environmental issues have resulted in the increased development of energy storage systems. The battery is one of the most attractive energy storage systems because of its high efficiency and low pollution. There are several kinds of batteries currently being used in the industry: lead-acid battery, Ni-MH battery, Ni-Cd battery, and Li-ion battery. The battery has the advantages of high working cell voltage, low pollution, low self-discharge rate, and high power density. Batteries are used commonly for portable utilities, hybrid electric vehicles, and industrial applications.
SOC estimation is a fundamental challenge for battery use. The SOC of a battery, which is used to describe its remaining capacity, is a very important parameter for a control strategy. As the SOC is an important parameter, which reflects the battery performance, so accurate estimation of the SOC can not only protect the battery, prevent over-discharge, and improve the battery life but also allow the application to make rational control strategies to save energy. However, a battery is a chemical energy storage source, and this chemical energy cannot be directly accessed. This issue makes the estimation of the SOC of a battery difficult. Accurate estimation of the SOC remains very complex and is difficult to implement because battery models are limited and there are parametric uncertainties. Many examples of poor accuracy and reliability of the estimation of the SOC are found in practice.
Definition and Classification of SOC Estimation -
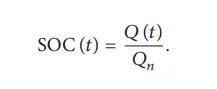
The SOC is one of the most important parameters for batteries, but its definition presents many different issues. In general, the SOC of a battery is defined as the ratio of its current capacity (𝑄(𝑡)) to the nominal capacity (𝑄𝑛). The nominal capacity is given by the manufacturer and represents the maximum amount of charge that can be stored in the battery. The SOC can be defined as follows:
The various mathematical methods of estimation are classified according to methodology. The classification of these SOC estimation methods is different in the various literature. However, some literature allows a division into the following four categories.
- Direct measurement: This method uses physical battery properties, such as the voltage and impedance of the battery.
- Book-keeping estimation: This method uses discharging current as of the input and integrates the discharging current over time to calculate the SOC.
- Adaptive systems: The adaptive systems are self-designing and can automatically adjust the SOC for different discharging conditions. Various new adaptive systems for SOC estimation have been developed.
- Hybrid methods: The hybrid models benefit from the advantages of each SOC estimation method and allow a globally optimal estimation performance. The literature shows that the hybrid methods generally produce a good estimation of SOC, compared to individual methods.
Q1). Simulate the 3 test cases from harness dashboard and write a detailed report on the results.
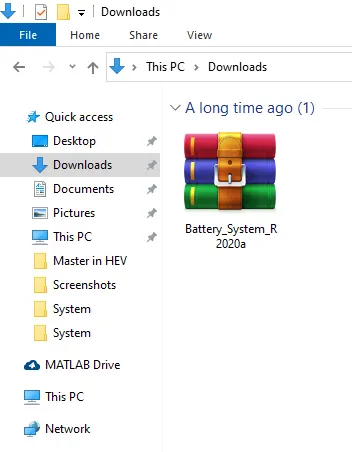
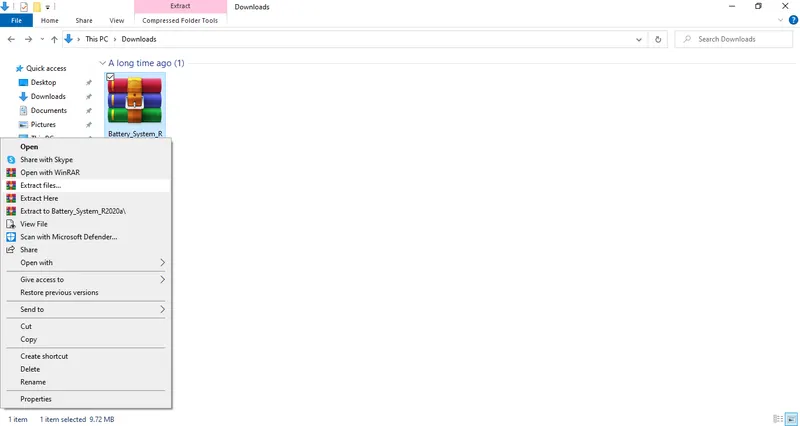
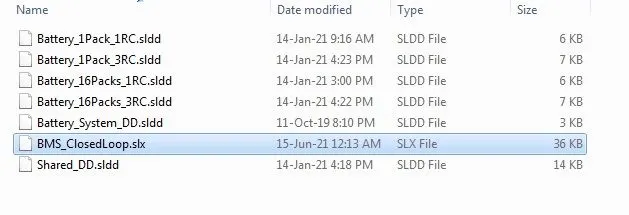
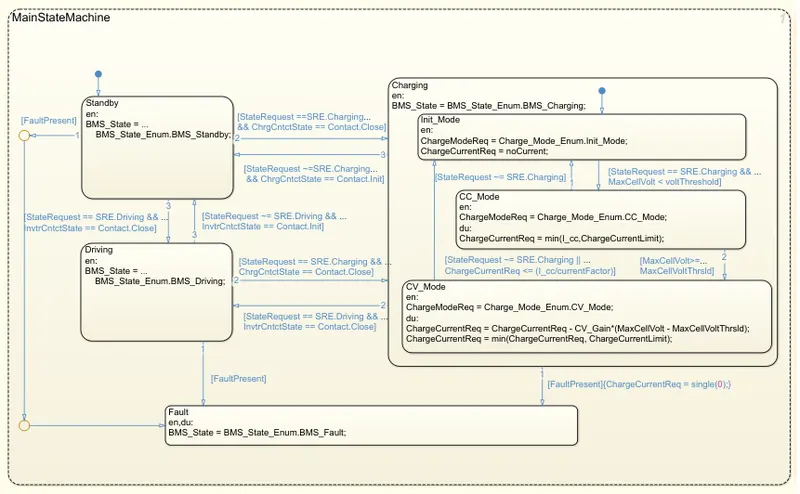
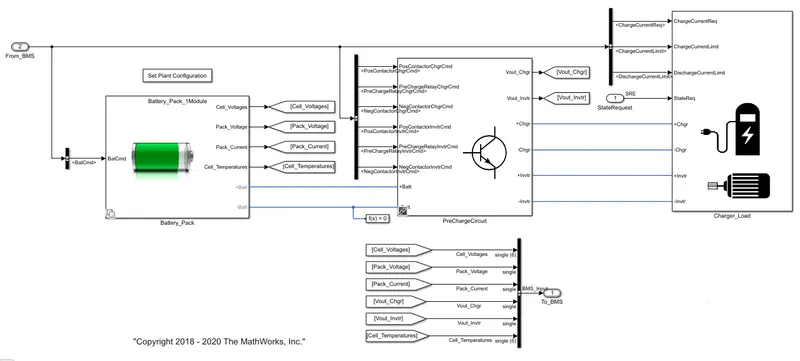
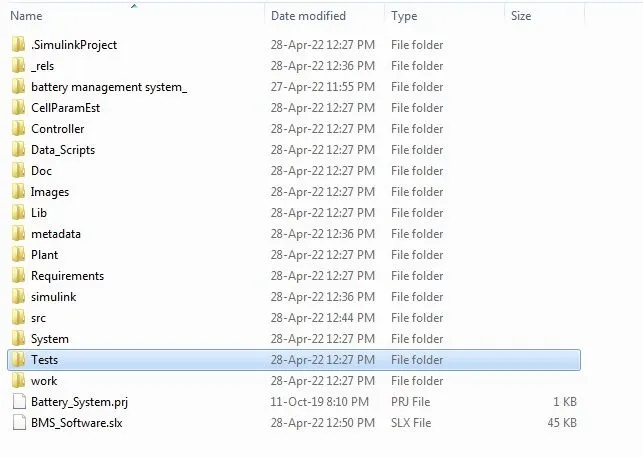


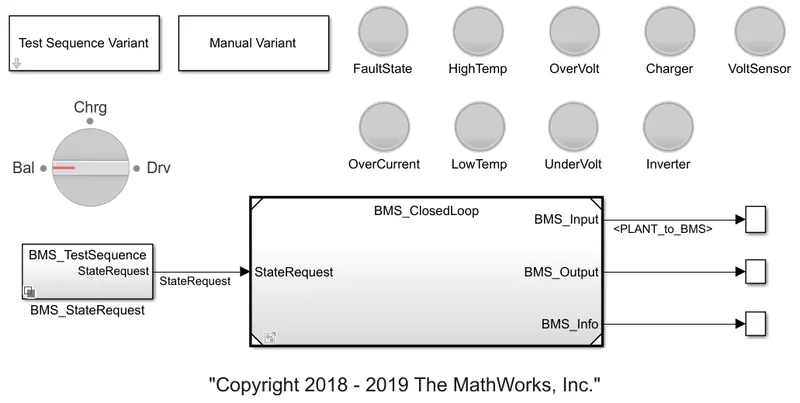
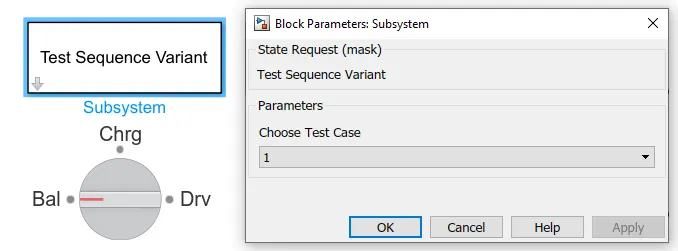
- Here is a selection of the 3 test conditions, we can be selected via the Test Sequence Variant block which allows us to select which test needs to be simulated.
- The first variant was selected initially for the simulation which can be seen above.
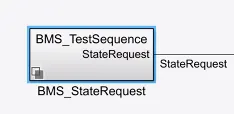
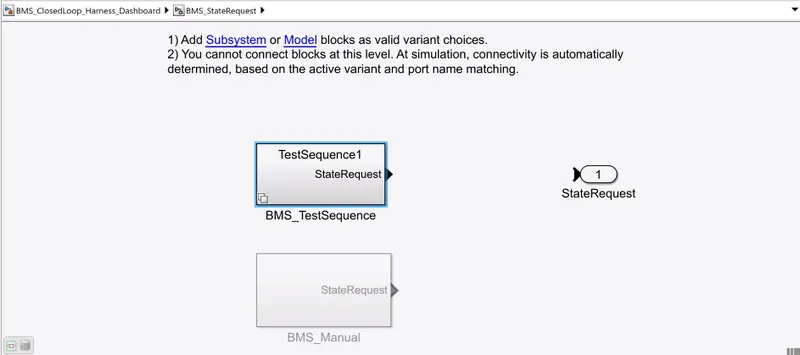
- After the selection of the test sequence variant, Above we see it in the BMS_Test Sequence Block.
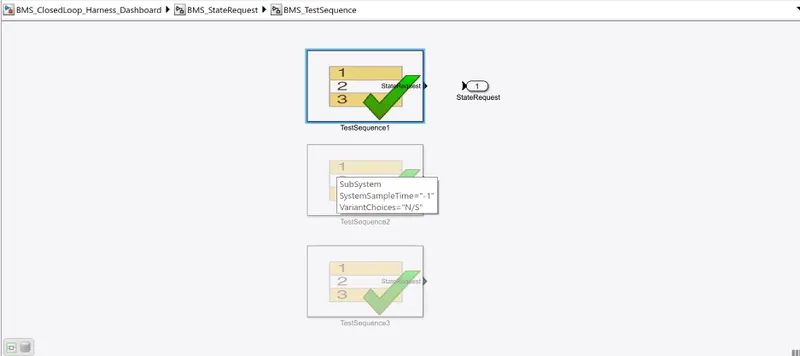
- Here inside the BMS test Sequence, we observe that 1 Test Sequence is selected automatically when we select the test case as 1.
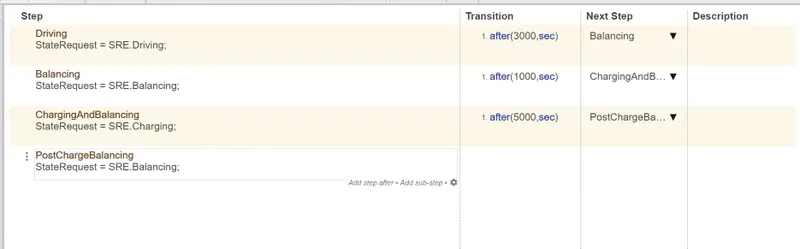
- As we look at the test variant, as shown above, it states that at the start of the simulation the model will be in the driving condition, thereafter 3000 seconds it will be in balancing mode, and after 1000 seconds it will be in charging and balancing mode and after 5000 seconds it will be in post-charge balancing mode.
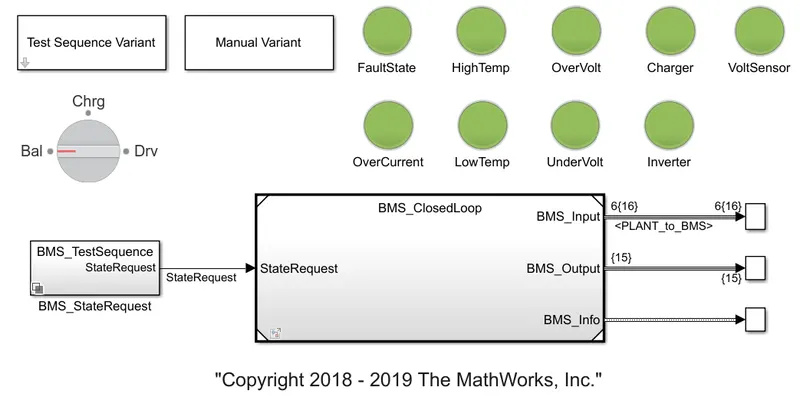
- Here we can see all the lights have turned green as there is no fault or errors in the model.
Output Result -
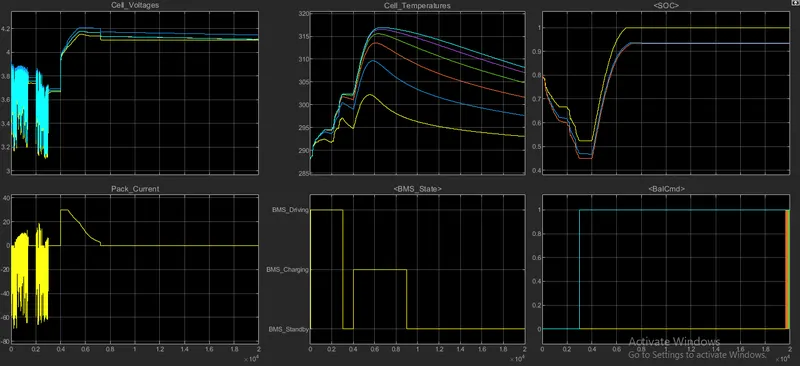
In the above plot, we can observe the parameters like Cell voltage, temperatures, SOC, total pack current, BMS state, and Bal cmd.
- In the first plot, we can observe that from the initial stage to 3000 seconds it is in driving mode, so there are voltage fluctuations according to the driving conditions. The voltage varies between 3.2-3.8V. The nominal voltage of each block is 3.7V. So the maximum variations happened in between those limits. From 3000-4000 seconds the vehicle is in a Balancing state, in this mode, the voltage of the cells settles at its nominal voltage which is 3.7V. At 4000 sec the voltage is in increasing mode because after 4000seconds the mode will enter to charging and balancing state for 5000sec means till 9000sec, in this mode the cells get charged. So it reaches its full charging voltage i.e, 4.2V, and next, it enters postcharge balancing mode where all the voltages get settled to around 4.1V.
- In the second plot, we can observe temperature variations in each cell. So again coming to the modes of operation. That is at driving mode 0-3000 sec the temperature of cells starts increasing according to the drive cycle. In balancing conditions i.e, 3000-4000sec the temperature of the cells decreases gradually. After that charging and balancing mode will start from 4000-9000sec, where the temperature again starts increasing during charging and then starts decreasing for balancing mode. After that, there will be only slight decrement in the cell temperatures as it indicates the postcharge balancing mode.
- This plot shows the SOC changes according to the transition of the modes. In the driving mode the SOC(state of charge) decreases from 80% to 45%. In the balancing mode, the SOC gets settled at 45%. After that charging and balancing mode will activate, where the cells get charged so the SOC will increases to 100% and then settles at full mode in the postcharge balancing condition.
- In this plot we can observe the total pack current, initially in the driving mode, we can see the changes in current value according to the drive cycle. It varies from around -70A to 10A. When the vehicle enters into balancing mode then the current of the pack settles at zero. And when charging and balancing mode activates, the pack current will starts increasing it is around 30A and then gradually start decreasing to 0A. Later on, settles at 0A as the vehicle enters into postcharge balancing mode.
- This plot shows the BMS state. Like in which state the BMS is operating. We can see that on the y-axis, three modes are pointed which are Driving, Charging, and Standby. In driving mode i.e, till 3000sec the plot is at the driving point. After that for 1000sec i.e till 4000sec, it will be in standby position as it is in balancing mode. Then till 9000 sec, it represents charging mode. Then it will settle at the standby position which represents the post charging balancing mode.
- This plot shows balancing commands. Lie when the balancing mode activates then the plot reaches to 1. So according to the balancing commands, the plots will settle.
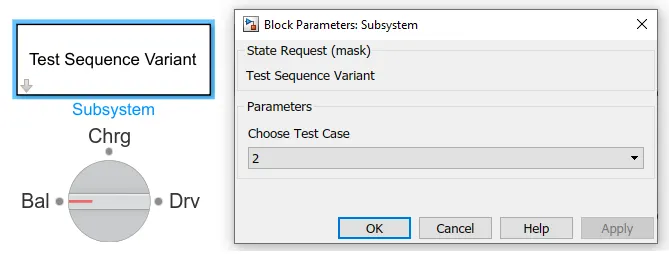
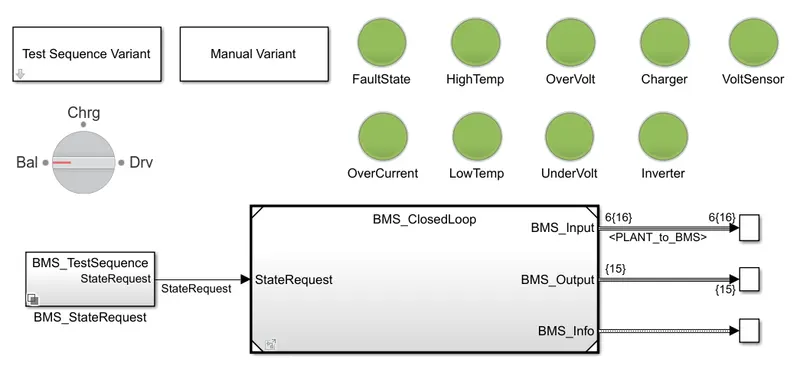
- The second variant was selected initially for the next simulation which can be seen above.
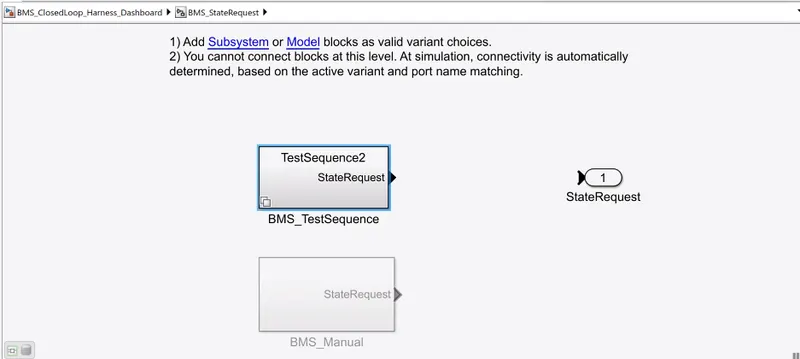
- After the selection of the test sequence variant, Above we see it in the BMS_Test Sequence Block.
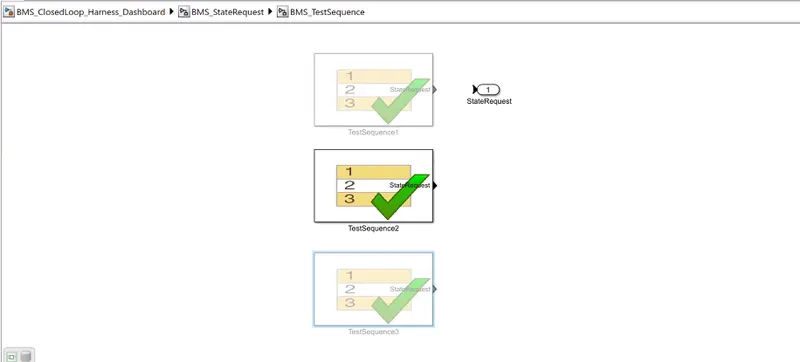
- Here inside the BMS test Sequence, we observe that the 2 Test Sequence is selected automatically when we select the test case as 2.

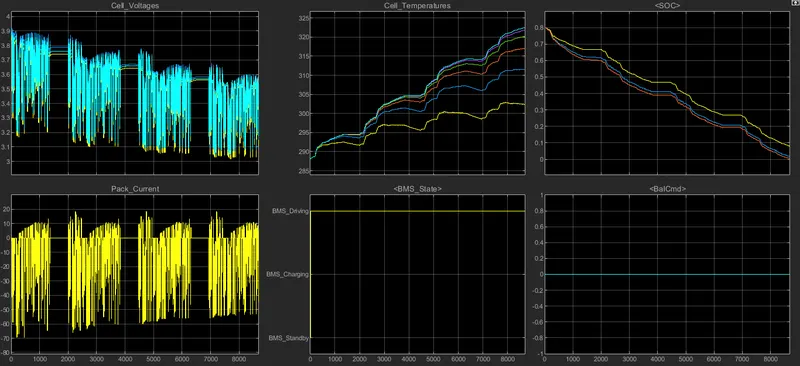
- From the first plot, we can say that it is in the complete driving mode so there are many variations according to the drive cycle. Here the voltage level is varying from 3.2-3.9V initially. But due to the continuous driving, there is a gradual decrease in the voltage ranges also so we can see that at the end the voltage varies between around 3.1-3.7V.
- In the second plot, we can see the temperature of the six cells. As the vehicle is in driving mode, the temperature is continuously increasing due to the high running time.
- From the SOC plot, we can observe that the SOC is initially at 80% while driving the SOC starts discharging, even though there are charge and discharge conditions in the driving mode the running time is high so the SOC is reached 0% at 8692seconds. So it's not even completed its driving duration also. Which we have set for 10000sec. So all the plot stops at that time because at 0% SOC the vehicle stops then there are no other changes.
- In the pack current plot, we can see the current variations according to the drive cycle. Initially, it is varying between -70A to 15A. But to the long running time, the current value also comes to around -55A to 20A. And it ends after SOC reaches to 0% as there is no charge to supply.
- This plot shows the BMS state of operation. As we discussed till now we have only seen the driving mode. So that is why the plot maintains its consistency in Driving mode.
- In the last plot, we can see the Balcmd. Since there is no balancing mode it settles at 0 only.
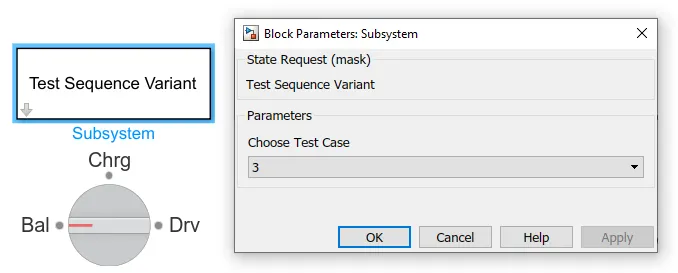
- The third variant was selected initially for the simulation which can be seen above.
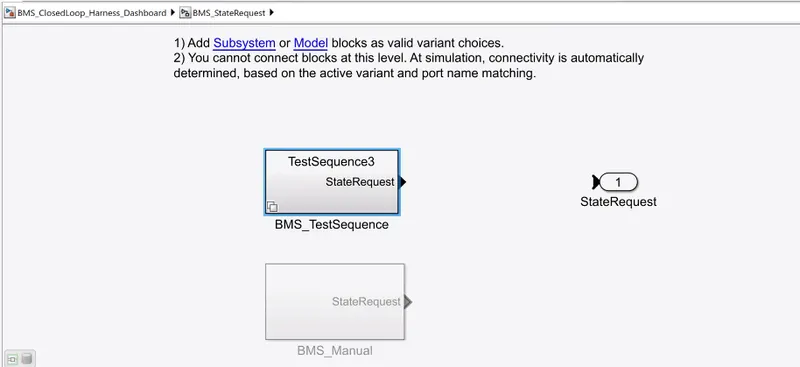
- After the selection of the test sequence variant, Above we see it in the BMS_Test Sequence Block.
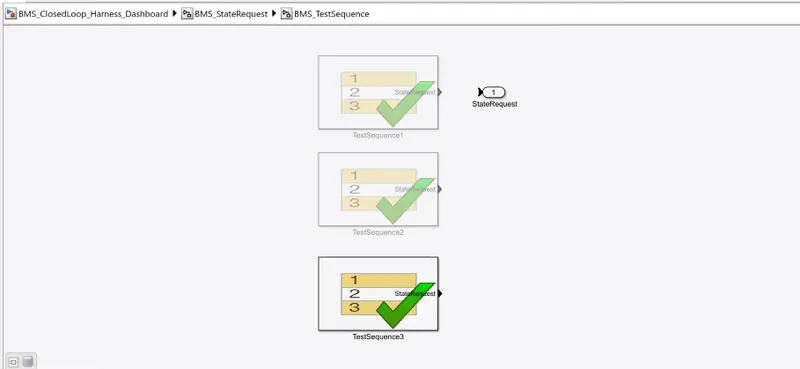
- Here inside the BMS test Sequence, we observe that the 3 Test Sequence is selected automatically when we select the test case as 3.

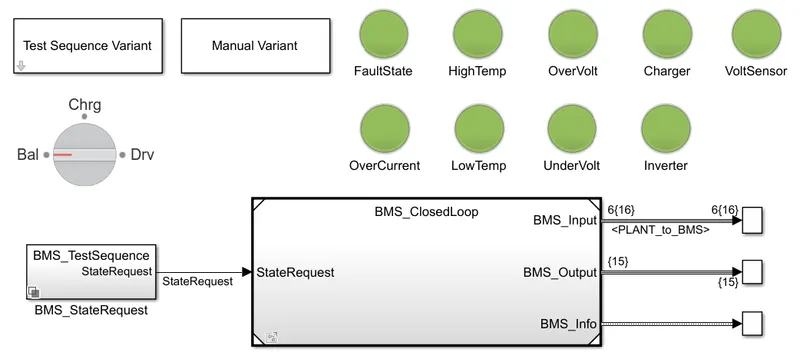
- Here we can see all the lights have turned green as there is no fault or errors in the model.
Output Result -
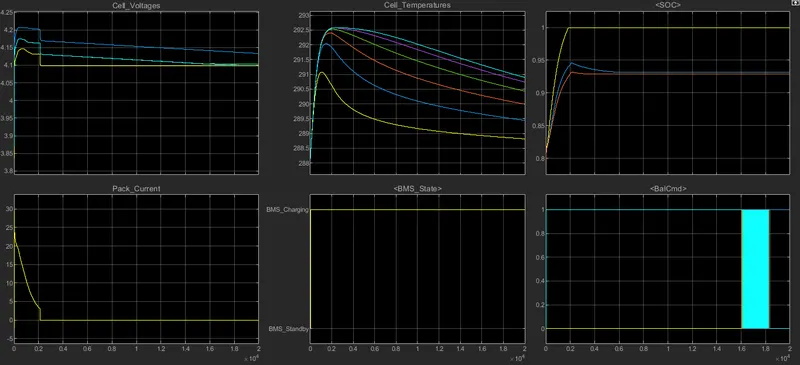
From the above plot, the following observations have been identified. Before explaining the plots it should note that here only 1 mode is happening that is at charging mode. This is as we set in the test sequence3.
- So from the first plot, we can see that it reaches to full load voltage which is 4.2V, and then a small decrease to 4.1V and maintained that value throughout the simulation. As this is only charging mode there is no change in the voltage of the cell.
- From the temperature plot, it can be observed that while the battery is in charging condition there is an increment in the temperature of the cells. But after the battery is fully charged the temperature values are quietly settled at normal temperature.
- In the SOC plot, we can observe that it is charged from 80% to 100% in 2000seconds and then it maintains its constant 100% throughout the simulation.
- From the pack current plot, it can be said that, while the battery is in charging mode there is a rise in current from 0A to 20A, but after the battery gets fully charged the pack current comes to 0A and then settled.
- The mode in this case is only charging so the BMS state plot shows only the charging mode.
- As there is only a charging mode, the balancing mode maintains at 1. Which shows in the last plot.
Coulomb Counting Method:
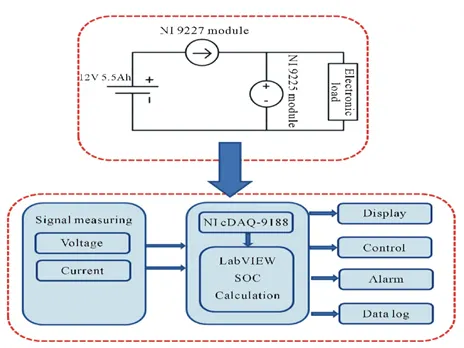
The Coulomb counting method estimates SOC by measuring the discharge current of a battery and integrating it over time. The SOC(t), which is determined using the discharging current, I(t), and previously estimated SOC values, SOC, is calculated using the Coulomb counting technique (t-1). The following equation is used to determine SOC:

But there are several factors that affect the accuracy of the Coulomb counting method including temperature, battery history, discharge current, and life cycle. The coulomb counting method depends on the recording of the current noise only. The signal is filtered with a high pass filter with a cut-off frequency of 0.01Hz. The filter may be either analog or digital. The absolute value of the measured current samples is then summed over time. A steep slope is taken as an indication of rapid corrosion, although it is not possible to calibrate this in terms of an estimated corrosion rate.
Modified Coulomb Counting method:
To improve the Coulomb counting method, a new technique called the modified Coulomb counting method is proposed. The modified Coulomb counting method uses the corrected current to improve the accuracy of estimation. The corrected current is the function of discharging current. There is a quadratic relationship between the corrected current and discharging current of the battery. By the practice of experimental data, the corrected current is calculated by the following formula,

where k1, k2, and k0 are constant values that are obtained from the practice experimental data. In modified Coulomb counting method, This method employs battery current readings mathematically integrated over the usage period to calculate SOC by the following equation,
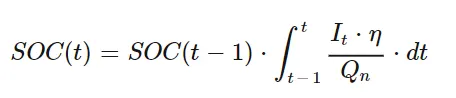
where,
SOC(t-1) = SOC at previous time step,
η = Efficiency,
t = Current time step,
Q = Charge capacity of the battery.
The experimental results show that the accuracy of the modified Coulomb counting method is superior to the conventional Coulomb counting method. The Coulomb counting method then calculates the remaining capacity simply by accumulating the charge transferred in or out of the battery.
How BMS implements coulomb counting for SOC estimation in the above model:
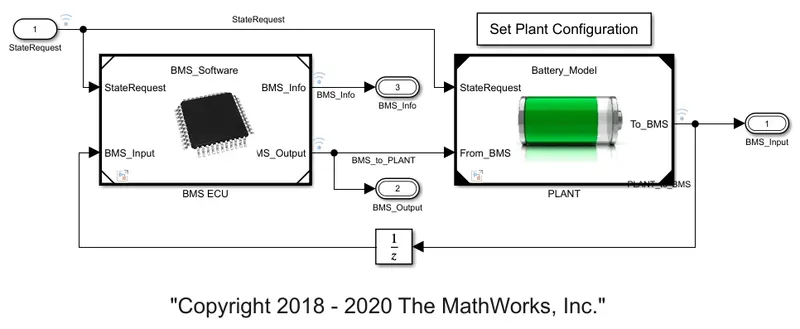
BMS implements coulomb counting for SOC estimation in the above, which we can observe in the BMS ECU block. This can be opened by clicking on the BMS_system. The following model will appear if we click on the model.
In the above block, we can see the subsystem of BMS ECU which takes the state request and perform the respective operations and then gives the information to the Plant of the battery pack. So if we click on the BMS ECU block we can see the following subsystems.
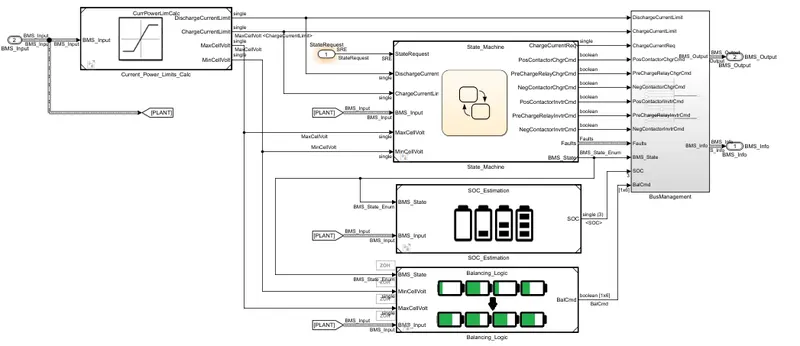
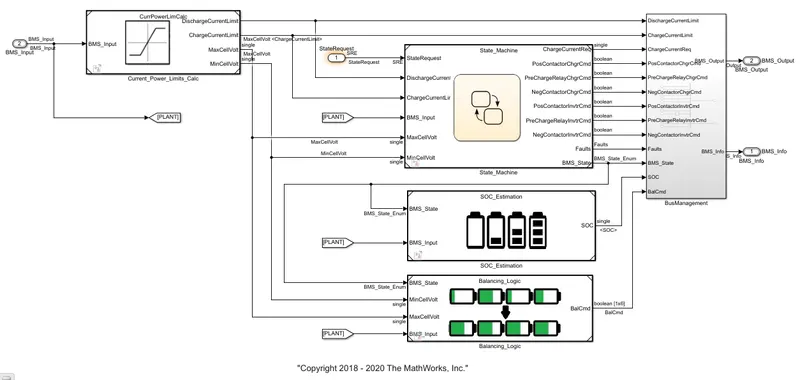
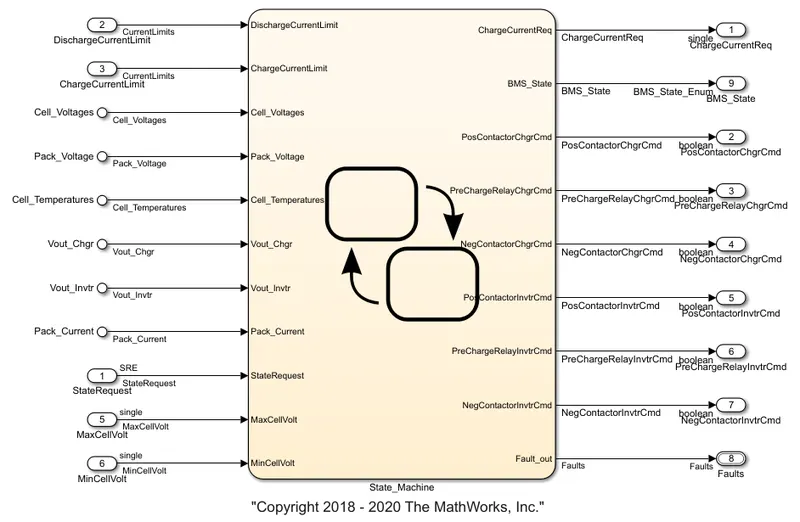
There we can see the current power limits subsystem, state machine, SOC estimation, Balancing logic, and BMS controller. Here, after performing the respective operation the total information will be given to the BMS management which will further process the data. The SOC estimation subsystem will perform all the required formulas or methods to calculate the SOC of the vehicle. And will give this to BMS management from there it will give us the indication. If we open the SOC estimation then the following modeling will appear.
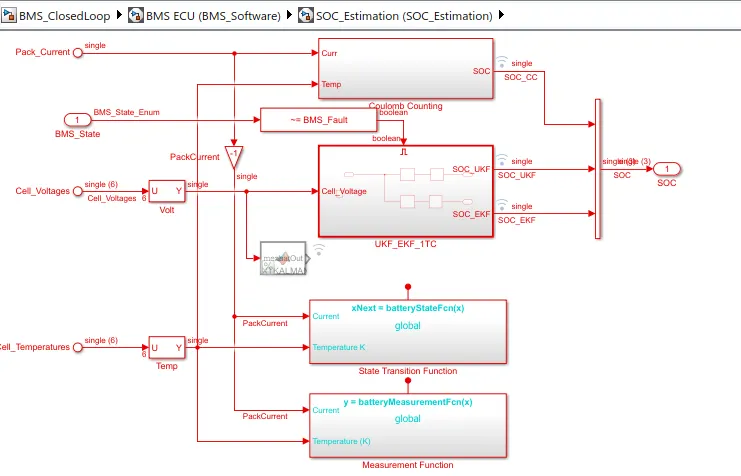
In this subsystem, we can see various methods to estimate the SOC. In this, the first block represents the coulomb counting method. Using the method we will estimate the SOC. If we open that subsystem we can observe what is happening or what blocks we have taken to estimate SOC and all. The following figure shows the the system under Coulomb counting method.
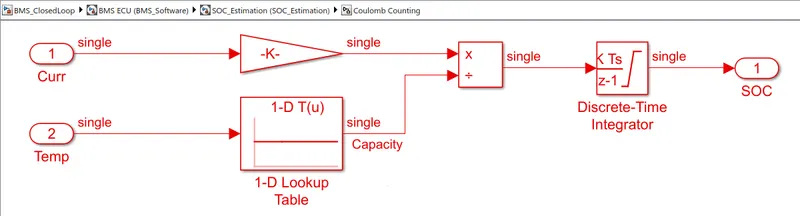
So here we are taking the current and temperature parameters of the cells and giving them to the gain block and 1-D lookup table respectively. Where the lookup table gives the capacity over time. The capacity will vary with respect to the temperature so that is why we have taken the temperature as input to the look-up table. Now, these outputs from the gain block and look-up table are given to the product block, where the gain is multiplied means the current with respect to gain is multiplied. And the capacity has been integrated. That output is given to the discrete-time integrator block, it performs the integration operation and gives the value of SOC. As we discussed before it applies the formula here over the current and capacity.
The Coulomb counting method is associated with monitoring the input and the output current continuously. Since capacity is the integral of current with respect to time, by measuring the input and the output current, change in capacity or capacity degradation of a battery can be measured easily. In this method, we calculated by dividing the measured capacity(after discharging the battery to 0% SOC value) by its rated capacity. It is an extensively used method by researchers for its simplicity. But, the accuracy of this method is not very high. The main advantage of Coulomb counting is its simplicity, easy implementation, and low computational cost.
- We have simulated The Battery Management System Model and the output is studied based on the given test conditions.
- Coulomb Counting method to estimate the state of charge is explained along with the Simulink model in the BMS system.