Week 7 State of charge estimation
BATTERY MANAGEMENT ALGORITHMS
Inorder to test the battery management of the system, an effective algorithm is developed and is then allowed to predict the characteristics of the battery. The mathwork file in the given link test a 6 cell battery block and a 16 module battery pack and calculate the voltage, pack current, cell temperature and SoC estimation. Along with testing, fault detection setup is developed to identify any failure such as over current or under current scenario or conditions like high cell temperature. The dashboard of the given model is shown as:
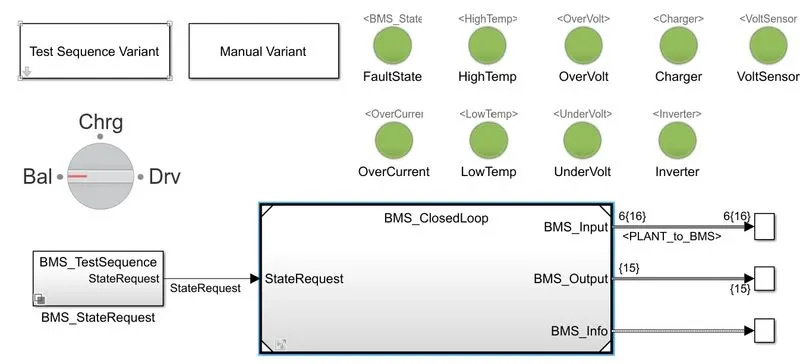
On the left upper corner is the testing condition block with one having the conditions being preset and moves along through the predetermined stages as determined through a state machine algorithm. The Manual Variant works solely on the conditions that are induced artificailly by moving the knob through three modes of cell balancing, Charging and Driving.
The green light indicators gives the information where the system has reached the critical limit. The BMS state request takes in the selected mode of operation either from the test sequqence variant or from manual variant. The BMS closedLoop block contains the BMS software information and battery block and the characterisitics are obtained as the output.
The BMS closedLoop block contains the following blocks as shown in the figure:
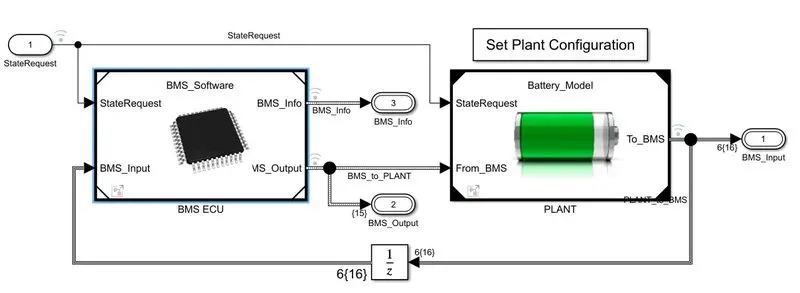
This block is a feedback system taking the BMS input from the output of the PLANT block. The BMS software and the PLANT recieves the stateRequest selected and modules information with the help of the two subsystems. BMS ECU gives the input into the plant and the plant output is given as the BMS input making it a feedback system. The BMS Software block can be given as:
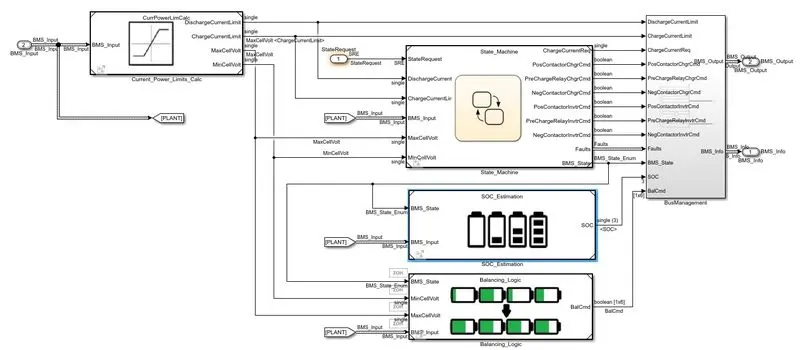
The current power limiter block calculates the limiting current of various conditions produced during the battery operation. The block compares the rise or drop of current when battery is run at extreme conditions such as high temeprature situations or at low voltage condition and gives the limit value to effectively manage the battery at such situations.
The State machine block contains the information regarding the operation at various states like cell balancing or driving or standby mode and travels through these conditions according to the pre set automatic cycles or using manual modes.
The SOC estimation block contains the SoC estimation methods like the conventional current integration method, Unscented Kalman filter method and Extended Kalman filter method for estimation of SoC.
The battery undergoes passive balancing for cell balancing.
The battery logic block is the block that actually conducts the cell balancing techniques. This helps in the optimal performance of the battery pack. The Battery logic block can be given as:
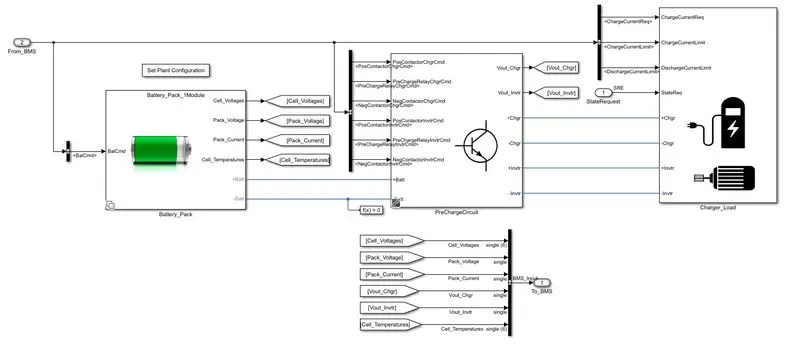
The battery pack model contains 2 modules variants namely the 1 module pack and 16 module pack. The Prechargercircuit block contains the circuit model required for proper charging of the cell. This contains elements such as resistor and relay that protects the cell from surge curents at the intial stage of connecting the charger to the cell.
The charger and load block contains the charger block and load block that takes in the current request and runs through the state machine algorithm to product output current in its output.
There are 3 different test scenarios:
- Test 1
The conditions and the state machine operations that happen in test 1 type is obtained from the BMS State_Request block. The conditions of operation at these points are:
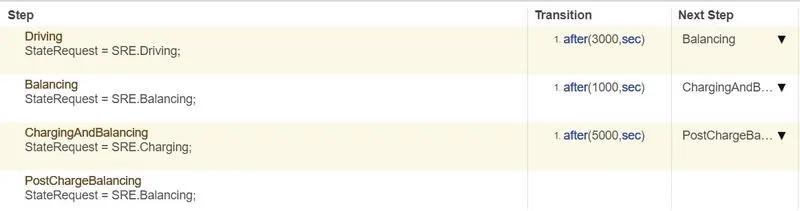
The above condition is preset and the battery model of 1 module is selected to run the simulation. During the simulation no green lights in the dshboard changed the colour to red indicating that no error was found during its execution. The test result is obtained on the graph as given below:
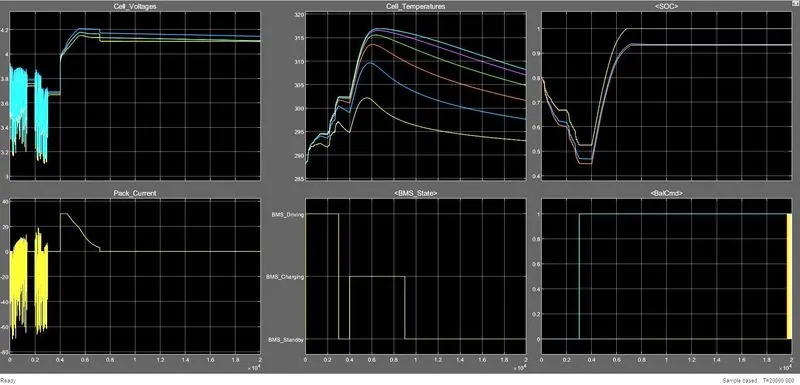
From the above graph following observations can be made:
- The dashboard recorded no fault signals furing the execution of test sequence in test 1 mode
- Cell voltage of the cells are in an highly unbalanced state before reaching 3000s mark as visible spiking of cell voltage can be seen.
- The intital SoC of the pack is around 80 %
- The corresponding variation of cell voltage is obtained in the pack current measurement as well.
- For the first 3000s the drive mode is the pre set condition during which there is no charging and causes SoC to decrease as obtained in the figure
- After 3000 s the cell balancing is turned on along and the mode now shifts to charging and balancing but the state machine algorithm pushes it to go through standby mode to for a duration of 1000s ending its operating at the marks of 4000s.
- After 4000s , a CC charge is executed for about 1000s after which a CV charging take place until reaching the maximum SoC
- After 4000s the cell charging and balancing last for 5000s around which the SoC values have reached the maximum and after which the SoC values are maintained same over the period of time for the rest of the cycle using the cell balancing command.
- The cell temperature is highest recorded in the cell number 6 which is farthest away from the atmsoheric contact area therby reducing its capacity to cool via convection. Whereas the cell 1 is the one that is exposed to the environmnet hence has the highest temperature peak due to the cooling due to natural convection.
- Test 2
The test 2 option is selected from the test sequence variant block and is allowed to run the simulation. The conditions for the test 2 is obtained as :

The result obtained from the test are as follows:
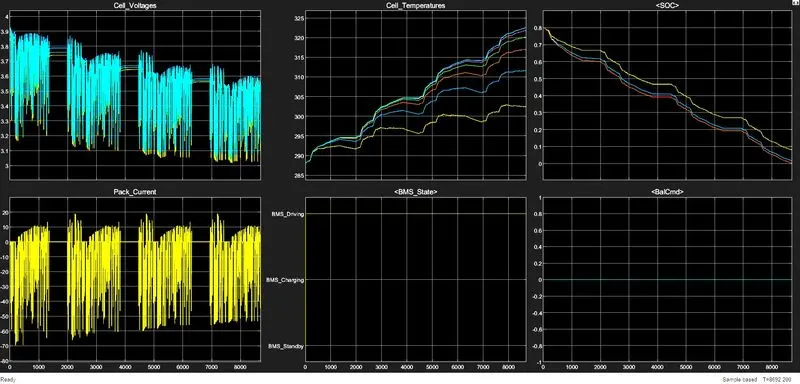
The following observations are made from the result
- No fault signal was recorded during the simulation of test 2.
- Since the condition is pure drive till 10000 s , the cell balancing command is not given and hence the pack current and pack voltage values flectautes throughout the run time.
- The intial value of SoC is around 80 %
- The cell temperature of every cell drastically increases due to the repeated running of the cell recording temeprature as high as 320 K for cell 6.
- Notice that that SoC calaculation for the estimation using UKF and EKF has given an accurate measurement of 0 SoC point around 8692.2 s, whereas the convential SoC estimation hasnt yet reached the zero value point.
- The SoC depletion to zero point thus terminated the testing phase even before reaching a 10000s value since there is no energy left for the module to supply.
- Balancing command returns zero value throughout the cycle and the simulation ends before 10000s value point.
- Test 3
The test 3 is selected from the test sequence variance block . The condition for test 3 are as shown below:

For test 3 sequence there is only pure charging state throughout the time. The results obtained are as shown below:
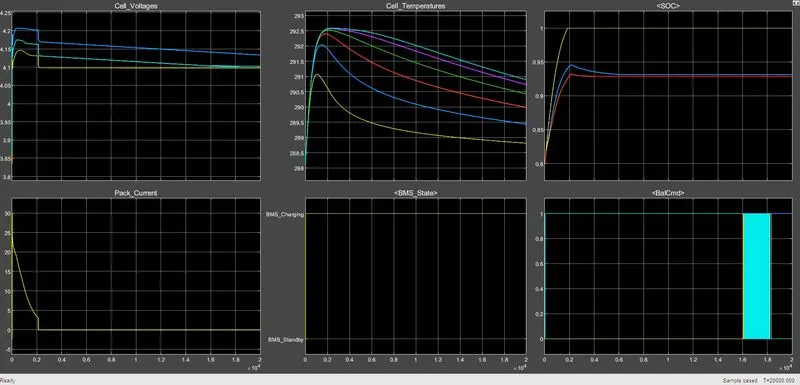
From the above graph following observations are made:
- No fault was recorded from the dashboard
- The cell SoC has drastically increased from 80 percentage to maximum value within a short period of time (around 2000s)
- The cell balancing starts from the begining of simulation itself hence it is noticed that the cell voltages seems to converge to a voltage value.
- The UKF and EKF methods estimated SoC around 0.95 at end of charging cycle point whereas for conventional method, the value has reached 1.
- The maximum cell temperature recorded was below 293 K .
Similar test can also be done on 16 module type battery block as well. Also instead of using a pre set test sequence, the manual variant can be run and various situations can be created by rotating the knob through three different state points of driving, cell balancing and charging to emulate a real world driving situation.
Coloumb Counting
The Coulomb counting method measures the discharging current of a battery and integrates the discharging current over time in order to estimate SOC. The SOC is calculated using the following equation:
`SoC_((t))=SoC_((t-1)) +(I_((t))/Q_(n))*Deltat`, wher`
`SoC_((t))` is the Soc at the time instant of 't' seconds
`SoC_((t-1))` is the SoC value measured at time (t-1) seconds
`I_((t))` is the discharge current at t seconds
`Q_((n))`is the maximum possible discharge capacity
`Deltat` is the change in time.
The coloumb counting is calculated using a dedicated block inside the BMS software blockset.The blockset is given as:
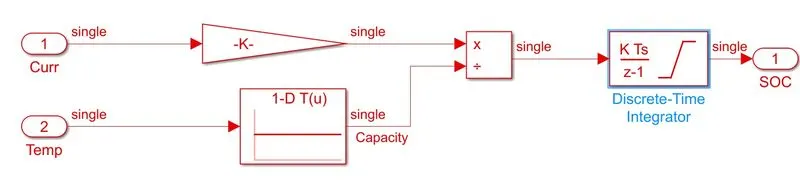
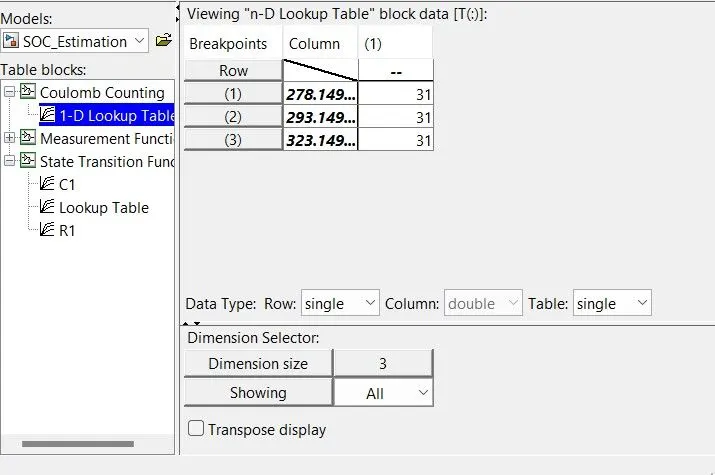
here using the temperature data provided, the look up data calculates the maximum possible capacity at a givne temperature. the lookup table is given as :
The pack current measured is then divided by a gain block of 1/3600 converting it from Ah to As or Coloumb. Then the SoC equation of `(Avail.Capacity)/(Max. Capacity)`, This gives the Soc for a given point of time only. This obtained value is integrated using a discreet time integrator. the discreet integral block is given as:
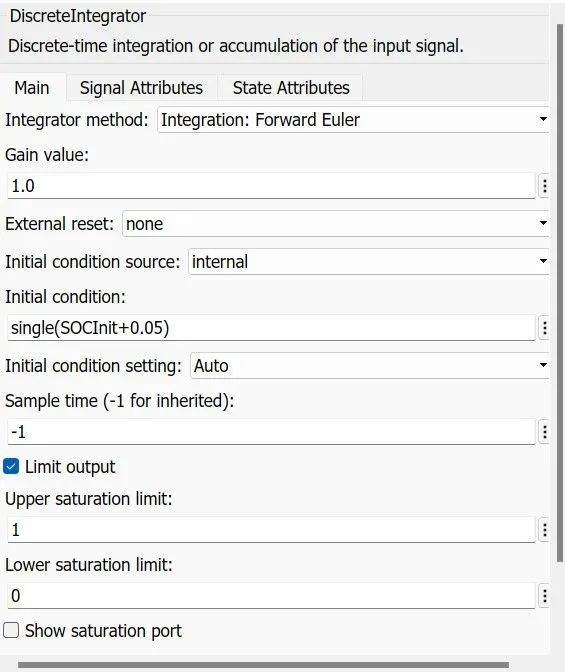
Once this integrates, the SoC curve change detected during the entire time period can be calculated and plot into the curve. However due to the lack of feedback loop, the coloumb counting method is not the accurate method to measure SoC.
Better methods such as UKF and EXF that can take in and correct theSoC value since the BMS fault signals are available.