Project 1 - Parsing NASA thermodynamic data
During practical applications, various outputs for systems are calculated by sensors and other data acquisition devices. During the delivery of output, the results maybe obtained in a preset format one assigned specific to the given device. Hence inorder to make meaningful results out of the data, it is important to seperate useful datapoints from the output recieved either from text file or data file or excel format.
The NASA thermal data contains values of many species and the corresponding data values such as temperature ranges, coeffiecients etc. Hence norder to study the properties of the various species, it is important to read the data from the file and plot the graphs for knowing its characteristics and different temperature conditions.
The 14 coefficients collected are important for knowing the variations in Specific heat, enthalpy and entropy w.r.t temperature. Their relation can be given as
`(Cp)/R=a1+a2.T+a3.T^2+a4.T^3+a5.T^4` where Cp is the specific heat and T is the temperature
`H/(R.T)=a1+a2.T/2+a3.T^2/2+a4.T^3/4+a5.T^4/5+(a6)/T` where H is the enthalpy
`S/R=a1.lnT+a2.T+a3.T^2/2+a4.T^3/3+a5.T^4/4+a7`where S is the entrop`
SORTING OF DATA FROM THE GIVEN DATA FILE FOR CALCULATIONS
Here a1 to a7 represent the coefficients. In the given dataset there are 14 coefficients, which corresponds to the values obtained at high temperature condition and low temperature condition. The first seven are corresponding to high temperature condition and the next seven are of low temperature condition.
Now while looking at data set , the points noticed are
- There are in total of 218 lines in the text file.
- The second line of the dataset contains the values of global temperature range
- For every line ending with the character '1', the line contains the name of species as its first character, and the last 3 characters are the local low temperature, local high temperature and local mid temperature.
- For every line ending with characters '2','3','4' contains the 14 coefficients of each species.
- Every coefiicient is represented as a power of 'E'
Hence inorder to extract the data
- seperate out lines that end with character '1'
- store the first character of these lines as species name and last three characters as it local temperature range
- seperate out other lines that end with '2','3' and '4'
- Locate the position of 'E' and use the position of E as an index to obtain the values of each coefficient.
function [data,local_lowtemp,local_hightemp,local_midtemp,species]=datafunc(z) % Searching for lines that end with the number '1', and taking the first % character in the line which is the species name pat=["1"]; t=endsWith(z,pat); target=0; index=find(t>target); for i0=1:length(index) yp0=index(i0); yt0(i0)=z(yp0); end % taking the first character of every line that ends with 1 and storing it % to array 'species' for i1=1:length(yt0) s1=string(yt0(i1)); s2=strsplit(s1,' '); species{i1}=s2{1}; end % Skipping through first five lines that contain header, global temperature % data and comments f2=fopen('THERMO.dat'); for k1=1:5 fgetl(f2); end % reading through the file line by line and searching for the species names % at each part of the file % here e is a logical array that returns 0 or 1 depending whether the % condition is met or not % hence wherever the file encounters species names stored in species in the % lines stored in z1, it will return a value of 1, thereby sperating the % positions in the file where there a line contains only datapoints and % line where it contains species details for i1=1:212 z1{i1}=fgetl(f2); v=contains(z1,species); end X = v; target = 0; ind = find(X > target); % locating the position of 'species' in the read file % After locating the species name's location, locating the position of % local temperature values and storing them to different variables for i2=1:length(ind) yp=ind(i2); yt(i2)=z1(yp); tline=string(yt(i2)); A=strsplit(tline,' '); local_lowtemp{i2}=(A{end-3}); local_midtemp{i2}=(A{end-1}); local_hightemp{i2}=(A{end-2}); end % since e is logical array containing 1 and 0 , where 1 is the location % wherever species name is found, 0 's will be corresponding to lines wherever % no species name is detected, ie. data values Y=v; target1=1; inde=find(Y < target1); for i3=1:length(inde) yp1=inde(i3); yt1(i3)=z1(yp1); end % Here yt1 will be a array containing only datapoints % the lines are distinct from each other since the data value lines ends % with '2' or '3' or '4'. % Now from the file yt1 which contains all datapoints line only, is % compared with line ending with a pattern ie.'2' pat1=["2"]; yt2=endsWith(yt1,pat1); target2=0; inde1=find(yt2 > target2); % Now all lines that ends with the number '2' is now stored in the array % yt3 for i4=1:length(inde1) yp2=inde1(i4); yt3(i4)=yt1(yp2); end % from yt3, each datapoints are seperated by finding the location of 'E' % and manipulating it to obtain data of lines that end with 2 % Here a1 array contains all the first data values of line that endswith 2 % and a2 contains the rest of the 5 data values. for m=1:length(yt3) rt=char(yt3(m)); inde2=strfind(rt,'E'); a1(m)=cellstr(rt(1:inde2(1)+3)); for jj=1:length(inde2)-1 a2{m}{jj}=rt(inde2(jj)+4:inde2(jj+1)+3); A1{jj,m}=[a2{m}{jj}]'; end end % Now similar method is used for finding values from lines ending with 3 % and 4 pat2=["3"]; yt4=endsWith(yt1,pat2); target3=0; inde3=find(yt4 > target3); for i5=1:length(inde3) yp3=inde3(i5); yt5(i5)=yt1(yp3); end for n=1:length(yt5) rt1=char(yt5(n)); inde4=strfind(rt1,'E'); b1(n)=cellstr(rt1(1:inde4(1)+3)); for ff=1:length(inde4)-1 b2{n}{ff}=rt1(inde4(ff)+4:inde4(ff+1)+3); B2{ff,n}=[b2{n}{ff}]'; end end pat3=["4"]; yt6=endsWith(yt1,pat3); target4=0; inde5=find(yt6 > target4); for i6=1:length(inde5) yp4=inde5(i6); yt7(i6)=yt1(yp4); end for l=1:length(yt7) rt2=char(yt7(l)); inde6=strfind(rt2,'E'); c1(l)=cellstr(rt2(1:inde6(1)+3)); for oo=1:length(inde6)-1 c2{l}{oo}=rt2(inde6(oo)+4:inde6(oo+1)+3); C2{oo,l}=[c2{l}{oo}]'; end end % after obtaining the various values, the data is stored into an array, % with each row containing species names, temperature ranges from high to % low, and the 14 coefficients arranged in each row respectively data=vertcat(species,local_lowtemp,local_midtemp,local_hightemp,a1,A1,b1,B2,c1,C2);
By definig a function , each set of species and their corresponding values are sorted out. The results obtained are then stored inside the a variable data, where each values are stored in row wise manner
- first row contains species name
- second to fourth row contains local low temperature range, local mid temperature range and local high temperature range respectively.
- row 5 to the end stores coeffcients a1 to a14, for each species.
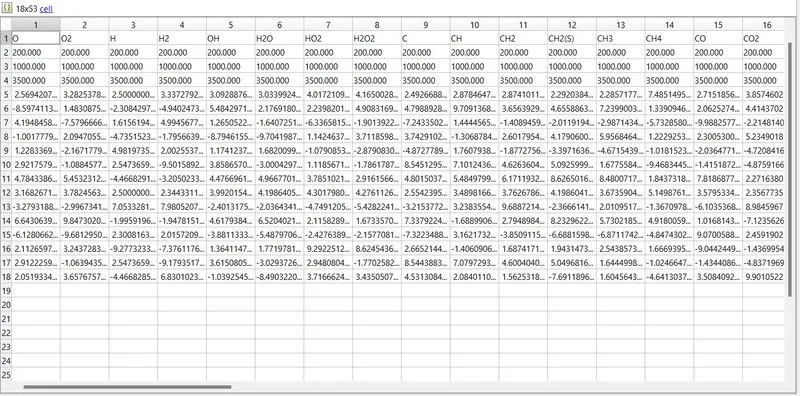
The above figure shows the data values obtained out using the program above.
PLOTTING OF CP,ENTHALPY AND ENTROPY
Now since each datasets are obtained for every species, we define a plotfunc to plot for all the values of different species , by inserting the coefficients in the equations provided .
In this function, the specific heat, enthalpy, entropy are calculated, then plot and are stored in respective files containing the species name.
function [CP,enthalpy,entropy]=plotfunc(local_lowtemp,local_hightemp,local_midtemp,data,species)

% For plotting, the datavalues are accessed from the data array, the
% various values of temperature and 14 coefficeints are stored into various
% arrays
R=8.314
LOW=str2double(cellstr(local_lowtemp));
HIGH=str2double(cellstr(local_hightemp));
MID=str2double(cellstr(local_midtemp));

% cof1 to cof7 are the high temperature coefficients, whereas cof8 to cof14
% are low temperature coefficients

        cof1=str2double(data(5,:));
        cof2=str2double(data(6,:));
        cof3=str2double(data(7,:));
        cof4=str2double(data(8,:));
        cof5=str2double(data(9,:));
        cof6=str2double(data(10,:));
        cof7=str2double(data(11,:));
        cof8=str2double(data(12,:));
        cof9=str2double(data(13,:));
        cof10=str2double(data(14,:));
        cof11=str2double(data(15,:));
        cof12=str2double(data(16,:));
        cof13=str2double(data(17,:));
        cof14=str2double(data(18,:));

% A temperature array is defined to plot for various values of CP , enthaly and entropy for 53 different species

for i7=1:length(species)

    T=linspace(HIGH(i7),LOW(i7),1000);


    for i8=1:length(T)

     % if loop is used to plot graphs for high temperature condition and low temperature condition

      if T(i8) >= MID(i7)

          D=R.*((cof1(i7))+((cof2(i7)).*T(i8))+((cof3(i7)).*((T(i8)).^2))+((cof4(i7)).*((T(i8)).^3))+((cof5(i7)).*((T(i8)).^4)));
          CP(i8)=D;

          ST=R.*T(i8).*(cof1(i7)+(1/2).*cof2(i7).*T(i8)+(1/3).*cof3(i7).*T(i8).^2+(1/4).*cof4(i7).*T(i8).^3+(1/5).*cof5(i7).*T(i8).^4.+cof6(i7)./T(i8));
          enthalpy(i8)=ST;

          F=R.*(cof1(i7).*log(T(i8))+cof2(i7).*T(i8)+(1/2).*cof3(i7).*T(i8).^2+(1/3).*cof4(i7).*T(i8).^3+(1/5).*cof5(i7).*T(i8).^4+cof7(i7));
          entropy(i8)=F;

        else
          D1=R.*(cof8(i7)+cof9(i7).*T(i8)+cof10(i7).*T(i8).^2+cof11(i7).*T(i8).^3+cof12(i7).*T(i8).^4);
          CP(i8)=D1;

          ST1=R.*T(i8).*(cof8(i7)+(1/2).*cof9(i7).*T(i8)+(1/3).*cof10(i7).*T(i8).^2+(1/4).*cof11(i7).*T(i8).^3+(1/5).*cof12(i7).*T(i8).^4+cof13(i7)./T(i8));
          enthalpy(i8)=ST1;

          F1=R.*(cof8(i7).*log(T(i8))+cof9(i7).*T(i8)+(1/2).*cof10(i7).*T(i8).^2+(1/3).*cof11(i7).*T(i8).^3+(1/4).*cof12(i7).*T(i8).^4+cof14(i7));
          entropy(i8)=F1;

      end
    end
% the Specific heat, enthaly and entropy of different species are
% calculated and stored in respective arrays

% Opening the folder to plot the graphs during each iteration of for loop
% mkdir makes the directory and a file with name of each species is made
% and opened in the directory

SPECIES=char(species(i7));
mkdir('C:\matlab2021\installation files\bin\thermalparsing',SPECIES)
cd(SPECIES)

% The plots for CP,enthalpy and entropy is plotted and stored into the file

      figure(1)
      plot(T,CP)
      grid on
      xlabel('Temperature(K)');
      ylabel('Specific heat at const.pressure (kJ/mol-K)');
      title(strcat(species(i7),' ','-',' ','Specific heat Vs T'))
      saveas(figure(1),'specific heat','jpeg');


      figure(2)
      plot(T,enthalpy);
      grid on
      xlabel('Temperature(K)');
      ylabel('Enthalpy (kJ/mol)');
      title(strcat(species(i7),' ','-','Enthalpy Vs T'))
      saveas(figure(2),'enthalpy','jpeg');

      figure(3)
      plot(T,entropy);
      grid on
      xlabel('Temperature(K)');
      ylabel('Entropy (kJ/mol-K)');
      title(strcat(species(i7),' ','-','Entropy Vs T'))
      saveas(figure(3),'entropy','jpeg');

      cd ..
 % cd returns the position to the parent folder

end
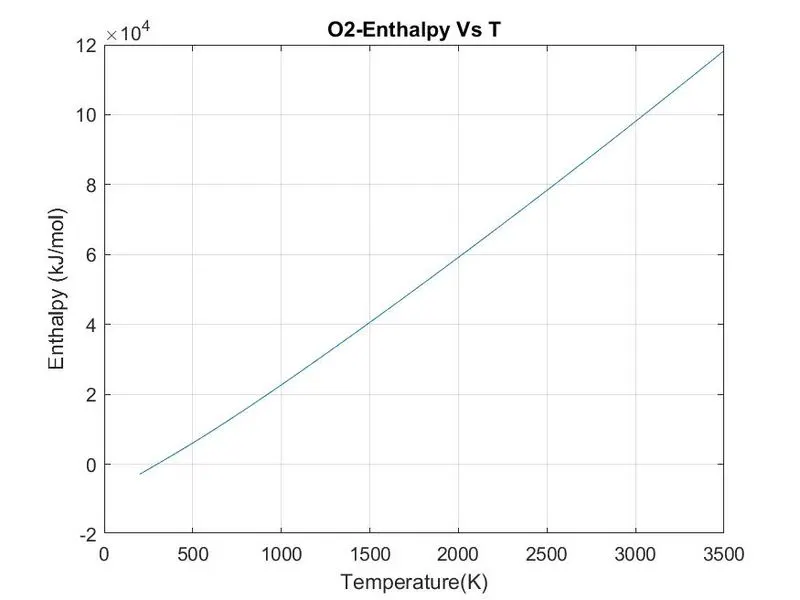
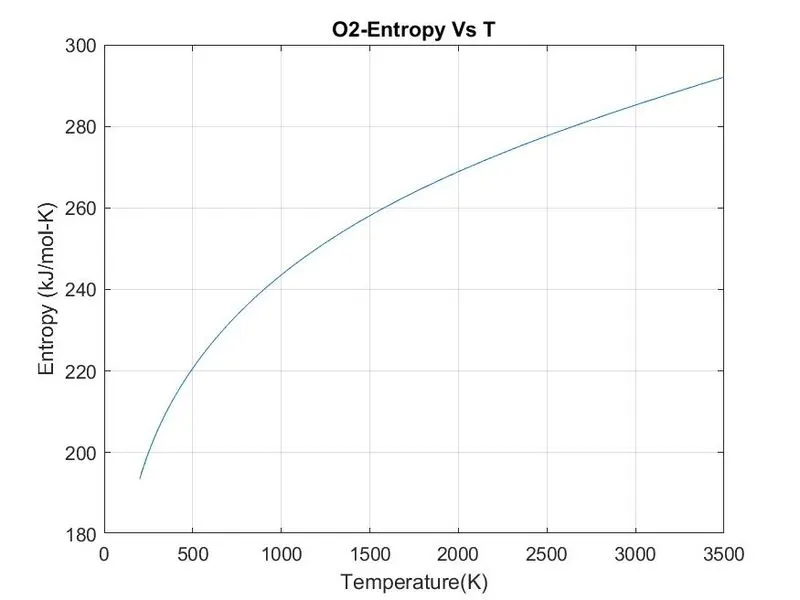
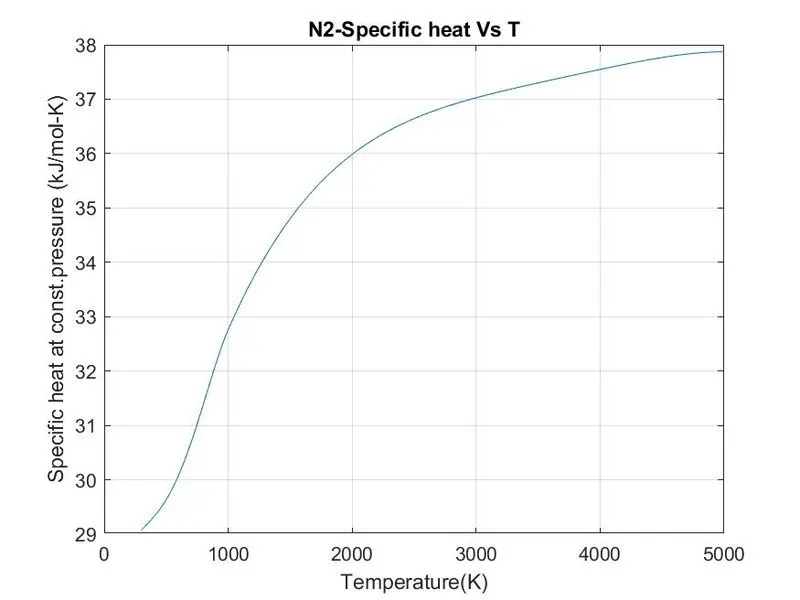
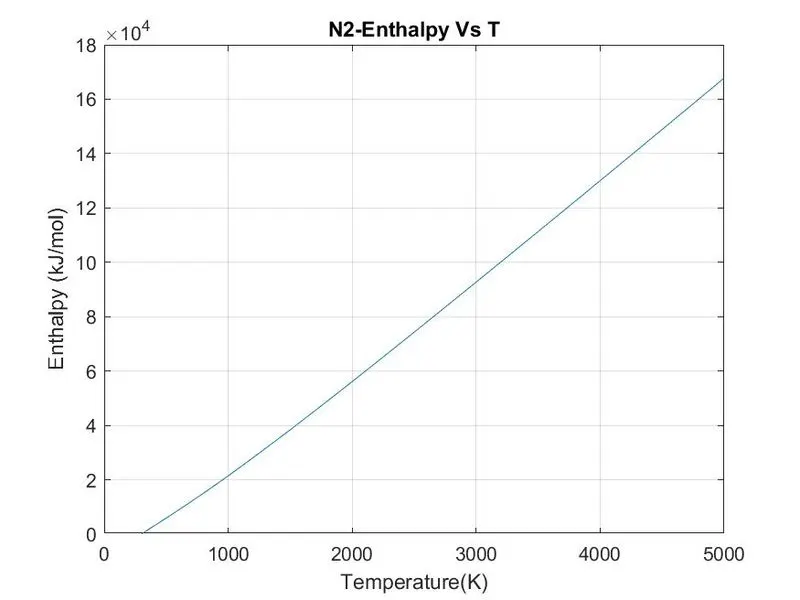
Hence they are plotted in the folder as specified with files having names of each species.

Hence the plot of specific heat, enthalpy and entropy of al the 53 species are obtained and stored inside each file.
CALCULATING THE MOLECULAR WEIGHT
After plotting each datasets to different folders, molecular weight is calulated, for this
- A list of molecules obtained from the dataset is displayed
- The species name to find the molecular weight is selected
- The molecular weight is calculated and a prompt question whether to calculate weight of any other molecule is displayed
function Mol_weight=mol_weight(species)

while(1)

     % Creating a list of all the elements in the datafile read and
     % providing option to select the name of species from the list

   text=char(species);
   [indx]=listdlg('PromptString',{'Select any molecule from list'},'SelectionMode','single','ListString',text);
   species(indx)

   fprintf('\n');
   get=char(species(indx));
   f=upper(get);

   weight=0;

   % A set of basic element symbols and its respective molecular weight are
   % assigned in each array, here R belongs to argon and (S) belongs to
   % CH2, are assigned 0 for calculation covenience

   atoms=['H','C','N','O','A','R','(','s',')'];
   mass=[1,12,14,16,40,0,0,0,0];

   % the selected molecule from species array is compared with each
   % element in atoms array

   % here the values corresponding to each atom on comparison are added up,
   % and the respective positions where the matching element was found are
   % passed on

   for i9=1:length(get)
       for i10=1:length(atoms)
           if strcmpi(get(i9),atoms(i10))  % using strcmpi to make case insensitive
               weight=weight+mass(i10);
               position=i10;
           end

       end


       % when there are more than one atom in molecule with numbers, then
       % the mass gets multiplied.
       % hence inorder to find the numerical value, they are converted into
       % matrix form,which returns the numerical value of the numbers in
       % the molecule

       % when the number is greater than 1, it means, the mass where the
       % position got matched with the string must get multiplied one less
       % time than the numerical number appearing in the molecule since
       % mass gets added up in the first time while matching the strings

       num=str2double(get(i9));
       if num>1
           weight=weight+(mass(position)*(num-1));
       end
   end
   Mol_weight=weight;

   fprintf('MOLECULAR WEIGHT OF THE ABOVE MOLECULE IS\n');
   disp(Mol_weight);


    promptmessage=sprintf('Do you want to calculate weight of \n any other molecule?');
    button=questdlg(promptmessage,'continue','continue','terminate','continue');
    if strcmpi(button,'terminate')
       break;
   end
end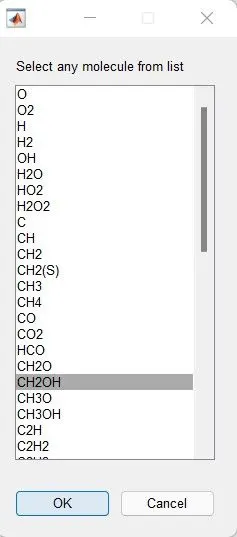
A species list of all the molecules in the file is displayed, through which we can choose which molecule's molecular weight is to be found. The selected weight is displayed in the command box
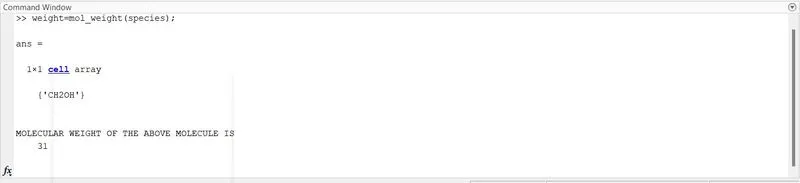
After selecting a prompt qn is asked whether to continue to calculate more values or not
Hitting continue makes it loop through the while loop of program, while hitting terminate, returns a value 0 hence breaking of the while loop

hence hitting continue will loop through again to display the list of molecules
The main program is coded as
% Main program to parse NASA thermodynamic data
clear all
close all
clc

R=8.314;   % Configuring R as universal gas constant with R=8.314 KJ/Kmol-K

f1=fopen('THERMO.dat','r');    % Opening the file and giving a file pointer name f1

header=fgetl(f1);     % Skipping the first line of the file i.e header

GT=fgetl(f1);         % getting the line that contains the value of global temperature range
GTS=strsplit(GT,' ');
global_low_temp=GTS(2);
global_high_temp=GTS(4);
global_mid_temp=GTS(3);

% skipping through the commented section of the data file
for k=1:3
    r=fgetl(f1);
end

% Reading every remaining line from the file
for read=1:212
    z{read}=fgetl(f1);
end
   fclose(f1);

% calling the defined datafunc to get all the sorted out datasets
[a,L,H,M,species]=datafunc(z);

% calling the defined plotfunc to plot specific heat, enthalpy,entropy VS temperature values
[spec,enth,ento]=plotfunc(L,H,M,a,species);

% calling the defined mol_weight function to calculate molecular weight of the selected molecule from the list
weight=mol_weight(species);
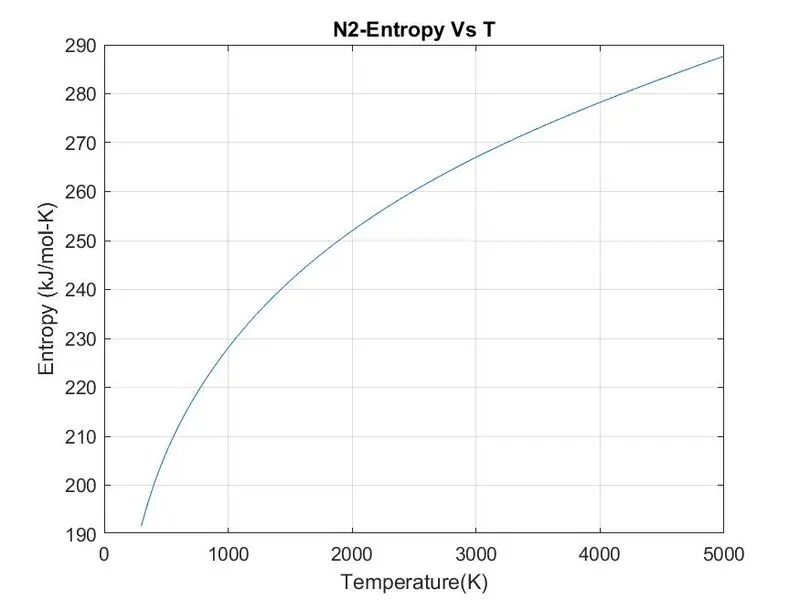
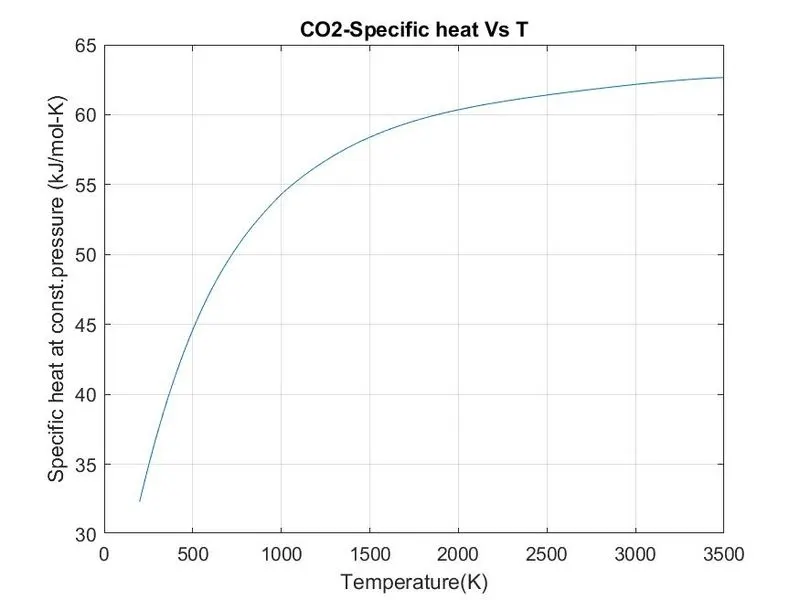
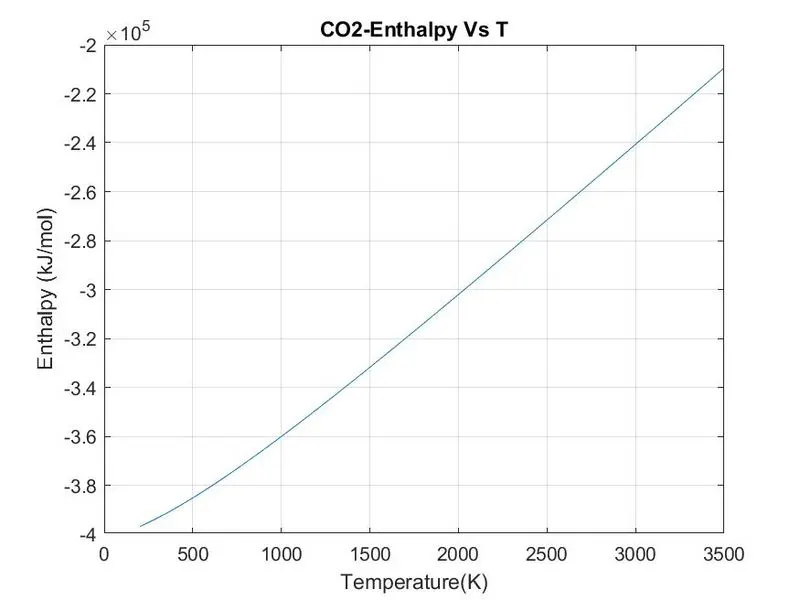
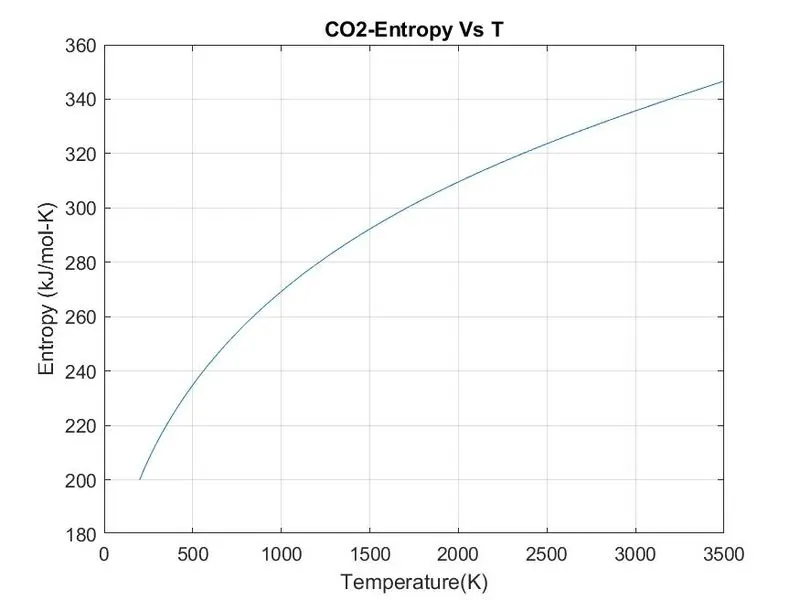
The plots of specific heat, enthalpy and entropy for O2,N2 and CO2 are
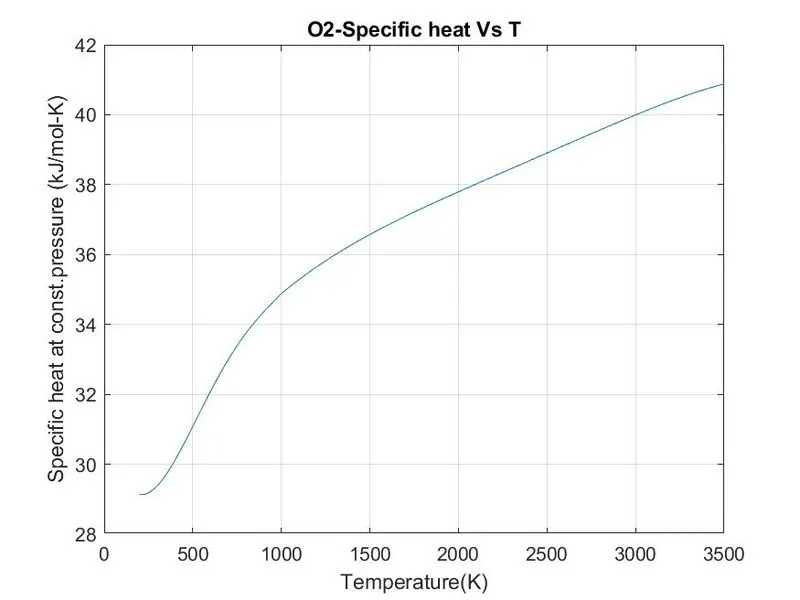
The other plots can be accessed by opening the respective species files already made
REFERENCE
- Determine if strings end with pattern - MATLAB endsWith - MathWorks India
- Find indices and values of nonzero elements - MATLAB find - MathWorks India
- Determine if pattern is in strings - MATLAB contains - MathWorks India
- Create list selection dialog box - MATLAB listdlg - MathWorks India
- Create question dialog box - MATLAB questdlg - MathWorks India
- Convert to cell array of character vectors - MATLAB cellstr - MathWorks India
Errors encountered and solutions
- Some strings had to be indexed using {} than rather than ()
- cellstr had to be used to convert cell for indexing
- Char had to used for loading the species names into the list of molecules