Week 7 State of charge estimation
1.Simulate the 3 test cases from harness dashboard and write a detailed report on the results
Battery management system (BMS) is an electronic system that manages a rechargeable battery (cell or battery pack), such as by protecting the battery from operating outside its safe operating area, monitoring its state, calculating secondary data, reporting that data, controlling its environment, authenticating it, and balancing it.
Harness Dashboard :
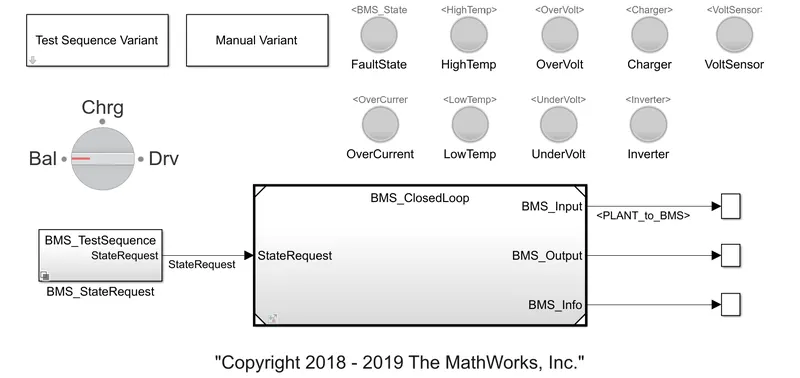
- this is the harness dashboard . here we select the test cases and carry out the simulation
- the dashboard consist of test sequence varient , manual varient , Lamps , BMS closed loop subsystem , rotating switch and BMS state request subsystem .
- we can select the test cases by clicking test sequence varient .
- the rotating switch is for manual varient .
- lamps indicate fault state , high temp , over voltage , charger , voltage sensor , over current , low temperature , under voltage , inverter conditions .
- while running if there is no error and faults , then all lamps will show green color . if there is any fault in any then it will show red color .
BMS closed loop :
The BMS model consists of a BMS ECU (electrical control unit) and a plant. The control unit with its various monitoring and control algorithms is connected to a block with the representation of the battery pack and associated circuitry and peripherals. This model contains two versions of the battery pack: a small one with just 6 cell series, and a larger 16-module pack, each module containing a 6-cell series string. The architecture is 6s-1p and 96s-1p packs, respectively.
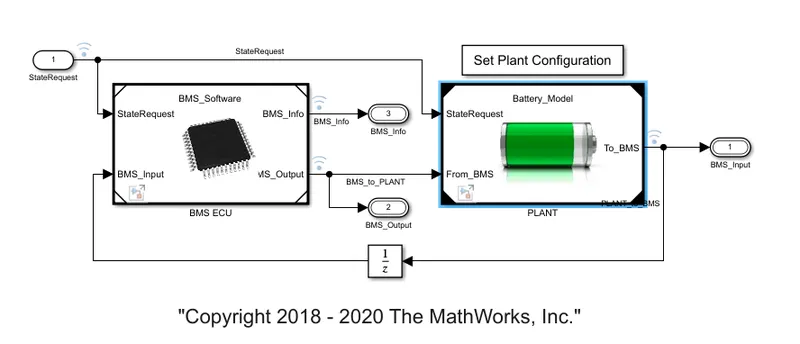
-> BMS ECU
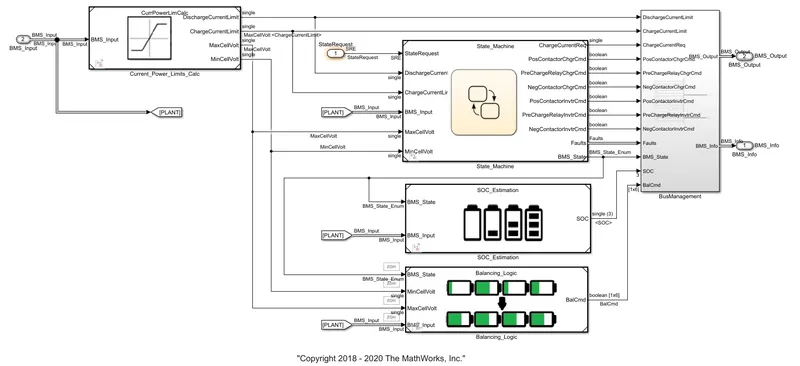
- BMS Electronic control unit consist of many subsystems which calculate current power limits , battery balancing , soc estimation and state machine .
- State Machine defines the main operating state of the BMS. The state machine has four states .
- The first one defines the variable BMS_State which indicates standby, driving, charging, and fault. Charging comprises constant current and constant voltage stages.
- The second state switches the fault state ON in case a current, voltage, or temperature value reaches an unsafe level.
- The third and fourth states define the contactor ON and OFF switching sequence for the charger and inverter. This is needed to avoid an excessively large current inrush at the beginning of the charging stage.
TEST CASE 1
- from test sequence varient , select 1 .
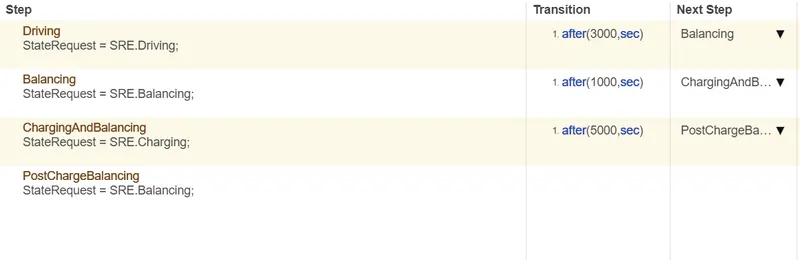
- these are the steps that are carried out in case 1 . upto 3000 seconds the vehicle is driving .
- then the its balancing operations for next 1000 seconds .
- then charging and balancing for next 5000 seconds .
- after that is post charge balancing .
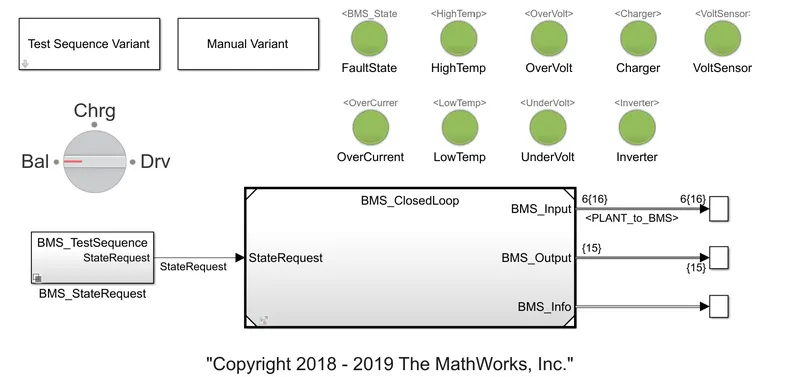
- from dashboard , every lamp is showing green . so no faults and errors are there .
Result :
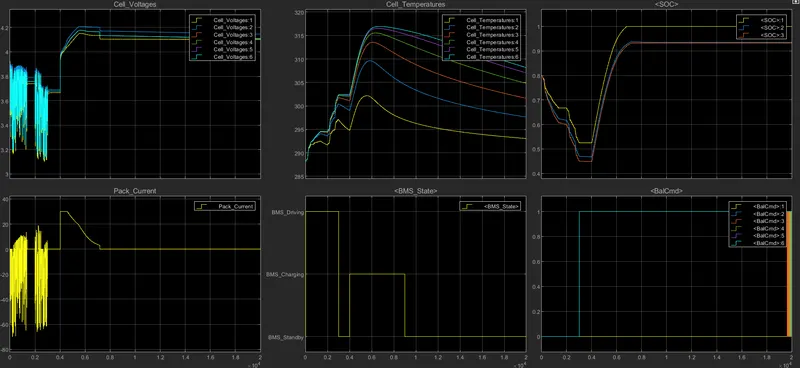
Cell voltage
- For the first 3000 secs, all 6cells are in drive mode where discharging occurs majorly and in standby mode for a small time .
- The voltage varies from 3.1 V to 3.9V during driving .
- From 3000sec to 4000sec cell balancing occur and at this stage, the module is in standby mode and the voltage is constant at nearly 3.7V .
- After 4000sec charging occurs and voltage increases from 3.7V to 4.2V.
- upto 9000 sec charging and balancing is taking place , after that post charge balancing . voltage is balanced to around 4.1V
- constant voltage current is reduced from 30A to 2.6A
Pack Current
- current is drawn while driving .
- when balancing no current is drawn .
- while charging current reduces from 30A to almost 0 .
Cell Temperature
- when driving the temperature range of cells increases gradually from 288k to 302k.
- The temperature of the cell 1 is lesser and cell 6 has a higher temperature for all stages.
- when charging temperature of cells increases to a great extent .
- cell 1 temperature is raised to 302k and cell 6 temperature raised to 317k . after 9000sec ,balancing occurs and the temperature reduces .
BMS states:
- For 3000sec the battery module is in drive mode
- From 3000sec to 4000sec the battery module is in balancing standby mode.
- After 4000sec up to 9000sec, the battery module is in charging and balancing mode
- After 9000sec, only post charge balancing mode operates up to the end of the simulation.
SOC:
- Initially, the state of charge of the battery module is at 80%.
- Here, the yellow plot represents SOC estimation done by the coulomb counting technique.
- The blue plot represents SOC estimation using the Kalman filter technique
- The red plot represents SOC estimation using the extended Kalman filter technique.
- during drive mode SOC decreases to nearly 45%
- After 3000sec up to 4000sec the SOC is constant and 45% . cell balancing occurs in standby mode.
- during charging mode SOC reaches 100 % for coulomb counting technique , but not for kalman filter technique.
TEST CASE 2
- from test sequence varient , select 2 .
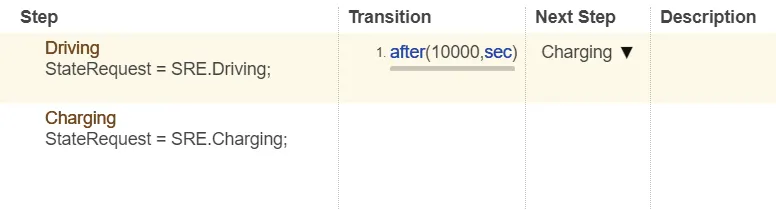
- only driving and charging operations are carried out in case 2 .
- upto 10000 seconds the vehicle is in driving mode.
- after that its charging .
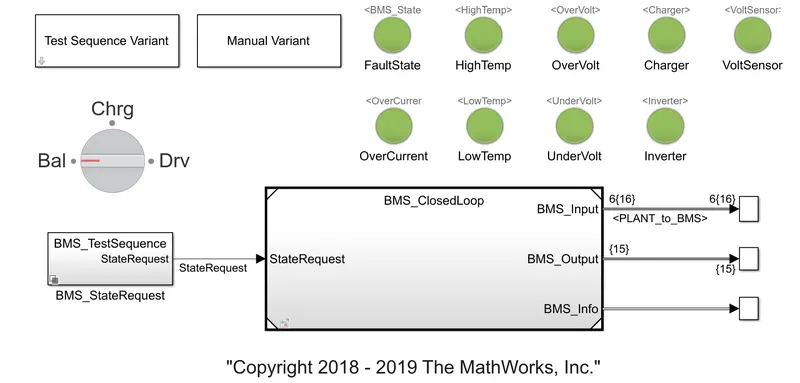
- from dashboard , every lamp is showing green . so no faults and errors are there .
Result :
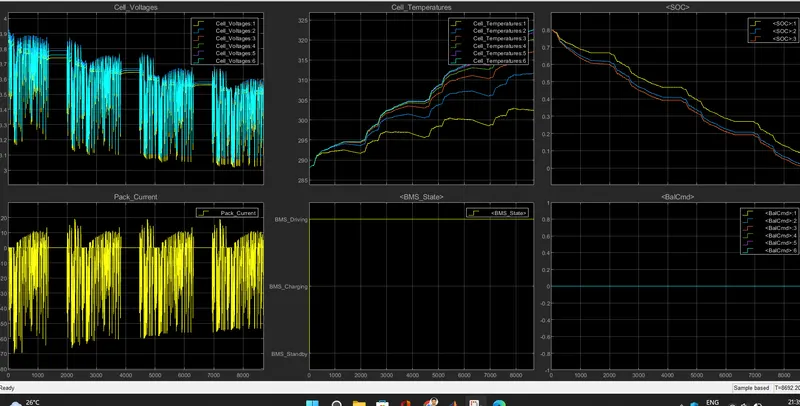
- during drive mode the cell voltages decreases from 3.9 to 3.1
- pack current shows the current drawn during drive mode
- the cell temperature increases from 288 k to 322 k . cell 6 is having high temperature and cell 1 is having low temperature .this temperature change occurs in driving mode .
- case 2 has driving and charging operations . but only driving is taken place as simulation is run upto 9000 sec .
- SOC decreases from 80% and reaches 0 % around 9000 sec . as a result charging operation could not take place .
TEST CASE 3
- from test sequence varient , select 3 .

- only charging of the vehicle is carried out in case 3 .
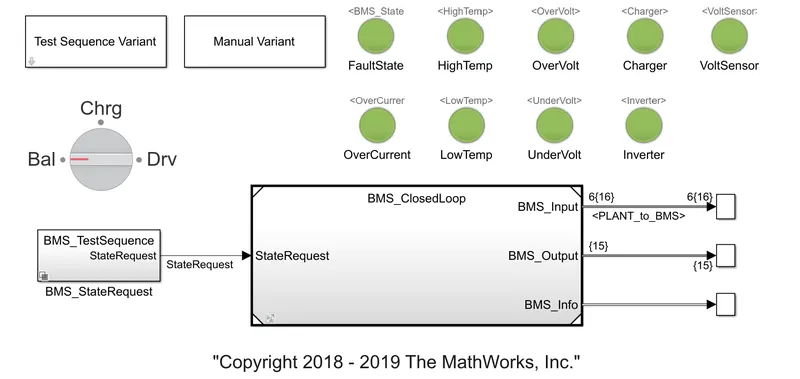
- from dashboard , every lamp is showing green . so no faults and errors are there .
Result :
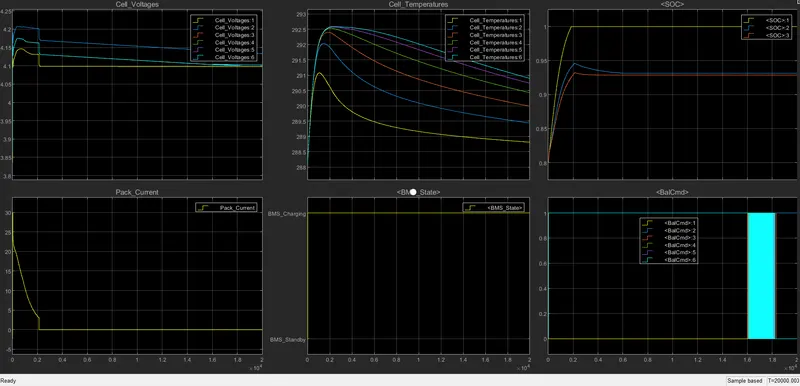
- Charging is only taking place here .
- At 2000 seconds SOC is 100% for coulomb counting technique . but for Kalman filter technique only 94% SOC is achieved and it remains constant .
- Cell voltages decreases from 4.2V to 4.1 for different cells during charging . after the battery is charged the voltage is constant .
- Pack current decreases from 30A to 2A during the charging time .after the battery is charged the current is zero .
2.What is coulomb counting? explain how BMS implements coulomb counting for SOC estimation ?
The State of Charge (SoC) of a battery cell is required to maintain it’s safe operation and lifetime during charge, discharge and storage. However, SoC cannot be measured directly and is estimated from other measurements and known parameters. This leads to errors in the estimated SoC and that means it is not possible to fully exploit the full capability of the cell.
Coulomb counting gives a relative change in SoC and not an absolute SoC. If you measure the current over a given time step you have a measure of the number of Ah that have left or been received by the battery. SoC Estimation by Coulomb Counting is based on the measurement of the current and integration of that current over time.
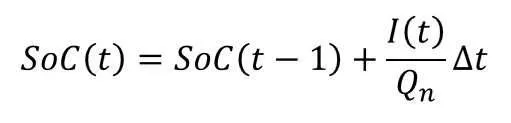
where:
- SoC(t) = estimated State of Charge at time, t
- SoC(t-1) = previous State of Charge at time t-1
- I(t) = charging or discharging current at time, t
- Qn = battery cell capacity
- Δt = time step between t-1 and t
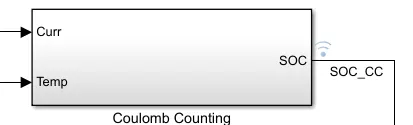
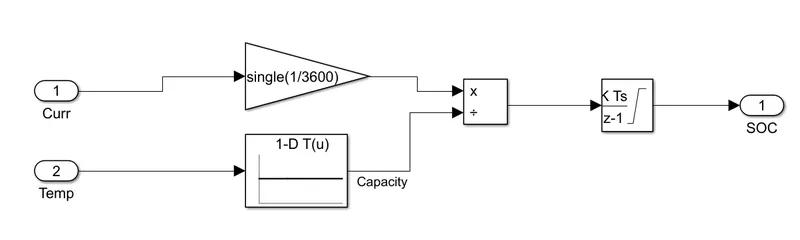
- in BMS sysytem , coulomb counting is used for soc estimation . the subsystem coulomb counting consist of only simple blocks for soc estimation .
- current and temperature is taken as input and soc is given as output .
- current is divided by 3600 to convert to coulomb unit
- 1D lookup table compares temperature to give capacity .
- then current and capacity is divided , then integrated over time to give soc as output .