Week 4.1 - Genetic Algorithm
GENETIC ALGORITHM
AIM:-
Write a code in MATLAB to optimise the stalagmite function and find the global maxima of the function.
OBJECTIVE:-
- Expalin the concept of genetic algorithm and explain the syntax for ga in MATLAB
- Plot graphs for all 3 studies and for F maximum vs no. of iterations.
THEORY:-
Genetic Algorithm
Genetic Algorithm (GA) is a search-based optimization technique based on the principles of Genetics and Natural Selection. It is frequently used to find optimal or near-optimal solutions.
It is frequently used to solve optimization problems, in research, and in machine learning.
working:- the following figure shows how genentic algorithm works
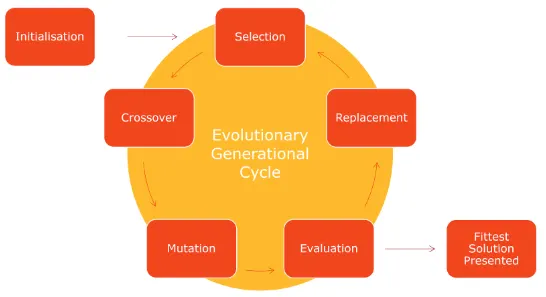
- Initialisation: In the initialisation, first we have to decide the population size. Higher the population size, we will get more combinations, hence we get more accurate results. Population is the number of sample data points (chromosomes) taken to perform the genetic algorithm operation.
- Selection:In this step, the parents are selected from the sample data points, the main objective of the selection process is to select the highly fit individuals.
- Cross-Over: It is the process of taking two parents and producing the childs from them by interchanging the genes.
- Mutation: Mutation is carried out to maintain the genetic diversity from one generation of a population of chromosomes to the next.
- Fitness Function: It is a function which measures how good your solution is. Fitness function takes the solution as input and produces the suitability of the solution as the output. This evaluates how close the solution is to the optimal solution of the desired problem.
ga syntax:-
ga stopping criteria :-
- the algorithm stops when number of generations reaches the value of generations
- the algorithm stops when it reaches the time limit
- the algorithm stops when the value of fitness function is best .
Stalagmite Function
stalagmite structures are formed from the caves floor that point upward.stalagmite functions are mathematical functions which represents shapessililar to that of stalagmite functions.
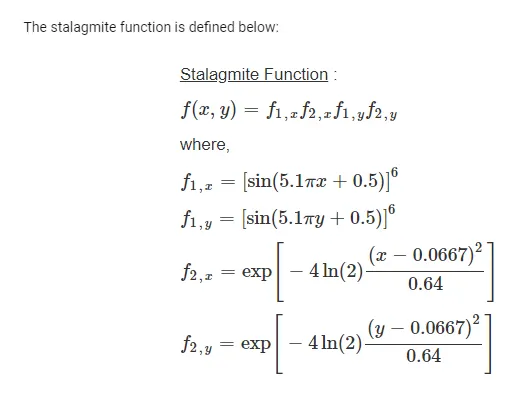
GOVERNING EQUATIONS :-
CODE:-
function for stalagmite
% function for stalagmite

function f=stalagmite(input_vector)

x=input_vector(1);
y=input_vector(2);

f1=(sin(5.1*pi*x+0.5))^6;
f2=(sin(5.1*pi*y+0.5))^6;
f3=exp((-4*log(2)*(x-0.0667)^2)/0.64);
f4=exp((-4*log(2)*(y-0.0667)^2)/0.64);

f=-(f1*f2*f3*f4);
end
main matlab program
% program to optimise the stalagmite function and find the global maxima of the function

close all
clear all
clc

% defining our search space
x=linspace(0,0.6,150);
y=linspace(0,0.6,150);

% creating 2D mesh
[xx, yy]=meshgrid(x,y);
% no. of times ga run
n=50;

% evaluating the stalagmate function
for i = 1:length(xx)
    for j = 1:length(yy)
        input_vector(1)=xx(i,j);
        input_vector(2)=yy(i,j);
        f(i,j)=stalagmite(input_vector);
    end
end

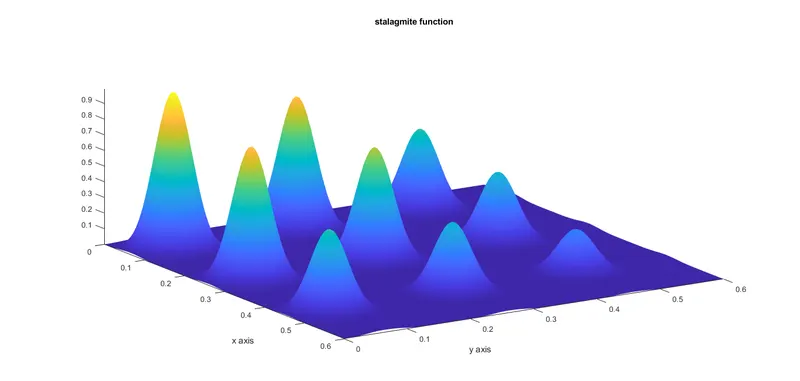
figure(1)
hold on
surfc (xx,yy,-f)
xlabel('x axis')
ylabel ('y axis')
title('stalagmite function')

shading interp

%study 1 - Unbounded Condition
tic
for i=1:n
[inputs,fopt(i)]=ga(@stalagmite,2);
xopt(i)=inputs(1);
yopt(i)=inputs(2);
end
Study_time_1 = toc
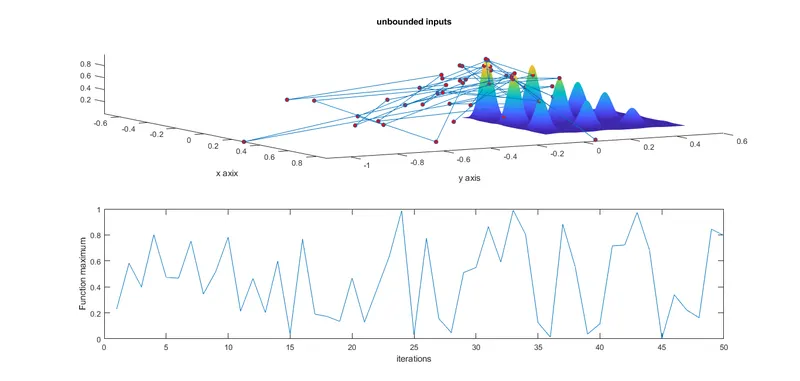
figure(2)
subplot(2,1,1)
hold on
surfc(xx,yy,-f)
shading interp
ylabel('y axis');
xlabel('x axix');
plot3(xopt,yopt,-fopt,'marker','o','markersize',5,'markerfacecolor','r')
title('unbounded inputs')
subplot(2,1,2)
plot(-fopt)
xlabel('iterations');
ylabel('Function maximum');

%study 2-  with upper and lower bounds

tic
for i=1:n
[inputs,fopt(i)]=ga(@stalagmite,2,[],[],[],[],[0;0],[0.6;0.6]);
xopt(i)=inputs(1);
yopt(i)=inputs(2);
end
Study_time_2 = toc
figure(3)
subplot(2,1,1)
hold on
surfc(xx,yy,-f)
shading interp
xlabel('x axis');
ylabel('y axis');
plot3(xopt,yopt,-fopt,'marker','o','markersize',5,'markerfacecolor','r')
title('unbounded inputs')
subplot(2,1,2)
plot(-fopt)
xlabel('iterations');
ylabel('Function maximum');

%study 3 - Increasing GA Iterations

options=optimoptions('ga')
options=optimoptions(options,'PopulationSize',300);
tic
for i=1:n
[inputs,fopt(i)]=ga(@stalagmite,2,[],[],[],[],[0;0],[0.6;0.6],[],[],options);
xopt(i)=inputs(1);
yopt(i)=inputs(2);
end
study3_time=toc
figure(4)
subplot(2,1,1)
hold on
surfc(x,y,-f)
shading interp
xlabel('x axis')
ylabel('y axis')
plot3(xopt,yopt,-fopt,'marker','o','markersize',5,'markerfacecolor','r')
title('Bounded Inputs with Modified Population Size')
subplot(2,1,2)
plot(-fopt)
xlabel('Iterations');
ylabel('Function maximum');
STEPS:-
1. an array is created for x and y using linspace command .
2. corresponding 2d mesh is obtained using meshgrid function.
3. a nested loop is created to assign values from this 2d mesh array to an array named input_vector
4. input_vector is then passed as input to a function named stalagmite . stalagmite is a seperate function which we created to evaluate stalagmite function. equations for this are given in equation section.
5. -ve sign is given to output of stalagmite function to get global maxima
6. with 'surfc' function we then plot stalagmite function .
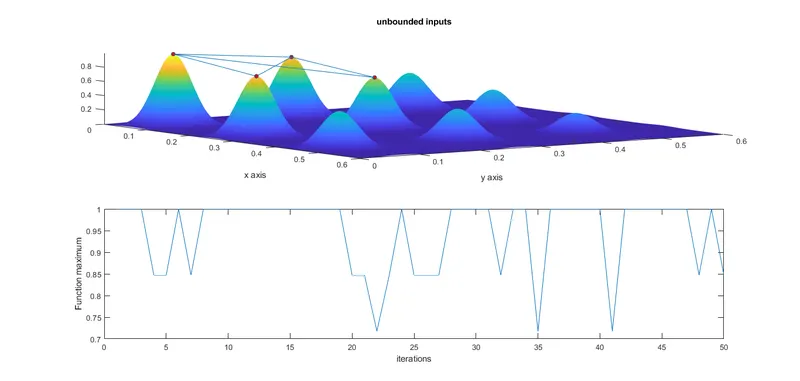
7. now we evaluate 3 studies . study 1 is unbounded condition and plots were made . we use genetic algorithm function (ga) to calculate the global maxima .we use plot3 commad to create subplot. and done the same for other two studies also.
8. study 2 is bounded condition . the solutions are more accurate .plots were also made for this .
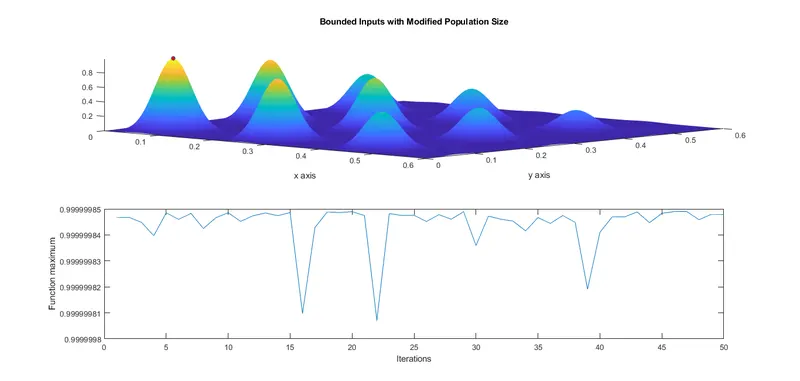
9. study 3 is bounded inputs with increased population size . plots were made . global maxima is found in this case .
RESULTS:-
plot for stalagmite function
study 1 :
study 2 :
study 3 :
CONCLUSION:-
we get global maxima for stalagmate function in study 3 only . but the study time for study 3 is more than study 2 and study 1 . it is observed that when we increase the population size we get more accurate algorithm.
REFERENCE:-
https://skill-lync.com/knowledgebase/genetic-algorithm-explained
https://in.mathworks.com/help/gads/ga.html?searchHighlight=ga%20syntax&s_tid=srchtitle_ga%20syntax_1