Project 1 - Parsing NASA thermodynamic data
PARSING NASA THERMODYNAMIC DATA
AIM:-
Generate thermodynamic data from numerical coefficients supplied in NASA thermodynamic file and plot datas for each elements
OBJECTIVE:-
1. Create a function that extracts the 14 co-efficients by reading NASA thermodynamic file
2. Calculate the enthalpy, entropy and specific heats for all the elements in the data file.
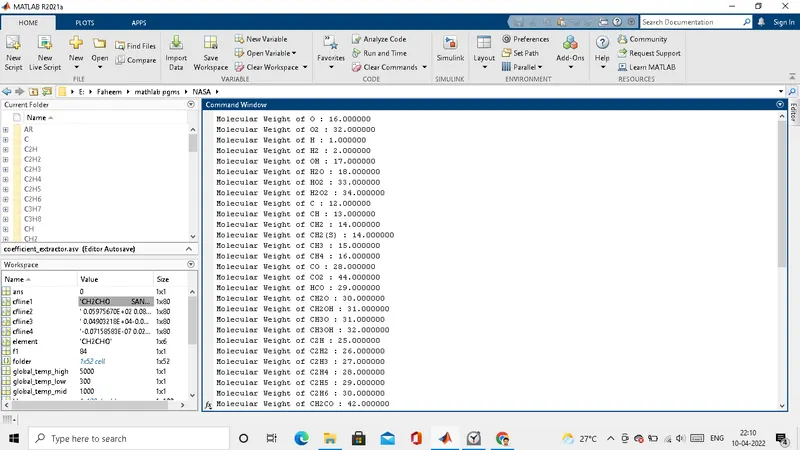
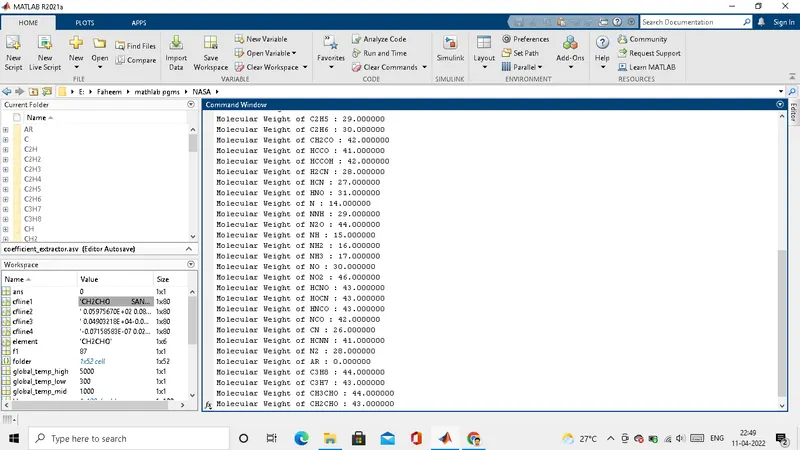
3. Calculate the molecular weight of each element and display it.
4. Plot the Cp, Enthalpy and Entropy for each elements.
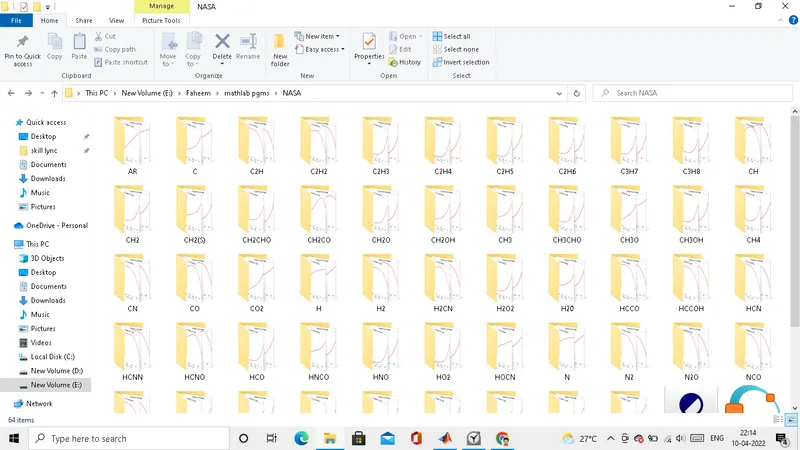
5. Save the plots as images with separate folders for each elements.
THEORY:-
NASA came up with polynomials that can be used to evaluate thermodynamic properties such as Cp, H and S. They have also documented the co-efficients that are required to evaluate these polynomials for 1000+ species.
File Parsing: File parsing refers to how information can be read from a particular text file or any type of file and how that information can be used in a computer program.
Nasa Thermodynamicdata file: THERMO.dat is a data file contains a number of coefficients for different elements given by NASA. These coefficients can be utilized to calculate the Specific Heat,Enthalpy and Entropy for a particular element
Specific heat : specific heat, the quantity of heat required to raise the temperature of one gram of a substance by one Celsius degree. The units of specific heat are usually calories or joules per gram per Celsius degree.
Enthalpy: the sum of the internal energy and the product of the pressure and volume of a thermodynamic system. Enthalpy is an energy-like property or state function—it has the dimensions of energy (and is thus measured in units of joules or ergs), and its value is determined entirely by the temperature, pressure, and composition of the system.
Entropy : The entropy of an object is a measure of the amount of energy which is unavailable to do work. Entropy is also a measure of the number of possible arrangements the atoms in a system can have. In this sense, entropy is a measure of uncertainty or randomness.
Molecular weight : The sum of the atomic masses of all atoms in a molecule, based on a scale in which the atomic masses of hydrogen, carbon, nitrogen, and oxygen are 1, 12, 14, and 16, respectively.
GOVERNING EQUATIONS :-

Cp is specific heat
H is enthalpy
S is entropy
R is universal gas constant
T is temperature
a1,a2,a3,a4,a5,a6,a7,a8,a9,a10,a11,a12,a13,a14 are thermodynamic coefficients
CODE:-
1. main program
% main program

close all
clear all
clc

% current folder
old_folder = 'E:\Faheem\mathlab pgms\NASA';


% opening the file
% 'THERMO.dat' file is saved in location old_folder

f1 = fopen('THERMO.dat','r');

% header
fgetl(f1);

% global temperature
line2=fgetl(f1);
line2 = strsplit(line2,'  ');
global_temp_low = str2double(line2{2});
global_temp_mid = str2double(line2{3});
global_temp_high = str2double(line2{4});

% skipping comments
fgetl(f1);
fgetl(f1);
fgetl(f1);

% local temperature
cfline1=fgetl(f1);
% calling function to get local temperature
[element,local_low,local_mid,local_high]=local_temp_function(cfline1);

% reading coefficients of line 2
cfline2 = fgetl(f1);
% reading coefficients of line 3
cfline3 = fgetl(f1);
% reading coefficients of line 4
cfline4 = fgetl(f1);

temp = linspace(local_low,local_high,100);
% calling function to extract coefficient and calculate H , S , Cp
[H ,S, Sp] = coefficient_extractor(cfline2,cfline3,cfline4,temp,local_mid);

% calling function to plot
plot_function(temp,Sp,H,S,element)

% calling function to calculate molecular weight
molecular_weight(element);

% making folder named 'O'
mkdir O
% changing file path to save plot
cd O

%Saving the plot that got generated
saveas(figure(1),'SP.png');
saveas(figure(2),'H.png');
saveas(figure(3),'S.png');

% switching dir back

cd(old_folder)

% using for loop to create folder for each element and save plot generated
% above code is repeated again inside the for loop

folder = {'O2','H','H2','OH','H20','HO2','H2O2','C','CH','CH2','CH2(S)','CH3','CH4','CO','CO2','HCO','CH2O','CH2OH','CH3O','CH3OH','C2H','C2H2','C2H3','C2H4','C2H5','C2H6','CH2CO','HCCO','HCCOH','H2CN','HCN','HNO','N','NNH','N2O','NH','NH2','NH3','NO','NO2','HCNO','HOCN','HNCO','NCO','CN','HCNN','N2','AR','C3H8','C3H7','CH3CHO','CH2CHO'};
for k = 1 : length(folder)
    cfline1=fgetl(f1);
    [element,local_low,local_mid,local_high]=local_temp_function(cfline1);
    cfline2 = fgetl(f1);
    cfline3 = fgetl(f1);
    cfline4 = fgetl(f1);
    temp = linspace(local_low,local_high,100);
    [H ,S, Sp] = coefficient_extractor(cfline2,cfline3,cfline4,temp,local_mid);
    plot_function(temp,Sp,H,S,element)
    molecular_weight(element);
    newfile = fullfile(folder{k});
    mkdir( newfile)
    cd (newfile)
    saveas(figure(1),'SP.png');
    saveas(figure(2),'H.png');
    saveas(figure(3),'S.png');
    cd(old_folder)

end

fclose(f1);
2. function to calculate local temperature
% function to calculate local temperature

function [E,tl, tm, th] = local_temp_function(o)
s=strsplit(o,'  ');
E=s{1};
tl = str2double(o(49:55)); % local low temperature
tm = str2double(o(68:76)); % local mid temperature
th = str2double(o(57:66)); % local high temperature
end
3. function to extract 14 coefficients and calculate enthalpy , entropy and specific heat
% function to extract 14 coefficients and calculate enthalpy , entropy and
% specific heat

% H = ENTHALPY
% S = ENTROPY
% Sp = SPECIFIC HEAT

function [H , S , Sp] = coefficient_extractor(cfline1,cfline2,cfline3,temp,local_mid)
x=strfind(cfline1,'E');
a1 = str2double(cfline1(1:x(1)+3));
a2 = str2double(cfline1(x(1)+4:x(2)+3));
a3 = str2double(cfline1(x(2)+4:x(3)+3));
a4 = str2double(cfline1(x(3)+4:x(4)+3));
a5 = str2double(cfline1(x(4)+4:x(5)+3));

y=strfind(cfline2,'E');
a6 = str2double(cfline2(1:y(1)+3));
a7 = str2double(cfline2(y(1)+4:y(2)+3));
a8 = str2double(cfline2(y(2)+4:y(3)+3));
a9 = str2double(cfline2(y(3)+4:y(4)+3));
a10 = str2double(cfline2(y(4)+4:y(5)+3));

z=strfind(cfline3,'E');
a11 = str2double(cfline3(1:z(1)+3));
a12 = str2double(cfline3(z(1)+4:z(2)+3));
a13 = str2double(cfline3(z(2)+4:z(3)+3));
a14 = str2double(cfline3(z(3)+4:z(4)+3));

% universal gas constant
R = 8.314;

for i = 1:length(temp)
    if temp(i)<local_mid
        % Specific heat
        Sp = ((a1) + (a2.*temp) + (a3.*(temp.^2)) + (a4.*(temp.^3)) + ( a5.*(temp.^4))).*R;
        % Enthalpy
        H=((a1.*temp)+((a2.*(temp.^2))./2)+((a3.*(temp.^3))./3)+((a4.*(temp.^4))./4)+((a5.*(temp.^5))./5)+(a6)).*R;
        % Entropy
        S=((a1.*log(temp))+ (a2.*temp)+((a3.*(temp.^2))./2)+((a4.*(temp.^3))./3)+((a5.*(temp.^4))./4)+(a7)).*R;
    else
        % Specific heat
        Sp = ((a8) + (a9.*temp) + (a10.*(temp.^2)) + (a11.*(temp.^3)) + (a12.*(temp.^4))).*R;
        % Enthalpy
        H=(( a8.*temp )+ ((a9.*(temp.^2))./2) + ((a10.*(temp.^3))./3) + ((a11.*(temp.^4))./4) + ((a12.*(temp.^5))./5) + (a13)).*R;
        % Entropy
        S=((a8.*log(temp)) + (a9.*temp) + ((a10.*(temp.^2))./2) + ((a11.*(temp.^3))./3) + ((a12.*(temp.^4))./4) + (a14)).*R;
    end
end


end
4. function to generate plot
% function to generate plot

function []= plot_function(temp,Sp,H,S,element)

figure(1)
%hold on
plot(temp,Sp,'linewidth',2,'color','r');
xlabel('Temperature in [K]');
ylabel('Specific heat in [KJ]');
title(sprintf('Temperature vs Specific heat of %s',element));

% plot2 temperature vs enthalpy
figure(2)
%hold on
plot(temp,H,'linewidth',2,'color','r');
xlabel('Temperature in [K]');
ylabel('Enthalpy in [KJ/mol]');
title(sprintf('Temperature vs Enthalpy of %s',element));

% plot3 temperature vs entropy
figure(3);
%hold on
plot(temp,S,'linewidth',2,'color','r');
xlabel('Temperature in [K]');
ylabel('Entropy in [KJ/molK]');
title(sprintf('Temperature vs Entropy of %s',element))  ;

end
5. function to calculate molecular weight
%function for calculating molecular weight

function MW=molecular_weight(element)

% converts to upper case
element_name=upper(element);

atoms={'H','C','N','O','AR'};
atomic_weight=[1 12 14 16 40];

MW=0;
for i=1:length(element)
    for j=1:length(atomic_weight)
        % comparing element name and atom name
        if strcmp(element_name(i),atoms(j))==1
            MW=MW+atomic_weight(j);
            u=j;
        end
    end
    %adding the weight of repeatating atom
    n=str2double(element_name(i));
    if n>1
        MW=MW+atomic_weight(u)*(n-1);
    end
end
fprintf('Molecular Weight of %s : %f',element_name,MW);
disp(' ')

end
STEPS:-
1. with help of fopen() function we are reading THERMO.dat file .
2. we are saving the location of where THERMO.dat file contains to old_folder. so that we only need to change location in the main code when we are using in different computer .
3. we use fgetl() to get header .
4. by using fgetl() , strsplit() , str2double() we extract global temperature values .
5. we use fgetl() to skip comments
6. now we call local_temp_function() to get local temperature by passing line as input
7. we read next three lines containing coefficients and save them seperately as cfline2 , cfline3 and cfline4
8. then using linspace() we create values for temp.
9. we call coefficient_extractor() function , which extracts coefficients from 3 lines and calculate specific heat , enthalpy and entropy of the element . specific heat , enthalpy and entropy is calculated using the formula given in equation section.
10. we call plot_function() to plot temperature against specific heat , enthalpy and entropy
11. we call molecular_weight() function to calculate the molecular weight of the element .
12 . now we make a folder using mkdir() and change the file path using cd()
13. now we save the plot as image in the created file using saveas() function
14. we switch the directory back to old_folder location.
15. since the data file is so big , we are using for loop to create folder for each element and save the plots generated in that folder
RESULTS:-
Molecular weight of elements in command window
Screenshot of folders
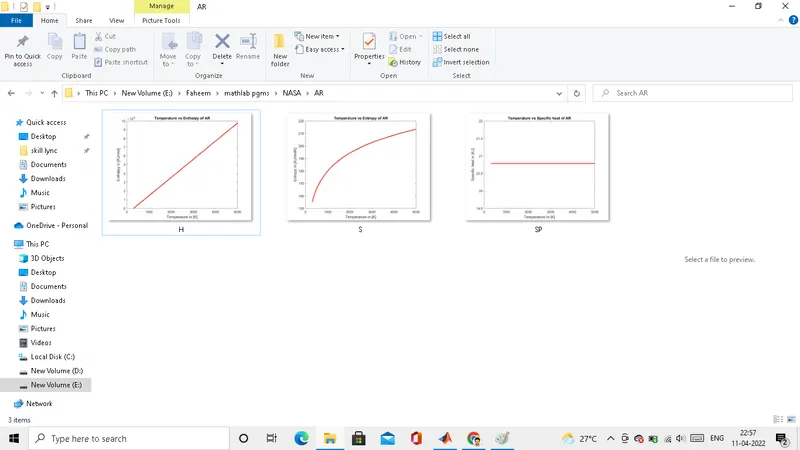
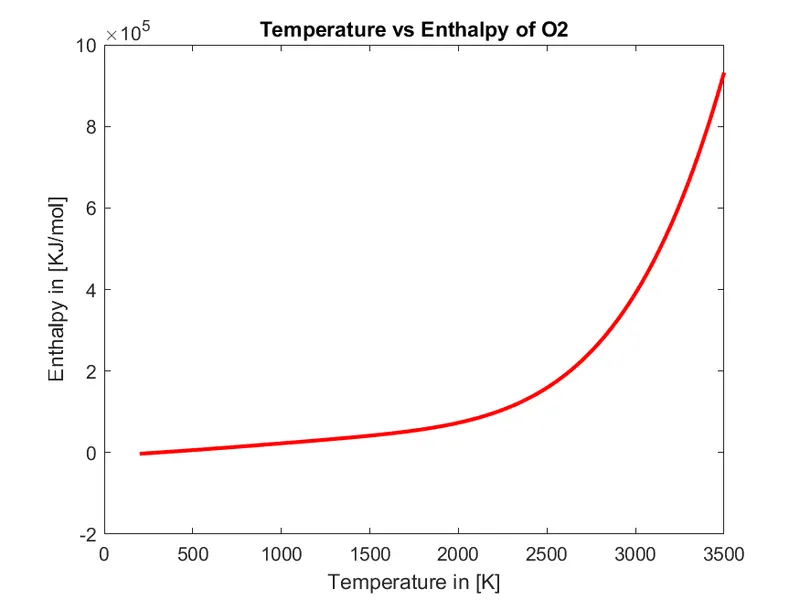
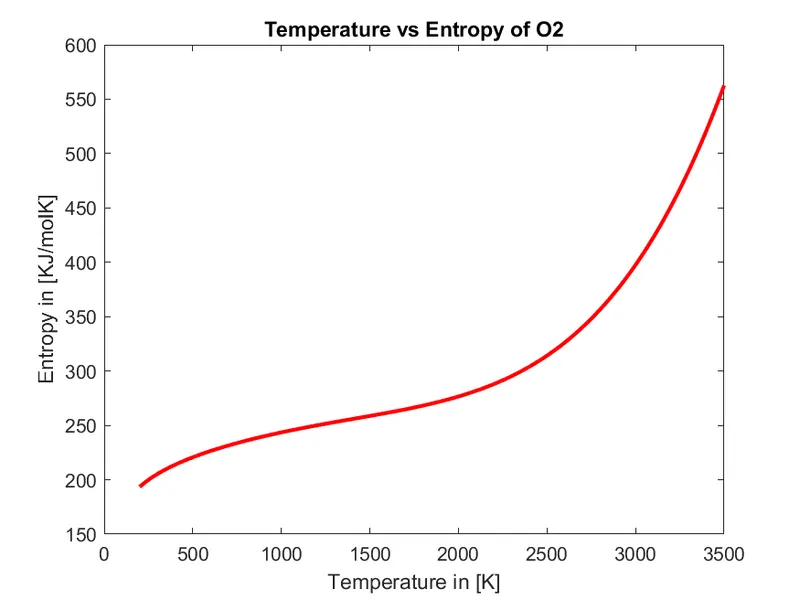
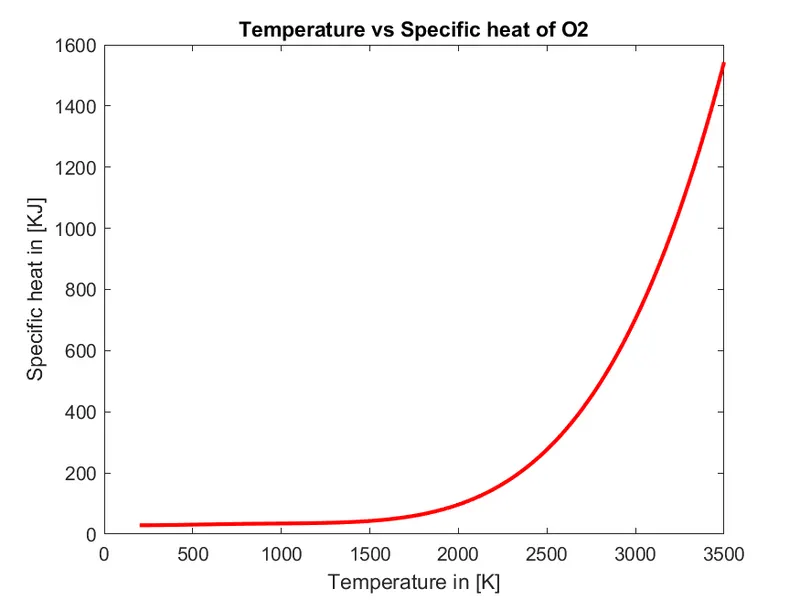
Plots of O2
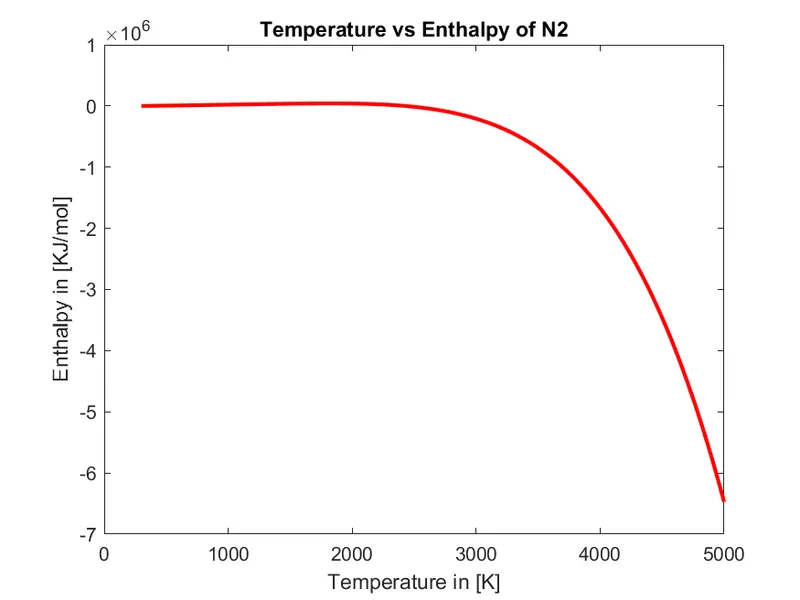
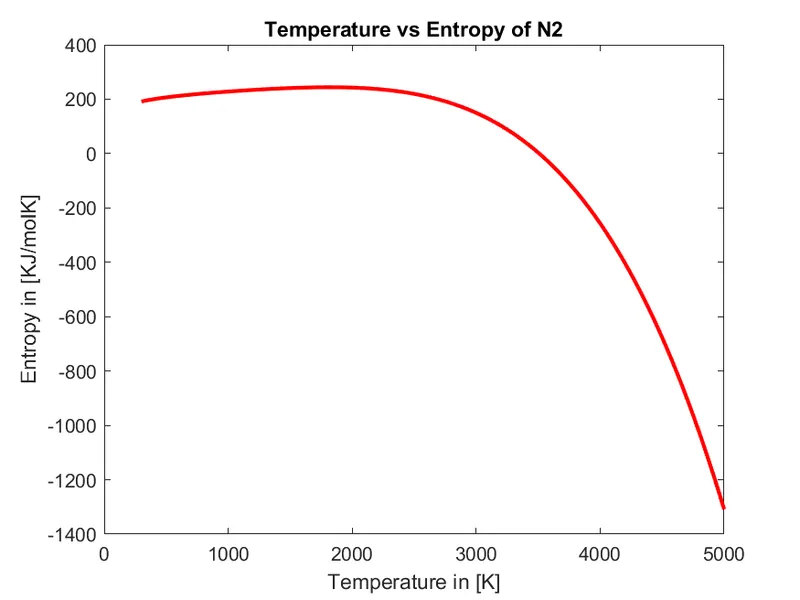
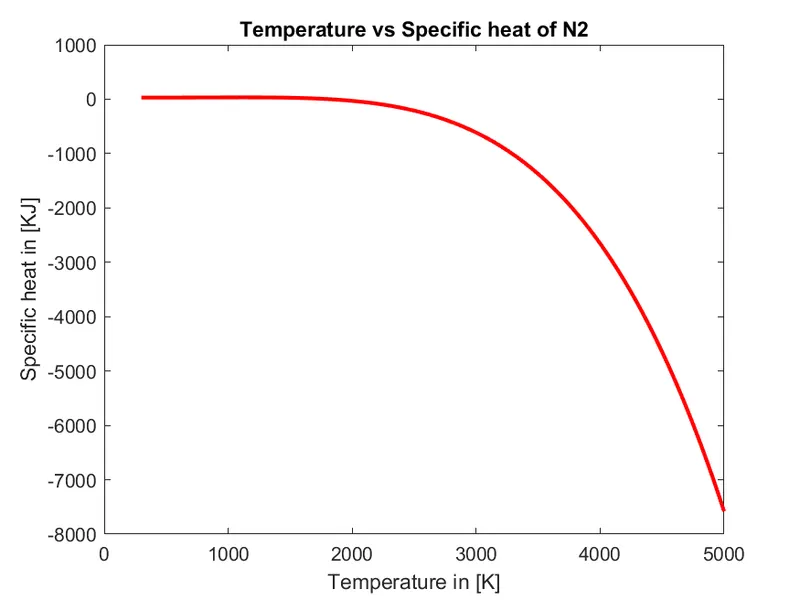
Plots of N2
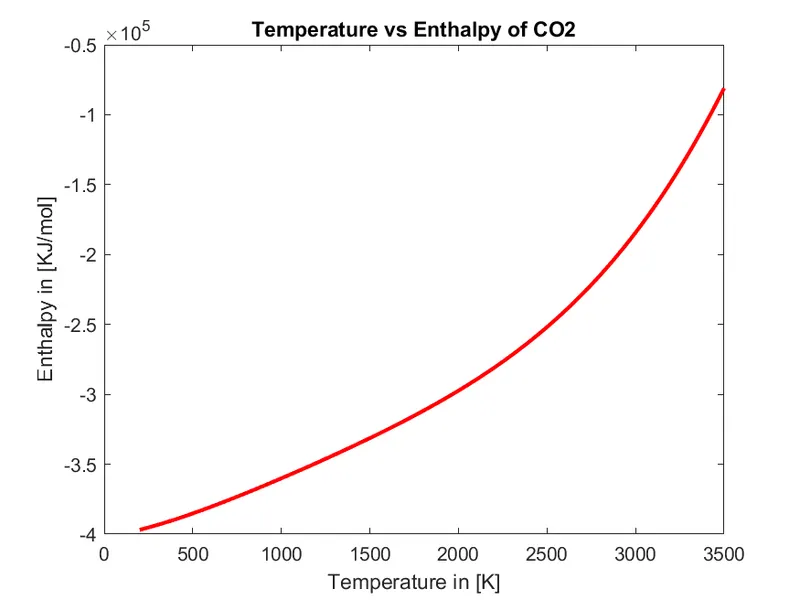
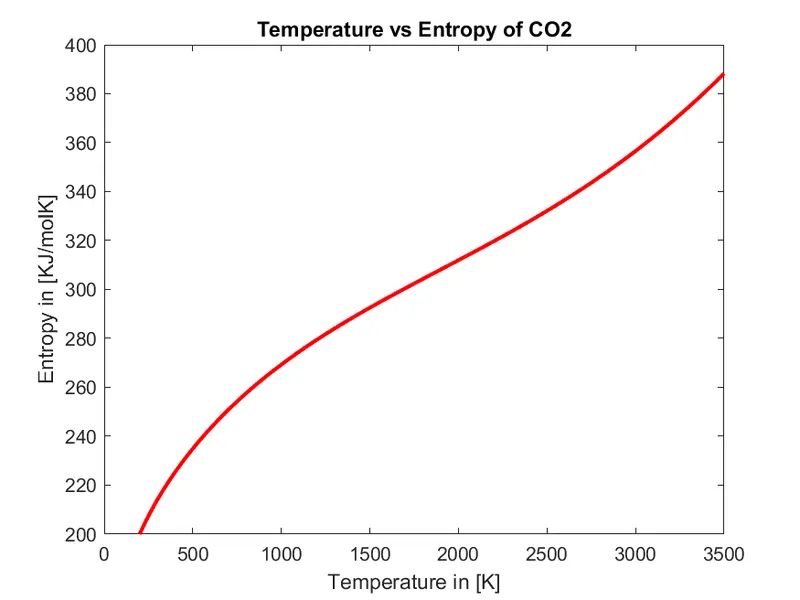
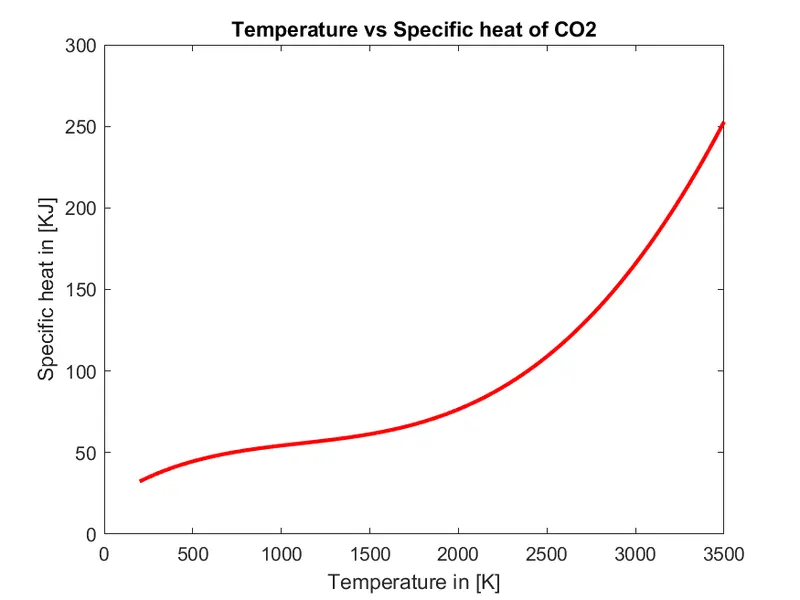
Plots for CO2
CONCLUSION:
Thus, the parsing of NASA thermodynamic data was done.
REFERENCE :-
Wikipedia
https://in.mathworks.com/matlabcentral/answers/427366-mkdir-with-multiple-subfolders-that-are-variables