Week 7 State of charge estimation
1.Simulate the 3 test cases from harness dashboard and write a detailed report on the results
Simulation of Closed-loop BMS (Battery Management System)
-
-
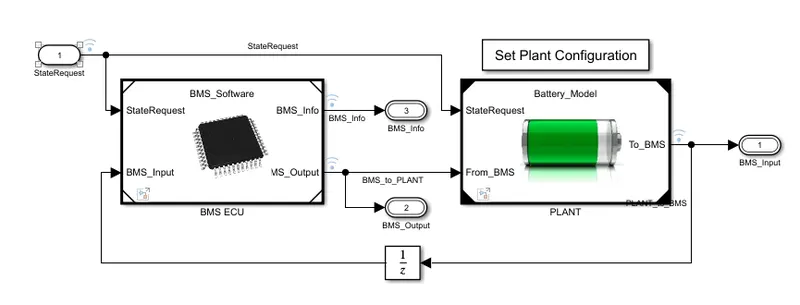
This the model of the control unit with its various monitoring and control algorithms is connected to a block with the representation of the battery pack and associated circuitry
and peripherals.
Model
-
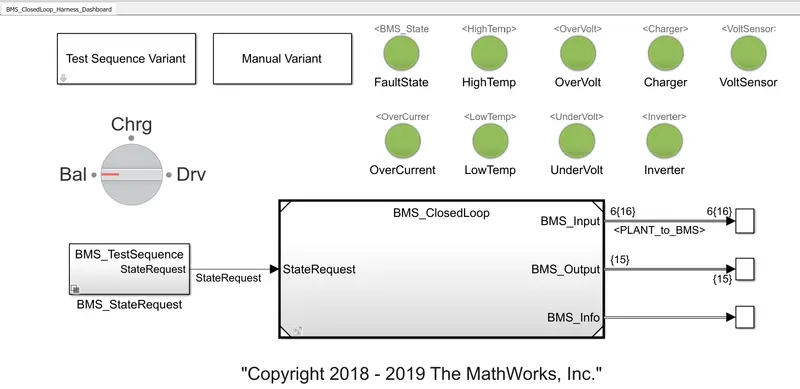
- This model represents the harness test os the BMS.
- This dashboard indiactes the fault state of the battery through Lamp which isindicated through red colour.
- It cionsists of three test which ia represented as State request.
- The BMS_ClossedLoop consists of BMS softwarre and plant.
Blocks Used
- Selecting the Variant
- Test sequence is selected through the Test sequence variant block.
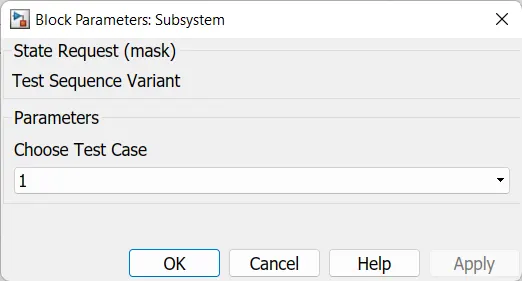
- By selecting the test case from 1 - 2 we can modify the test sequence.
- BMS_StateRequest
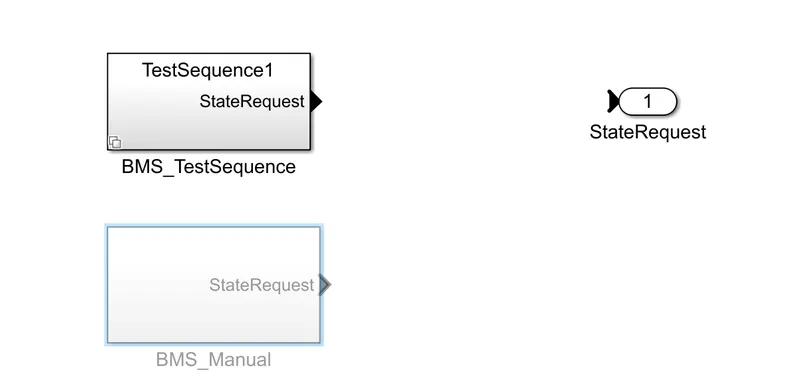
- The BMS_TestSequence is enabled while the BMS Manual is disabled.
- We can monitor the flow of the state.
- Which is represented as the flow order
- Rotary Switch
- By using this switch we change the mode of opeartion during or before testing.
- It has three modes of operation
- Bal- balancing mode
- Chrg - Charging Mode
- Drv - Driving mode
- Lamp
- It indicates the fault of the system.
- If the system is working fine it is indicated as green colour.
- If the system fails it is indicated as red colour.
Working and Results
- The harness test consists of three cases.
- Test case 1
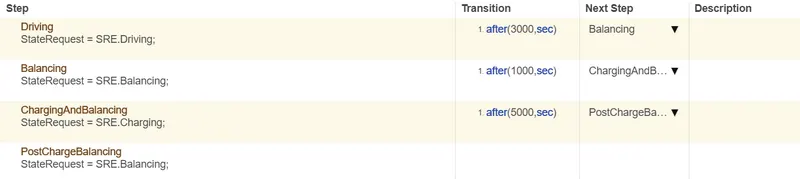
- By the help of Test sequence variant block the test case1 is selected
- Driving mode
- From the above fig we can unterstand at the time of the starting the battery undergoes to Driving mode for the period of 3000 sec.
- During this period the the battery is utilized to its peak performance.
- Which delivers higher power which satisfies the load.
- The SOC of the battery gets drained very quick .
- The battery temperature increases.
- Charging and balancing mode
- Then the battery undergoes to Chanrging and balancing mode for the period of 5000 sec.
- During this period the battery gets charged and its satisfies the load itself in the optimized way.
- Due to the charging and discharging occurs at the same time the battery temperatue gets rises to its higher rate in the short period of time.
- Here the voltage and current are in its peak rated value.
- Postcharge Balancing mode
- Then the battery undergoes to Postcharge Balancing mode for the Rest of its simulation time.
- During this period the battery goes to its standby mode .
- Where the battery is not utilized which is in its ideal state.
- So the temperature reduces slowly.
-
- Result
- Cell Voltage
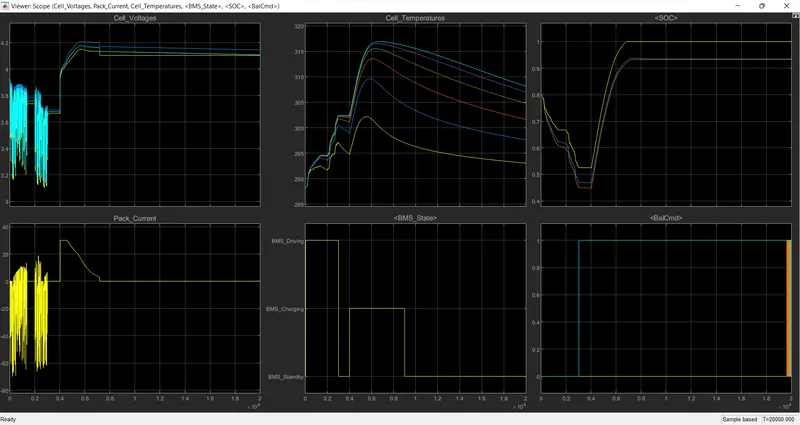
- From this plot we can understand the voltage rating of the 6 cell pack under different modes
- This is a battery pack of cell where each battery delivers different voltage and different SOC rate.
- Driving Mode
- During the first 3000 second we can notice there is voltage spikes .
- We can see that the battery volatge varries from 3.2 - 3.9 V as per the load rerquires.
- Charging and balancing mode
- After 3000 second the battery enters this mode for the period of 1000 sec.
- Where the battery gets charged so the voltage reaches its peak value.
- The battery is in ideal state there is no discharge in battery where the load is disconnected.
- The voltage reaches the value of 4.2 V its peak voltage rate.
- Postcharge balancing mode
- After 1000 sec the battery enters to balancing mode.
- Where the load is disconnected and the battery is in ideal state.
- The voltage value gets reduced to 4.1 V and further gets reduced .Due to its internal discharge.
- Pack Current
- From this plot we can understand the current rating of the 6 cell pack under different modes
- This is a battery pack of cell where each battery delivers different current and different SOC rate.
- Driving Mode
- During the first 3000 second we can notice there is current spikes .
- We can see that the battery volatge varries from -50 to 20 A as per the load rerquires.
- Charging and balancing mode
- After 3000 second the battery enters this mode for the period of 1000 sec.
- Where the battery gets charged so the current reaches its peak value.
- The battery is in ideal state there is no discharge in battery where the load is disconnected.
- The current reaches the value of 30 A its peak Current rate.
- Postcharge balancing mode
- After 1000 sec the battery enters to balancing mode.
- Where the load and charger is disconnected and the battery is in ideal state.
- The current value gets reduced to 0 A due to the load is disconnected.
- Cell Temperature
- From this plot we can understand the tempearture rating of the 6 cell pack under different modes
- This is a battery pack of cell where each battery delivers different temperature rate.
- Driving Mode
- During the first 3000 second we can notice there is temperature of the cell spikes from 287 kelvin.
- We can see that the battery volatge varries from 287 to 303 Kelvin due to the power consumed by the load.
- The temperature of the each cell varries as per the utilization of the load.
- Charging and balancing mode
- After 3000 second the battery enters this mode for the period of 1000 sec.
- Where the battery gets charged so the temperature reaches its peak value.
- Even through the load is disconnected and the battery is in ideal state there is no discharge in battery the temperature of the battery reaches to peak due its internal reaction.
- The temperature reaches the value of 317 Kelvin near to its peak temperature rate.
- Postcharge balancing mode
- After 1000 sec the battery enters to balancing mode.
- Where the load and charger is disconnected and the battery is in ideal state.
- The temperature reduces gardually to its ideal state.
- SOC
- From this plot we can understand the SOC rating of the 6 cell pack under different modes
- This is a battery pack of cell where each battery has different SOC rate.
- Driving Mode
- During the first 3000 second we can notice the SOC of the battery gets reduced from 80 to 45 % .
- We can see that SOC of the battery reduces due to the power consumed by the load.
- The SOC of the each cell varries as per the utilization of the load.
- Charging and balancing mode
- After 3000 second the battery enters this mode for the period of 1000 sec.
- Where the battery gets charged so the SOC increses gardually.
- The SOC reaches the value of 100%.
- Postcharge balancing mode
- After 1000 sec the battery enters to balancing mode.
- Where the load and charger is disconnected and the battery is in ideal state.
- The SOC of the battery remains same.
- Result
- Test case 2
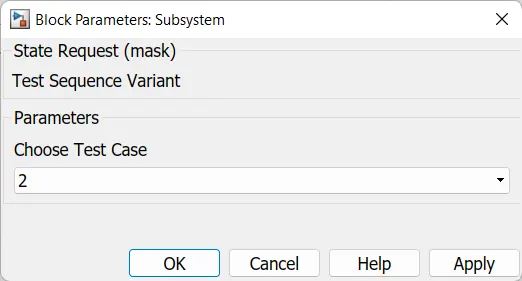
- By the help of Test sequence variant block the test case2 is selected
 .
.- Driving mode
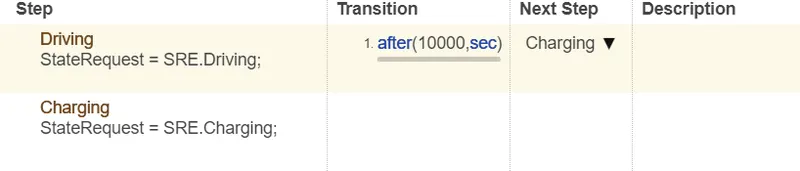
- From the above fig we can unterstand at the time of the starting the battery undergoes to Driving mode for the period of 10000 sec.
- During this period the the battery is utilized to its peak performance.
- Which delivers higher power which satisfies the load.
- The SOC of the battery gets drained very quick .
- The battery temperature increases.
- Charging mode
- Here the battery doesnt undergoes for charging mode.
- Due to the temperature of the battery exists its rated value.
- The BMS (Battery Management System) will isolates the battery from the system.
- So the SOC of the battery doent rise and stayed at 0%.
- Result
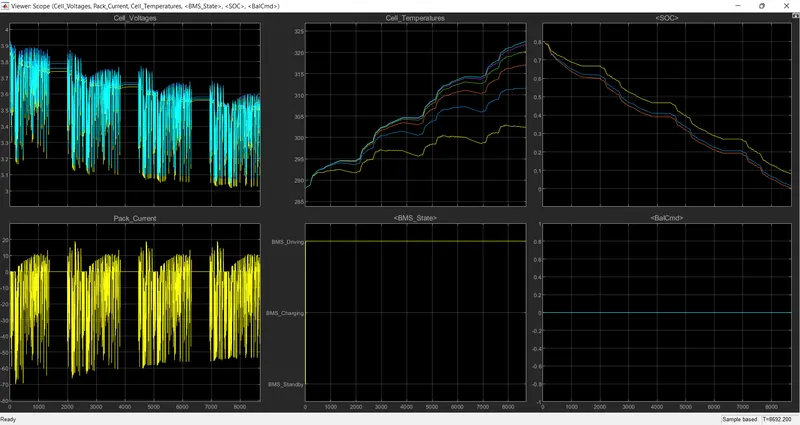
- Cell Voltage
- From this plot we can understand the voltage rating of the 6 cell pack under different modes
- This is a battery pack of cell where each battery delivers different voltage and different SOC rate.
- Driving Mode
- During the first 10000 second we can notice there is voltage spikes .
- We can see that the battery volatge varries from 3.1 - 3.9 V as per the load rerquires.
- Charging mode
- After 10000 second the battery doesnt enters this mode
- Where the SOC rate of the battery is at 0 %.
- The battery gets isolated from the system .
- Pack Current
- From this plot we can understand the current rating of the 6 cell pack under different modes
- This is a battery pack of cell where each battery delivers different current and different SOC rate.
- Driving Mode
- During the first 10000 second we can notice there is current spikes .
- We can see that the battery volatge varries from -70 to 20 A as per the load rerquires.
- Charging mode
- After 10000 second the battery doesnt enters this mode.
- An fault occurs and the battery is isolated by the BMS from the system.
- Cell Temperature
- From this plot we can understand the tempearture rating of the 6 cell pack under different modes
- This is a battery pack of cell where each battery delivers different temperature rate.
- Driving Mode
- During the first 10000 second we can notice there is temperature of the cell spikes from 298 kelvin.
- We can see that the battery volatge varries from 298 to 323 Kelvin due to the power consumed by the load.
- The temperature of the each cell varries as per the utilization of the load.
- Charging mode
- After 10000 second the battery doesnt enters this mode.
- Where the battery gets isolated by the BMS due to its temperature rise .
- SOC
- From this plot we can understand the SOC rating of the 6 cell pack under different modes
- This is a battery pack of cell where each battery has different SOC rate.
- Driving Mode
- During the first 10000 second we can notice the SOC of the battery gets reduced from 80 to 0 % .
- We can see that SOC of the battery reduces due to the power consumed by the load.
- The SOC of the each cell varries as per the utilization of the load.
- Charging mode
- After 10000 second the battery enters this mode for the period of 1000 sec.
- Where the battery gets isolated by the BMS due to its temperature rise .
- So the SOC of the battery remains at 0%.
- Test case 3
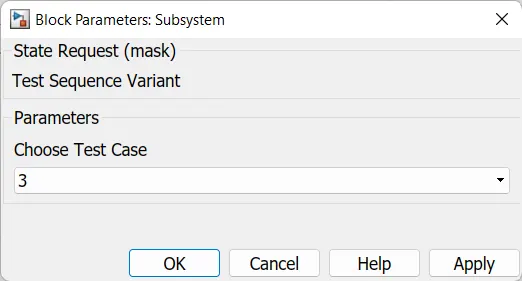
- By the help of Test sequence variant block the test case 3 is selected

- Charging mode
- Then the battery undergoes to Chanrging and balancing mode.
- During this period the battery gets charged and its satisfies the load itself in the optimized way.
- Due to the charging and discharging occurs at the same time the battery temperatue gets rises to its higher rate in the short period of time.
- Here the voltage and current are in its peak rated value.
- Result
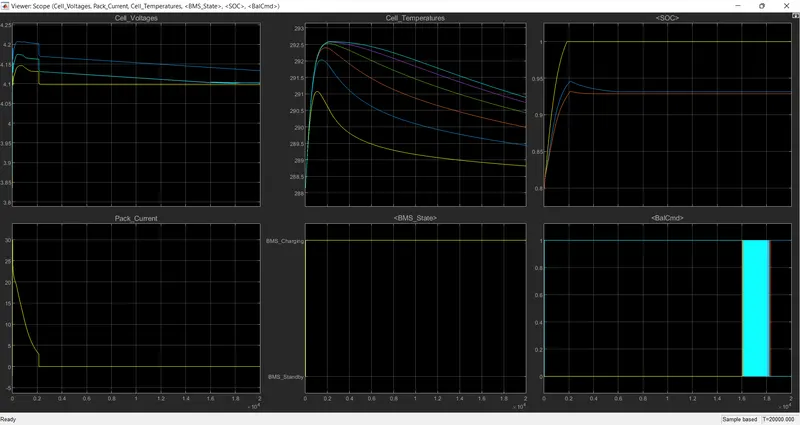
- Cell Voltage
- From this plot we can understand the voltage rating of the 6 cell pack under different modes
- This is a battery pack of cell where each battery delivers different voltage and different SOC rate.
- Charging Mode
- Where the battery gets charged so the voltage reaches its peak value.
- The battery is in ideal state there is no discharge in battery where the load is disconnected.
- The voltage reaches the value of 4.2 V its peak voltage rate.
- When the battery gets fully charged the BMS isolates the battery from the system.
- Pack Current
- From this plot we can understand the current rating of the 6 cell pack under different modes
- This is a battery pack of cell where each battery delivers different current and different SOC rate.
- Charging mode
- Where the battery gets charged so the current reaches its peak value.
- The battery is in ideal state there is no discharge in battery where the load is disconnected.
- When the battery gets fully charged the BMS isolates the battery from the system.
- The current reaches the value of 30 A its peak Current rate.
- Cell Temperature
-
-
- From this plot we can understand the tempearture rating of the 6 cell pack under different modes
- This is a battery pack of cell where each battery delivers different temperature rate.
- Charging mode
- Where the battery gets charged so the temperature reaches its peak value.
- Even through the load is disconnected and the battery is in ideal state there is no discharge in battery the temperature of the battery reaches to peak due its internal reaction.
- The temperature reaches the value of 292.5 Kelvin .
- SOC
- From this plot we can understand the SOC rating of the 6 cell pack under different modes
- This is a battery pack of cell where each battery has different SOC rate.
- Charging mode
- Where the battery gets charged so the SOC increses gardually.
- The SOC reaches the value of 100%.
- So the BMS isolates the battery from the system.
-
2.What is coulomb counting? Refer to the above model and explain how BMS implements coulomb counting for SOC estimation ?
Coulomb Counting
- Coulomb counting is a technique used to track the State of Charge of a battery pack.
- It works by integrating the active flowing current over time to derive the total sum of energy entering or leaving the battery pack.
- This produces a capacity that is typically measured in Amp-hours.
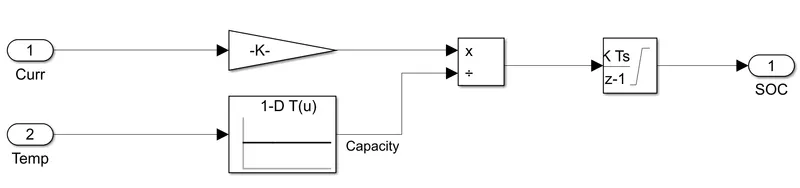
- soc(t)=soc(t-1) + [I(t)/Qn]*dt
- Where
- SOC(t)= state of charge at the estimated time.
- I(t)= discharging current.
- Qn= nominal battery capacity
- Working
- The Coulomb counting technique measures the discharging current of a battery and integrates the discharging current over time in order to estimate SOC.
- Coulomb counting method is done to estimate the, discharging current, and previously estimated SCC values.
- Integrating the current into or out of a battery gives the relative value of its charge.
- Limitations of coulomb counting
- Leakage current within a cell does not go through the current sensor and is therefore not taken into account.
- The offset in the measurement of the battery current will result in the SOC drifting up (or down) over time.
- Coulomb counting is not a preferred method for SoC estimation when a battery must be operated for a long time without full charge or discharge.
- Nevertheless, if the initial condition is known and the battery is operated for a relatively short period of time, then this method does provide a reliable measurement.
- This is important because, in order to design any estimator, a true measurement must exist for purposes of comparison.
- Standby Batteries
- Even if the battery is full, a small offset in the current sensor in the discharging direction will result in the reported SOC drifting all the way to 0% SOC over time.
- HEV Pack
- Uses energy from the battery when it needs it, and replenishes it when it can, trying to maintain a 50% SOC.
- While the reported SOC may very well stay around 50%, over time the actual SOC will drift due to the small offset in the current sensor.
- Eventually, the actual battery charge will approach either the full or the empty state.
BMS implements coulomb counting for SOC estimation
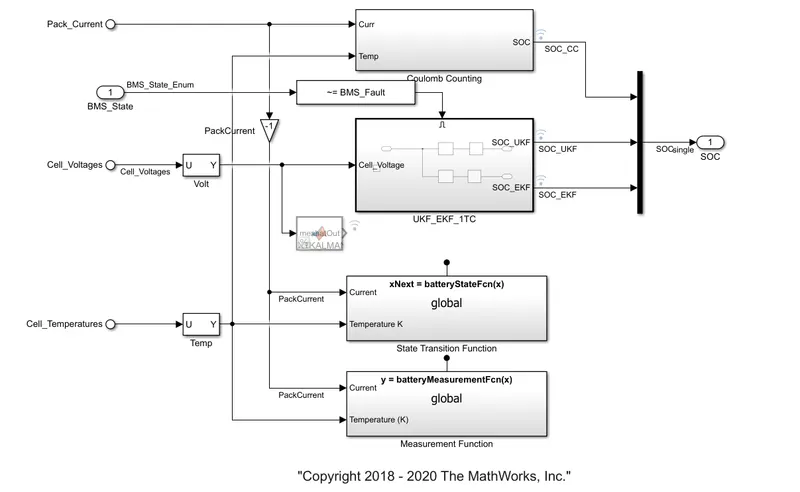
- The estimation of the SOC of a Li-Ion battery in this method is based on monitoring both the voltage and the current.
- The operation mode of the battery is recognized by the direction of current through the battery system.
- When the battery is in open-circuit mode, I(bat) = 0. The information needed to carry monitoring is the measurement of the battery voltage, the current flowing through it, and the operating temperature.
- Coulomb counter ΔQ is used to track the SOC when the battery is charged or discharged. The amount of charges ΔQ in an operating period τ is obtained by temporal integration of a measured charging/discharging .