Week-4 Challenge WOT Condition Part-2
1 A) DIFFERRENCE BETWEEN MAPPED AND DYNAMIC MODEL OF THE ENGINE,MOTOR AND GENERATOR
| S.NO | MAPPED MODEL OF ENGINE/MOTOR/GENERATOR | DYNAMIC MODEL OF ENGINE/MOTOR/GENERATOR |
| 1 | It consists of predefined data in lookup table . The datas are predefined in this model. | This model obtain data from the subsystems present in the model. This model consists of real time parameters. |
| 2 | Due to the predefined data .This model is not consider for real time simulation. | Due to the presence of real time parameters.This model is consider for real time simulation. |
| 3 | This takes less amount of time comparing to Dynamic model. | It is time consuming due to the presence of many subsystems / real time parameters. |
| 4 | It has low accuracy due to the predefined datas. | It has more accuracy because of the real time parameters consideration. |
| 5 | In case of Engine Mapped engine represent macro engine behavior as a set of look up table as functions of commanded load and measured engine speed | In case of Engine,Dynamic engine decompose rngine behavior into induvidual component models that account for engines dynamics, most notably intake aitflow and turbocharger dynamics. |
B)CHANGING OF MODEL TYPE
| MODEL | MAPPED MODEL | DYNAMIC MODEL |
| Engine | SiCiPtReferenceApplication/Passenger Car/Engine(Right Click)/Variant/Open/SiMappedEngine | SiCiPtReferenceApplication/Passenger Car/Engine(Right Click)/Variant/Open/SiEngine |
| Motor/Generator | EvReferenceApplication/Passenger Car/Electric Plant/Motor Block(Right click)/Open/MotGenEvMapped (MotGenEvMapped) | EvReferenceApplication/Passenger Car/Electric Plant/Motor Block(Right click)/Open/MotGenEvDynamic (MotGenEvDynamic) |
2 A)MODEL CALCULATION OF MILES PER GALLON
- MPG ------> Miles per gallon ,It is is a fuel economy rating determined by how far a car can travel on a gallon of gasoline or diesel. Although the metric version would be kmp (Kilometer per Liter, MPG is adopted in many metric-system countries, like Canada.
- MPGe -------> Miles per gallon equivalent ,It is a measure of the average distance traveled per unit of energy consumed.It is used to compare energy consumption of alternative fuel vechicle , plug-in electric vechicle and other advanced technology vehicles with the energy consumption of conventional internal combustion vehicles rated in miles per U.S gallon.
CALCULATION OF MILES PER GALLON FOR COMBUSTION ENGINE
-
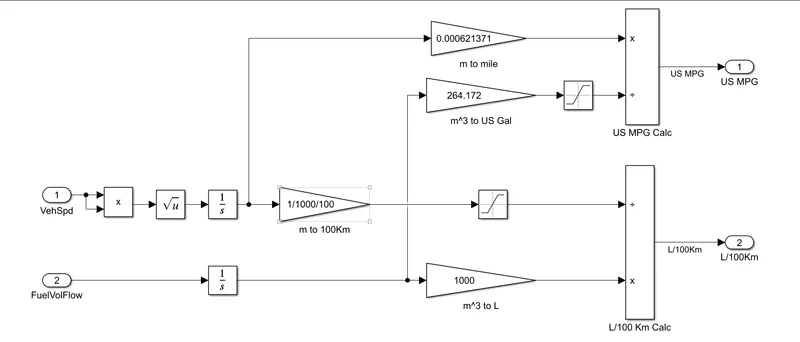
- The above represented block is used to calculate miles per gallon for combustion engine.
- First the speed (VehSpd) is integrated to find the distance travelled by the vechicle in meter.
- The meter is converted to mile by multiplying with 0.000621371.
- The Fuel rate (FuelVolFlow) is integrated to find the fuel consumption in meter cube (m^3).
- The meter cube is converted to US Gal by multiplied with 264.172.
- By multiplying and dividing the mile and US Gal we can achieve US MPG (miles per gallon).
CALCULATION OF MILES PER GALLON FOR HEV
-
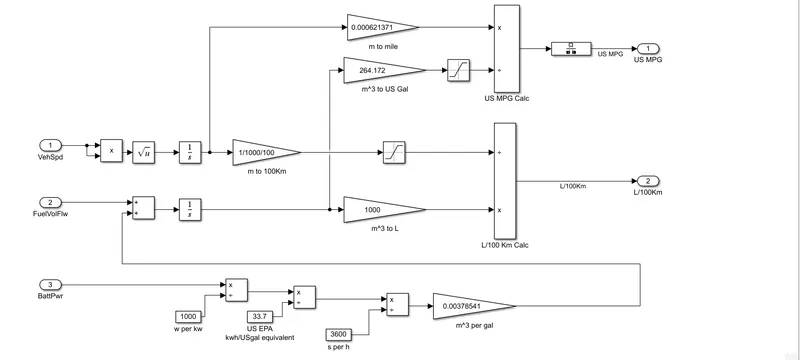
- i) FOR BATTERY POWERED (MPGe)
- The above represented block is used to calculate miles per gallon for HEV.
- The Battery power is converted from watt(w) to kilowatt (kw) by divided by 1000.
- Then it is divided by 33.7 for the conversion of kwh/USGe .
- Then it is divided by 3600 for convention of hour to seconds.
- It is multiplied by 0.00378541 for the convertion of meter cube per gallon.
- Then it is added with the fuelvolflow.
- ii) FOR COMBUSTION ENGINE (MPG)
- The above represented block is used to calculate miles per gallon for combustion engine.
- First the speed (VehSpd) is integrated to find the distance travelled by the vechicle in meter.
- The meter is converted to mile by multiplying with 0.000621371.
- The Fuel rate (FuelVolFlow) is added with the output of battery power of m cube per gallon.
- Then it is integrated to find the fuel consumption in meter cube (m^3).
- The meter cube is converted to US Gal by multiplied with 264.172.
- By multiplying and dividing the mile and US Gal we can achieve US MPG (miles per gallon).
B) FACTORS ARE CONSIDERED TO MODEL FUEL FLOW
- One Gallon ------> 33.7kw.
- One gallon -------> 4.546092 litre.
- For electric vechile it should be mentioned as MPGe (miles per gallon equivalent).
- Vechicle speed , battery power is the main factor for EV .
- Vechicle speed , battery power , fuel consumption is the main factor for HEV .
3)HEV REFERENCE APPLICATION WITH WOT DRIVE CYCLE
OBJECTIVE
To run the HEV ReferenceApplication with WOT drive cycle and change the grade and wind velocity in the environment block.
MODEL
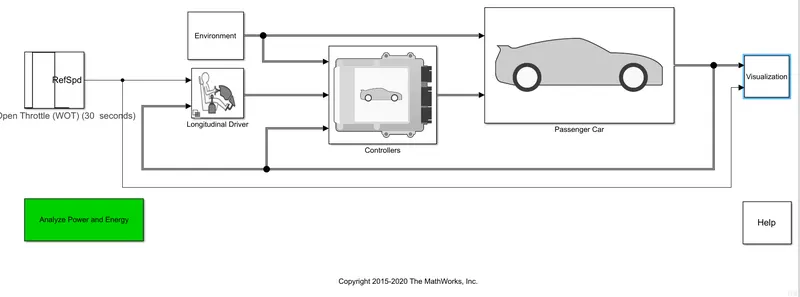
This is the HEV ReferenceApplication with WOT drive cycle which can be obtained from "GETTING STARTING WITH POWERTRAIN BLOCKSET" which can be found in Matlab documentation.
BLOCKS USED
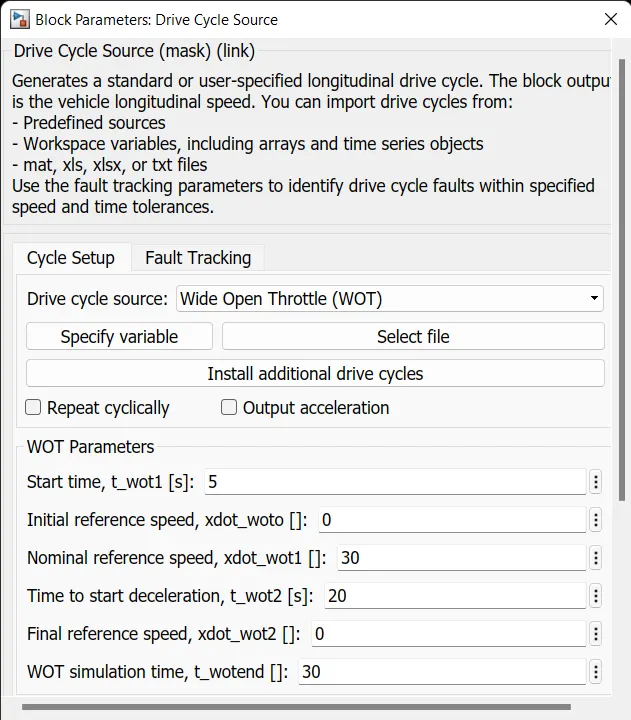
- WIDE OPEN THROTTLE (WOT)
- This block consists of different drive cycles.
- For this simulation we have selected the Wide open throttle (WOT).
- This drive cycle is the input refference speed for the vechicle .
- Which runtime is 30 seconds.
- LONGINTUDINAL DRIVER
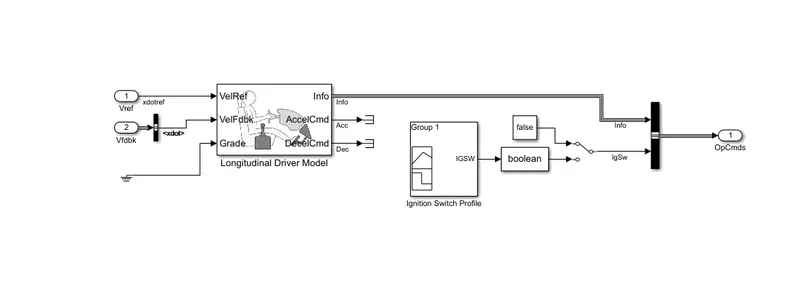
- This block consists of both open and closed loop .
- The longitudinal driver tries to achieve the refference speed which is griven as output.
- It is acts like a real time driver.
- ENVIRONMENT
-
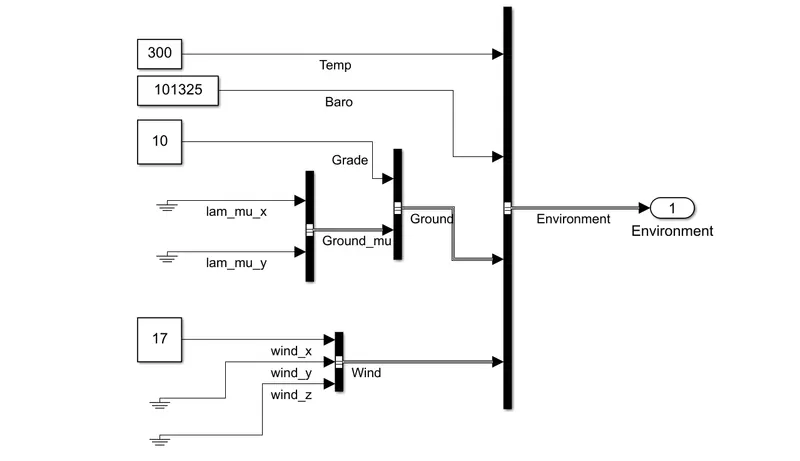
- This block consists of Environmental parameters which affects the preformance of the vechicle.
- Like Atmospheric temperature , Pressure, Grade,wind.
-
- CONTROLLERS
- This block consists of both Master and Slave controllers .
- This block consists of PCM (POWERTRAIN CONTROL MODULES).
- ECM (ENGINE CONTROL MODULE)
- Which controls the macro level of the Engine functions like sprak ingition, turo charge, temperature control and fuel low rate.
- HCM (HYBRID CONTROL MODULE)
- Which controls the macro level of the Engine control (like sprak ingition, turo charge, temperature control and fuel low rate) and the motor/generator ( Torque, speed ,SOC,braking etc).
- ECM (ENGINE CONTROL MODULE)
- PASSANGER CAR
- It consists of Engine,Electric plant and the Drivetrain of the vechicle.
- Engine
- Here the Engine model can be changed into mapped or dynamic model.
- The Engine is controlled by the controller.
- Electric plant
- This block consists of Motor/Generator and the battery.
- Drivetrain
- This block consists of type of transmission, gearratio.
- VISUALIZATION
- In this block the calculations are made and the output scope is present .
- Like convertion of miles to MPG,Vechicle speed,SOC , diustance travelled etc.
- This block acts like the dashboard of the vechicle.
- ANALYZE POWER AND ENERGY
- The output is stored in file format.
- HELP
- This block leads to the matlab documentaion.
- OUTPUT SIMULATING USING DEFAULT VALUES
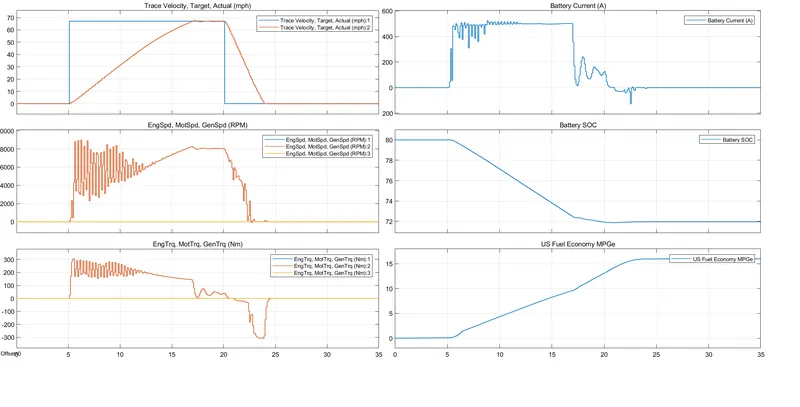
- TARCE VELOCITY,TARGET,ACTUAL (mph)
- The blue line indicates the input reffrence speed which is given by WOT duty cycle for 30 seconds.
- The red line indicates the actual output of the vechicle.
- From this we can understand that the vechicle take 11.89 seconds to reaches its maximum speed from 0 - 67.1 mph.
- By the combiantional output of both motor and the engine.
- ENGSPEED,MOTSPEED,GENSPEED
- This plot represnets the Engine,motor,generator speed.
- At the initial 7 seconds , we can notice the oscillation . The motor and generator attains the peak performance to increase the speed of the vechicle.
- Which is contributed to attain the maximum speed (67.1 mph) of the vechicle.
- ENGTRQ,MOTTRQ,GENTRQ
- This plot represnets the Engine,motor,generator torque.
- At the initial 7 seconds , we can notice the oscillation . The motor and generator attains the peak performance to increase the speed of the vechicle.
- Which is contributed to attain the maximum speed (67.1 mph) of the vechicle.
- At the end of the duty cycle (20 - 24 second) we can notice the motor torque rises in the negative direction (regenerative braking mode) where the motor acts like a generator .
- Where the vechicle takes 4 second delay to reaches the rest position.
- BATTERY CURRENT (A)
- The battery discharges approximately 500A (its peak discharge current) for the time period of 11.89 seconds
- Until the vechicle reaches it maximum speed.
- We can notice that when the regenerative braking is applied the cureent flows in negative direction (battery gets charged) .
- BATTERY SOC
- From the plot we can identify that the battery percentage is reduced to 8.07 % in the period of 15 seconds.
- USFUEL ECONOMY MPGe
- From the plot we can identify that the vechicle consumes 13.05kw of engery to reaches it maximum speed.
2.OUTPUT SIMULATING USING CHANGE IN ENVIROMENTAL VALUES VALUES
From the environment block the value of the grade and the wind is changed as per the fig.
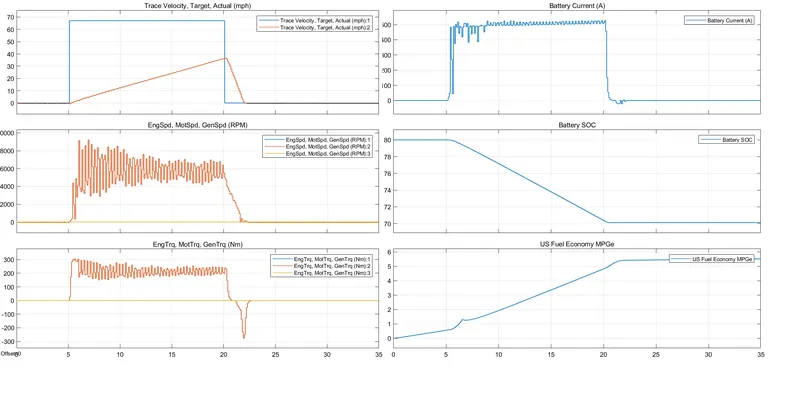
- TARCE VELOCITY,TARGET,ACTUAL (mph)
- The blue line indicates the input reffrence speed which is given by WOT duty cycle for 30 seconds.
- The red line indicates the actual output of the vechicle.
- From this we can understand that the vechicle cannot reaches its maximum speed because of the change in parameters.
- It take 11.89 seconds to reaches the speed of 0 - 36.9 mph.
- By the combiantional output of both motor and the engine.
- ENGSPEED,MOTSPEED,GENSPEED
- This plot represnets the Engine,motor,generator speed.
- During the drive cycle time (5 - 20 seconds) , we can notice the oscillation . The motor attains the peak performance to increase the speed of the vechicle.
- Which is contributed to attain the maximum speed (36.9 mph) of the vechicle.
- ENGTRQ,MOTTRQ,GENTRQ
- This plot represnets the Engine,motor,generator torque.
- During the drive cycle time (5 - 20 seconds), we can notice the oscillation . The motor attains the peak performance to incrrese the speed of the vechicle.
- Which is contributed to attain the maximum speed (36.9 mph) of the vechicle.
- At the end of the duty cycle (20 - 22 second) we can notice the motor torque rises in the negative direction (regenerative braking mode) where the motor acts like a generator .
- Where the vechicle takes 2.3 second delay to reaches the rest position.
- BATTERY CURRENT (A)
- The battery discharges approximately 500A (its peak discharge current) for the time period of 15.18 seconds
- Until the vechicle reaches it maximum speed.
- We can notice that when the regenerative braking is applied the cureent flows in negative direction (battery gets charged) .
- BATTERY SOC
- From the plot we can identify that the battery percentage is reduced to 10 % in the period of 15 seconds.
- USFUEL ECONOMY MPGe
- From the plot we can identify that the vechicle consumes 4.7kw of engery to reaches it maximum speed (36.9 mph).
4) COMPARING HEV AND EV UNDER DEFAULT VALUES
OBJECTIVE
To run the EV ReferenceApplication with WOT drive cycle and to comapre with the HEV model with default configuration.
MODEL
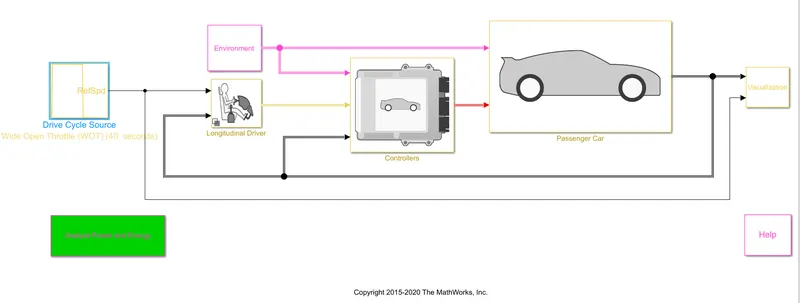
This is the EV ReferenceApplication with WOT drive cycle which can be obtained from "GETTING STARTING WITH POWERTRAIN BLOCKSET" which can be found in Matlab documentation.
BLOCKS USED
- WIDE OPEN THROTTLE (WOT)
- This block consists of different drive cycles.
- For this simulation we have selected the Wide open throttle (WOT).
- This drive cycle is the input refference speed for the vechicle .
- Which runtime is 30 seconds.
- LONGINTUDINAL DRIVER
- This block consists of both open and closed loop .
- The longitudinal driver tries to achieve the refference speed which is griven as output.
- It is acts like a real time driver.
- ENVIRONMENT
-
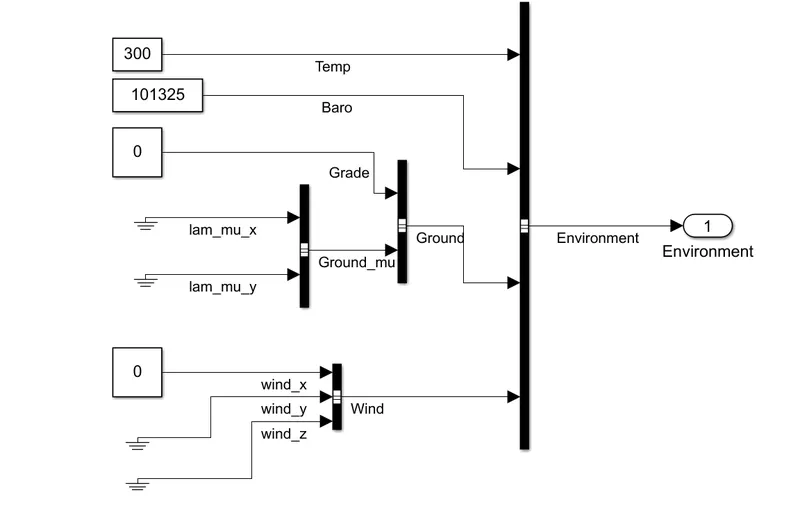
- This block consists of Environmental parameters which affects the preformance of the vechicle.
- Like Atmospheric temperature , Pressure, Grade,wind.
-
- CONTROLLERS
- This block consists of both Master and Slave controllers .
- This block consists of PCM (POWERTRAIN CONTROL MODULES).
- BATTERY MANGEMENT SYSTEM
- Which controls the Soc ,rate of discharge, etc
- REGENERATIVE BRAKING CONTROL
- Which controls the motor to act like like a generator when the brake is applied .
- It consists of both serie and parallel.
- MOTOR TORQUE AND POWER MANAGEMENT
- Which controls the motor torque which is required by the vechicle to attain the speed
- And manage the required power to the motor for better performance
- BATTERY MANGEMENT SYSTEM
- PASSANGER CAR
- It consists of Electric plant and the Drivetrain of the vechicle.
- Electric plant
- This block consists of Motor/Generator and the battery.
- Drivetrain
- This block consists of type of transmission, gearratio.
- VISUALIZATION
- In this block the calculations are made and the output scope is present .
- Like convertion of miles to MPG,Vechicle speed,SOC , diustance travelled etc.
- This block acts like the dashboard of the vechicle.
- ANALYZE POWER AND ENERGY
- The output is stored in file format.
- HELP
- This block leads to the matlab documentaion.
- OUTPUT SIMULATING USING DEFAULT VALUES
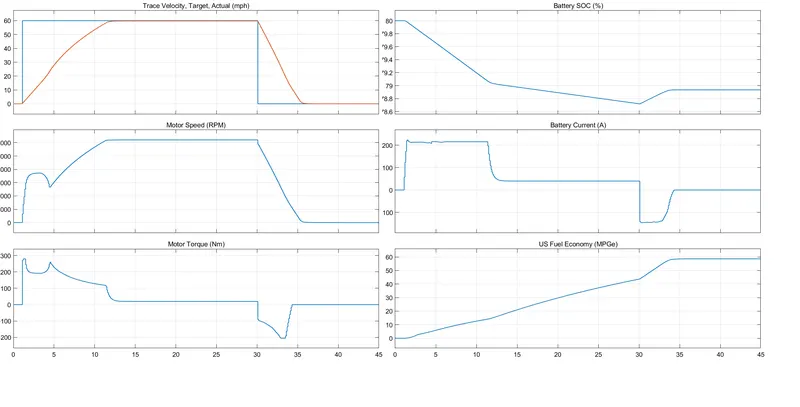
- TARCE VELOCITY,TARGET,ACTUAL (mph)
- The blue line indicates the input reffrence speed which is given by WOT duty cycle for 40 seconds statrs from (1 - 30)seconds.
- The red line indicates the actual output of the vechicle.
- From this we can understand that the vechicle take 12 seconds to reaches its maximum speed from 0 - 59 mph.
- MOTOR SPEED (RPM)
- This plot represnets the motor speed.
- The motor takes 12 seconds (1 - 13 )seconds to attains the peak performance of 5559 RPM.
- Which is contributed to attain the maximum speed (59 mph) of the vechicle.
- MOTOR TORQUE (NM)
- This plot represnets the motor torque.
- At the initial 3 seconds (1 - 4 ) seconds , we can notice the oscillation . The motor attains the peak performance to increase the speed of the vechicle.
- Which is contributed to attain the maximum speed (59 mph) of the vechicle.
- At the end of the duty cycle (30 - 34 second) we can notice the motor torque rises in the negative direction (regenerative braking mode) where the motor acts like a generator .
- Where the vechicle takes 4 second delay to reaches the rest position.
- BATTERY CURRENT (A)
- The battery discharges approximately 220A (its peak discharge current) for the time period of (1 - 11) seconds .
- Until the vechicle reaches it maximum speed.
- We can notice that when the regenerative braking is applied the cureent flows in negative direction (battery gets charged) for the period of (30 -36) seconds.
- The batterty gets charged approximately 145 A (its peak charging current).
- BATTERY SOC
- From the plot we can identify that the battery percentage is drastically reduced to 0.95 % in the period of (1 - 11.8 ) seconds where the vechicle reaches its max speed of 59 mph .
- To maintain its max speed (59 mph) for the period of (11.8 - 30) seconds,The battery consumption is less 0.3 % .
- When the regenerative braking is applied for the period of (30 - 36) seconds,The battery gets charged as +0.2% .
- The Toatl consumption fo battery is 1.05 %
- USFUEL ECONOMY MPGe
- From the plot we can identify that the vechicle consumes 57kw of engery to reaches it maximum speed.
RESULT
| EV | HEV | |
| DESIGN | Simple comapring to HEV | Complex design |
| SPEED | Maximum speed is 59 mph | Maximum speed is 68 mph |
| TORQUE | Maximum torque is 6000RPM | Maximum torque is 9000RPM ,because of the combinational effort of motor and engine |
| SOC | In case of EV the rate of discharge is very low comapring to HEV, The maximum battery discharge is 1% only.because it contains of huge battery capacity | In case of HEV the rate of discharge is very High comapring to EV, The maximum battery discharge is 10% .Here the battery capacity is low due to the presence of Engine |
| FUEL ECONOMY | It is thrice as HEV because of battery only | It is very low comparing to EV because of both engine and battery |