Week 7 State of charge estimation
1)
for each of the test cases we have to select them from dashboard
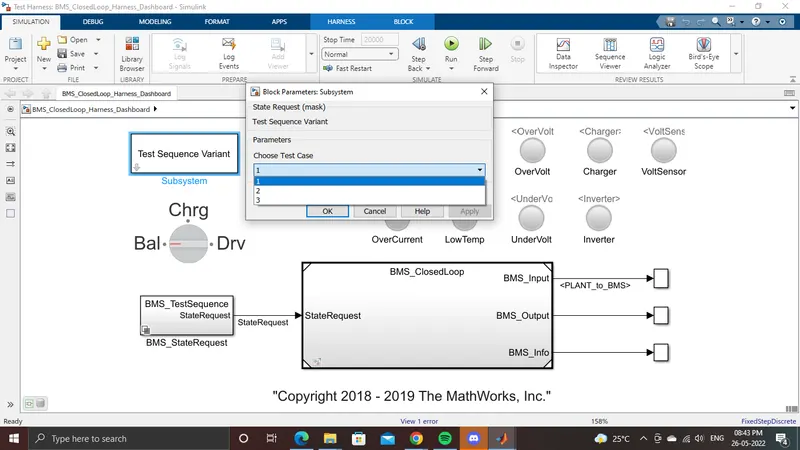
then run the simulation
TEST CASE 1:
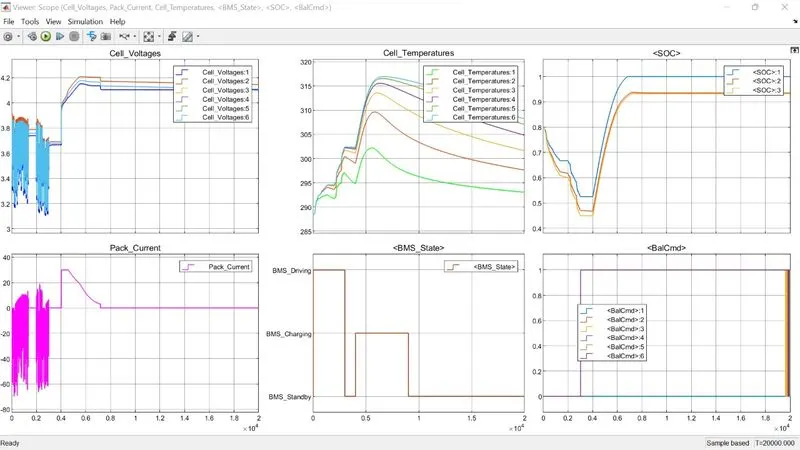
CELL VOLTAGES AND CURRENT-for first 3000sec all 6cells are in drive mode and is tandby mode for 1000-2000sec.voltages vary from 3.1-3.9v.cell balancing occurs from 3-4000 sec and cell balancing occurs.after 4000 sec charging occurs.cell balancing occurs around 9000sec.in standby mode.
CELL TEMP-initially the temperature increases from 288-302k.at3000sec-4000sec cell temperature falls due to standby mode.after 3000sec temperature starts increasing where cell1 is 302k and cell6 is 317k.after 9000k cell temperature reduces and remains stable.
BMS-for 3000sec the battery module is discharging.from 3000-4000sec the battery is in standby mode.after4000sec to 9000sec the battery module is charging and balancing mode.after9000sec post charging balancing mode operates upto end of simulation.
SOC-Initially cahrge is around 80%.yellow plot represents coulomb counting technique.blue plot represents unscented kalman filter technique.red plot represents extended kalman technique.initially at 3000sec soc decreases to 45% during drive mode.after3000sec upto 4000sec soc is constant at 45% as standby mode.4000-9000sec is charging mode.after9000sec becomes constant approx 94%.
TEST CASE 2:
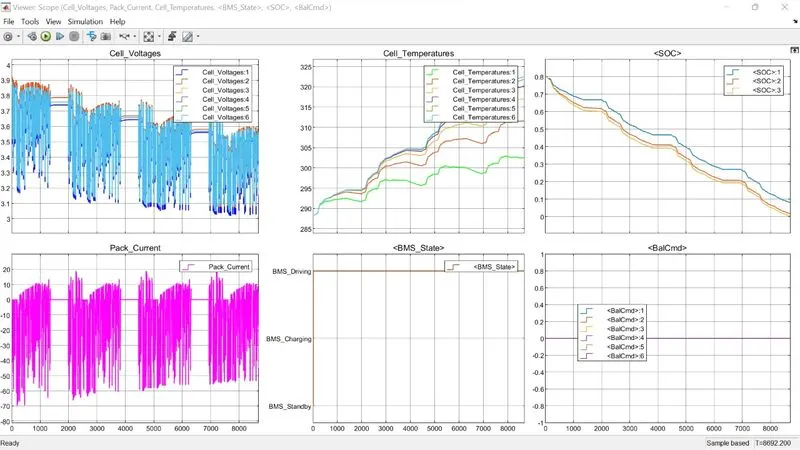
here driving mode is plotted.
cellvoltages vary from 3.9 to 3.05V.capacity is drained at 9000sec.maximum discharge is at 70A
here cell1 is having higher temperature from 288k-302k.cell 6 temperature varies from 288-322k.
entire sequence is performing in drive mode.
SOC reduces from 80 to 0% in entire drive mode.in standby modes SOC remains constant.
Balancing is 0 as its in drive mode.
TEST CASE 3:
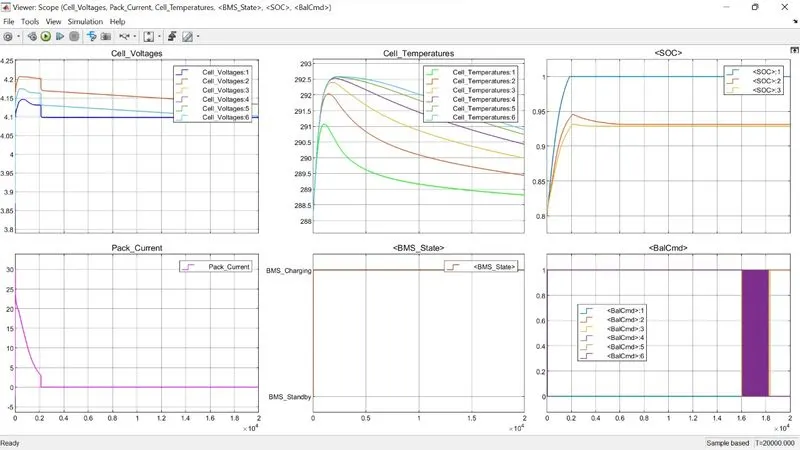
in cell 2 voltage rise to 4.2V and stabilise at 4.15v.cell 1 stabilises at 4.08v.battery pack current raising from 0A to 30A and starts to reduce at 2.5A gradually at end of full charging at 2000sec and is fully charged to 100%.flow will be cut off afterwards.
cell temperature continue to increase upto full charge 2000sec and then reduces.
actual rate of charge is around 93% as shown above.
from 0sec the cell6 and 2 start balance wrt to cell 1 and at end of simulation all cell are trying to balance it.
CONCLUSION-Hence all test cases are discussed and analysed.
2).
Coulomb counting is a technique used to track the State of Charge of a battery pack. It works by integrating the active flowing current (measured in amps) over time to derive the total sum of energy entering or leaving the battery pack. This produces a capacity that is typically measured in Amp-hours.
SOC estimation in BMS Model
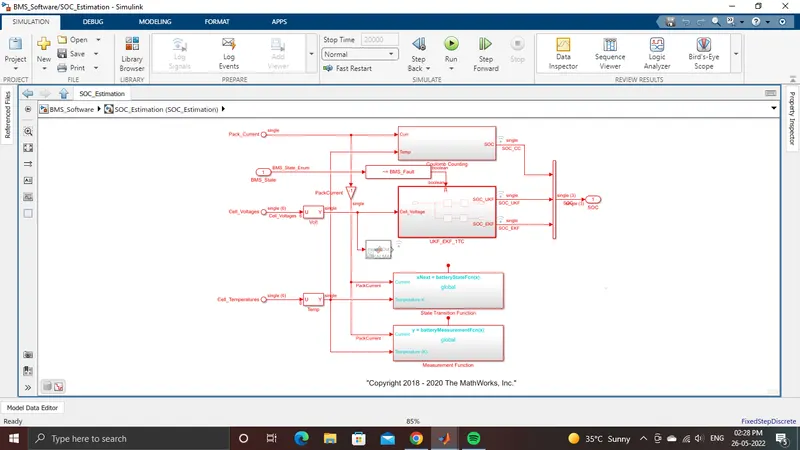
It is shown Below
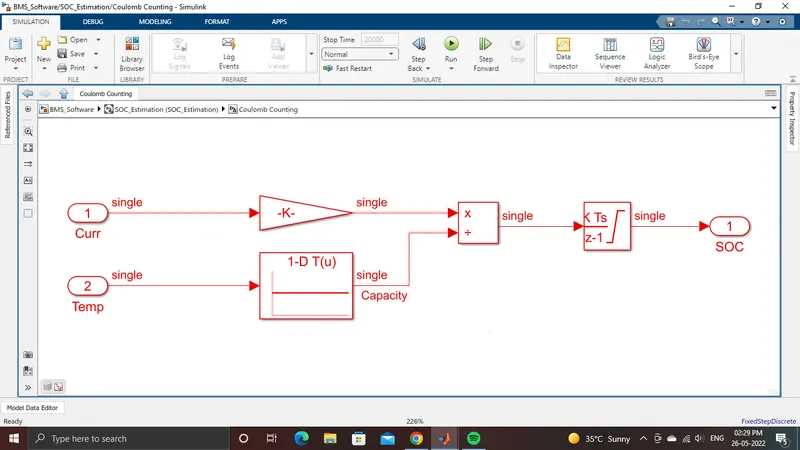
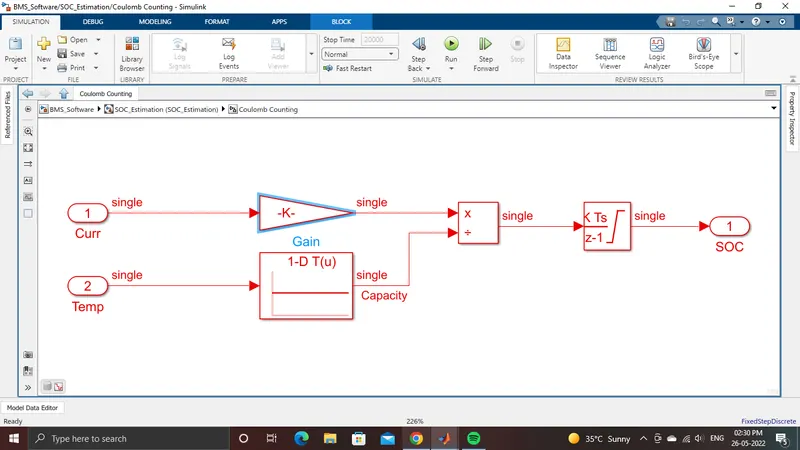
1/3600 to convert to ampere/hour.
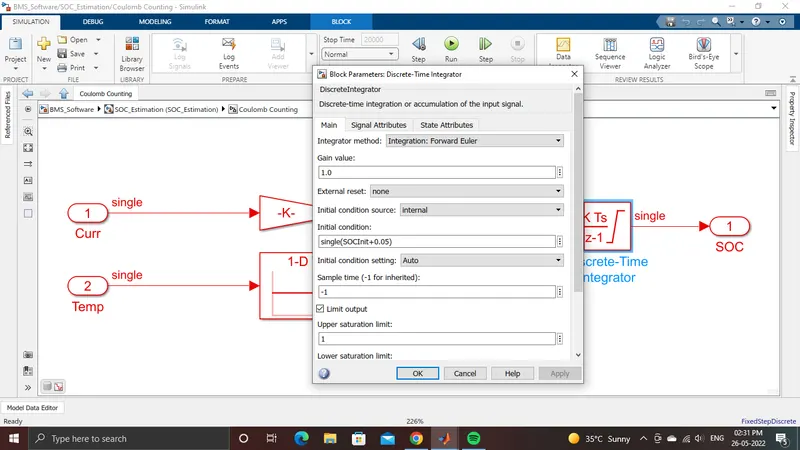
value divided by capacity due to temperature change,then integrated with 1.
saturation limits from 0 to 1.
SOC values will be got from 0-1 multiplying by 100 to get percentage of SOC.