Week 7 State of charge estimation
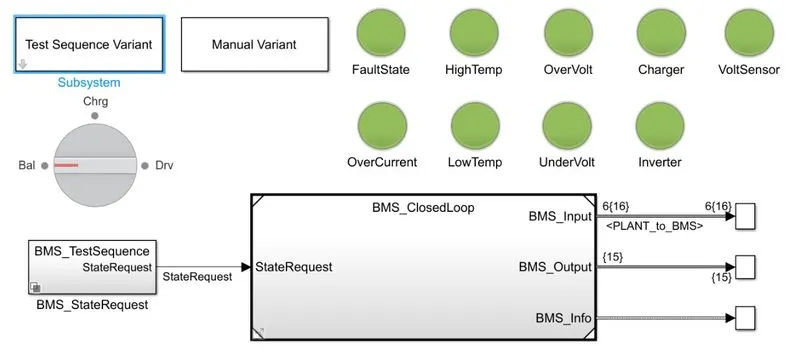
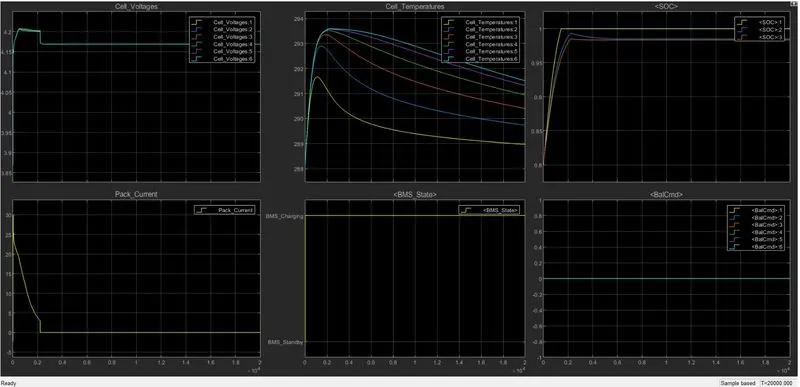
Aim :- Simulate the three test cases from harness dashboard and write a report on the results.
Objective :- Explain coulomb counting and also explain how BMS implements coulomb counting for SOC estimation.
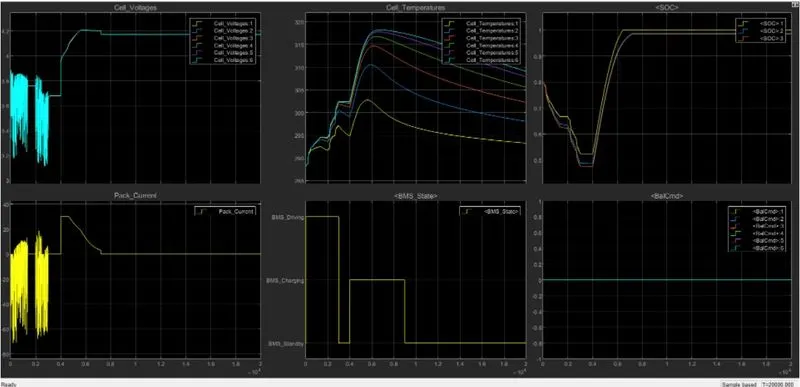
Simulate the three test cases from the harness dashboard and write report on it.
(1)Theory :-
What is Coulomb counting,
The estimation of the state of charge (SOC) of a lithium battery is technically difficult, particularly in applications that don’t fully charge the battery or fully discharge it. Such an application is a hybrid electric vehicle (HEV). The challenge stems from the fact that lithium batteries have a very flat voltage discharge characteristic. There is little change of voltage from a 70% SOC to a 20% SOC. In fact, voltage changes due to temperature change are similar to the change of voltage due to discharge, making it essential to compensate for battery temperature if SOC is to be derived from voltage.
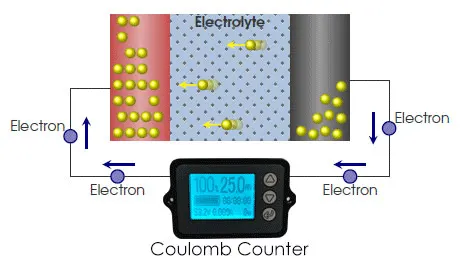
Coulomb counting is a technique used to track the state of charge of a battery pack. It works by integrating the active flowing current (measured in amps) over time to derive the total sum of energy entering or leaving the battery pack. This produces a capacity that is typically measured in Amp-hours.
Rather than coulomb counting there are other methods are also available to measure SOC,
Voltage method :-
Measuring state-of-charge by voltage is simple, but it can be inaccurate because cell materials and temperature affect the voltage. The most blatant error of the voltage-based SoC occurs when disturbing a battery with a charge or discharge. The resulting agitation distorts the voltage and it no longer represents a correct SoC reference. To get accurate readings, the battery needs to rest in the open circuit state for at least four hours; battery manufacturers recommend 24 hours for lead acid. This makes the voltage-based SoC method impractical for a battery in active duty.
Hydrometer :-
The hydrometer offers an alternative to measuring SoC of flooded lead acid batteries. Here is how it works: When the lead acid battery accepts charge, the sulfuric acid gets heavier, causing the specific gravity (SG) to increase. As the SoC decreases through discharge, the sulfuric acid removes itself from the electrolyte and binds to the plate, forming lead sulfate. The density of the electrolyte becomes lighter and more water-like, and the specific gravity gets lower.
Impedance Spectroscopy :-
Battery state-of-charge can also be estimated with impedance spectroscopy using the Spectro complex modeling method. This allows taking SoC readings with a steady parasitic load of 30A. Voltage polarization and surface charge do not affect the reading as SoC is measured independently of voltage. This opens applications in automotive manufacturing where some batteries are discharged longer than others during testing and debugging and need charging before transit. Measuring SoC by impedance spectroscopy can also be used for load leveling systems where a battery is continuously under charge and discharge.
Implementation of Coulomb counting using BMS,
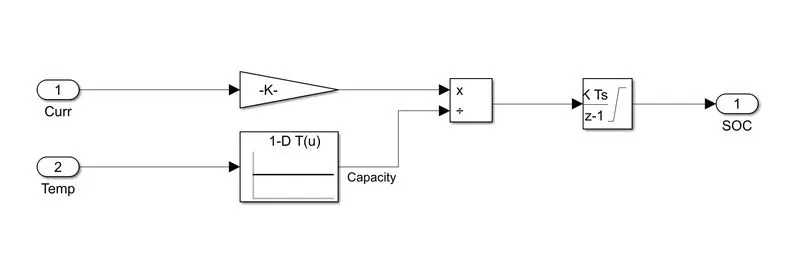
To determine available capacity, coulomb counting relies on the integration of the current drawn from and supplied to a battery over time, `tau``epsilon[t0 t1]`, as given by
SOC(`t`) = SOC`(t0)`-`int_0^1 (eta(tau)I(tau))/C_b^o d(tau)`
where,
I is the current.
η is the efficiency during charge and discharge operations.
Simulation of Li ion Battery Management System :-
(2) Theory
Battery management system (BMS) is technology dedicated to the oversight of a battery pack, which is an assembly of battery cells, electrically organized in a row x column matrix configuration to enable delivery of targeted range of voltage and current for a duration of time against expected load scenarios. The oversight that a BMS provides usually includes:
- Monitoring the battery
- Providing battery protection
- Estimating the battery’s operational state
- Continually optimizing battery performance
- Reporting operational status to external devices
Here, the term “battery” implies the entire pack; however, the monitoring and control functions are specifically applied to individual cells, or groups of cells called modules in the overall battery pack assembly. Lithium-ion rechargeable cells have the highest energy density and are the standard choice for battery packs for many consumer products, from laptops to electric vehicles. While they perform superbly, they can be rather unforgiving if operated outside a generally tight safe operating area (SOA), with outcomes ranging from compromising the battery performance to outright dangerous consequences.
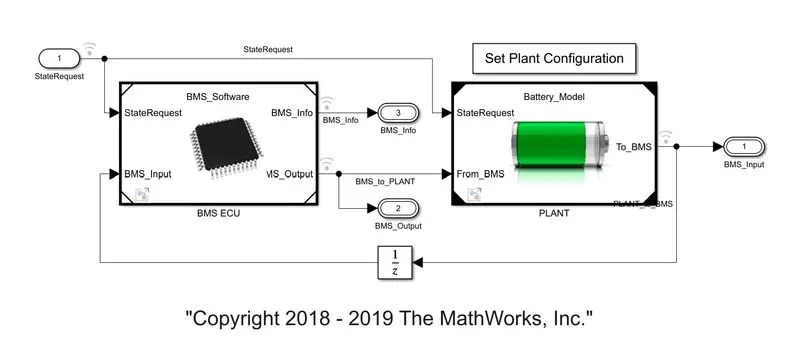
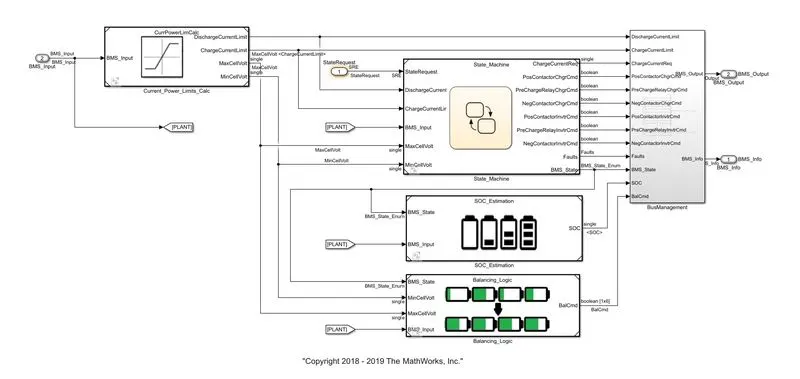
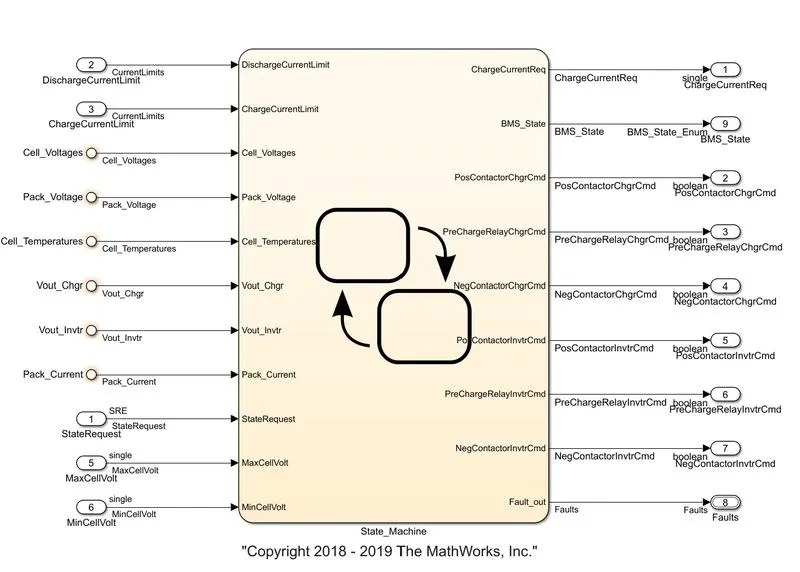
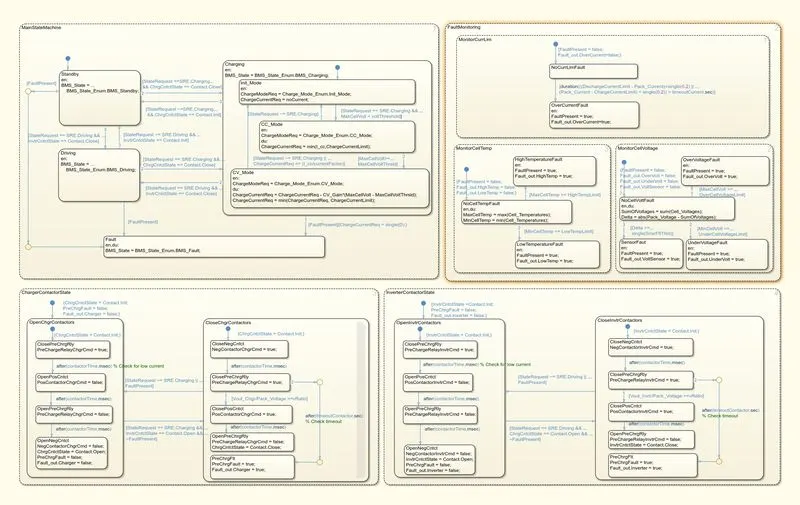
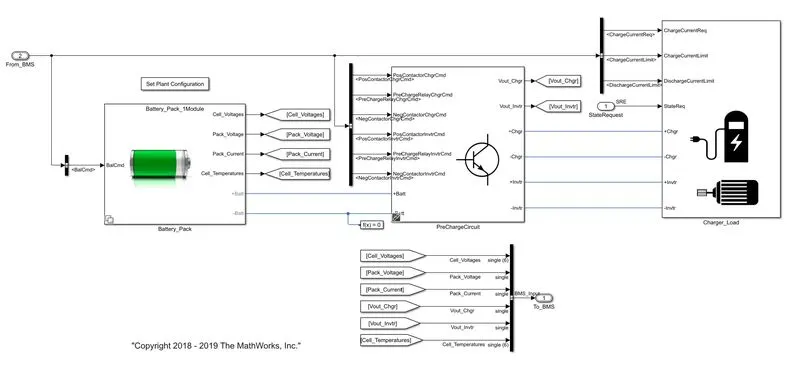
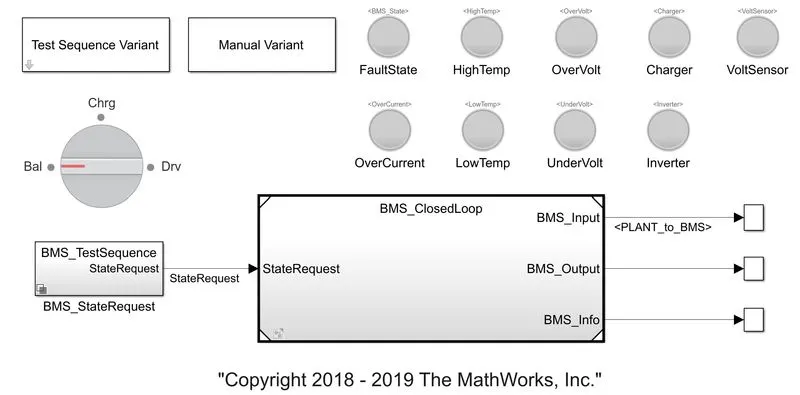
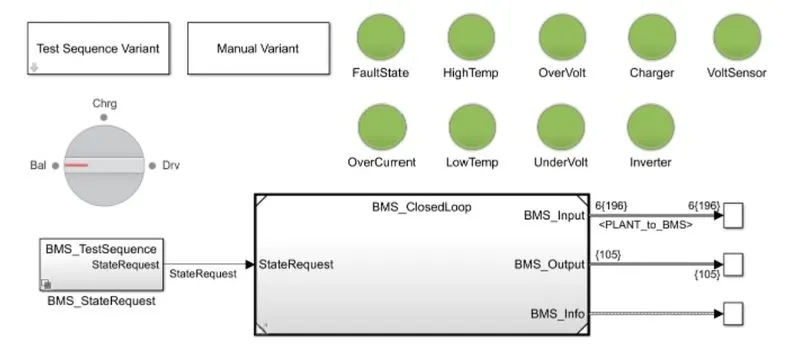
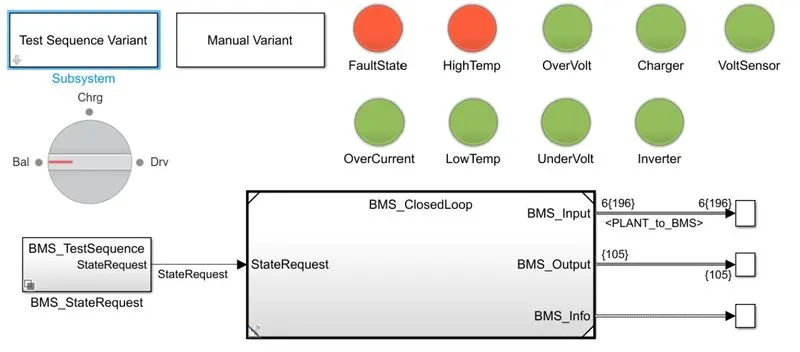
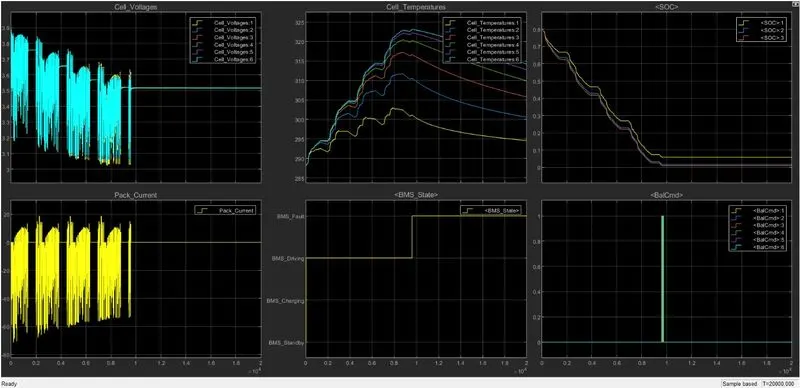
BMS Model by Mathworks
 1
1