Project 1 - Parsing NASA thermodynamic data
Aim :- Write a function that extracts 14 coefficients and calculates enthalpy,entropy and specific heat for all the species in the data file(NASA thermodynamic data file).
Objective :- To read the given thermodynamic data file and draw plot of low temp to high temp for the species.Calculate molecular weight of all the species.
Theory :-
File Parsing :- In simple words it means analyzing a data or how information can be read from a particular text file or any file and how that information can be used in a computer programme.
Enthalpy :- It is measurement of energy in a thermodynamic system. The quantity of enthalpy equals to the total content of heat of a system, equivalent to the system’s internal energy plus the product of volume and pressure.
Entropy :- Entropy is a concept in thermodynamics that measures the disorder or randomness of a system.
Specific Heat :- It defined as the amount of energy required to raise the temperature of 1 gram of a substance by 1°C under standard pressure.
Formulas to calculate Enthalpy,Entropy,specific heat.
Enthalpy :-
H/RT = a1 + a2 T /2 + a3 T^2 /3 + a4 T^3 / 4 + a5 T^4 / 5 + a6 / T
Entropy :-
S/R = a1 logT + a2 T + a3 T^2 / 2 + a4 T^3 / 3 + a5 T^4 / 4 + a7
Specific heat :-
Cp/R = a1 + a2 T + a3 T^2 + a4 T^3 + a5 T^4
Commands used in the code :-
fopen :- It use to open and read the file you want.In this case our file name is 'Thermo.dat'.
fgetl :- Using this we can read the given file line by line and also we can assign a variable to a particular line.
strcmp :- It used to compare all the lines to get the 'END' character in the data sheet.
frewind(file id) :- Use this command to reach the beginning of the file strcmp.
strsplit :- To split seperate quantity which can be store in variable and do process.
findstr :- Use to find the location of a particular character from a string.
str2num :- This command use to convert string into a number.
for loop :- To repeat specified number of time.
mkdir :- Using this command we can create a new folder where wee can able to save plots.
cd :- Use of this command to change directory and it changes current folder to a new folder.
saveas :- Using this we can save plot as 'jpg' format.
Matlab Code (that extracts 14 coefficients and calculates enthalpy,entropy and specific heat for all the species in the data file) :-
close all
clear all
clc
% To read NASA thermodynamic data file
%calculate enthalpy,entropy and specific heat of the given data

%to open and read file
THERMO_FILE = fopen('THERMO.dat','r');
 L = fgetl(THERMO_FILE);
 count = 1;

 % using while loop
 while strcmp(L,'END') == 0
     count = count+1;
     L = fgetl(THERMO_FILE);
 end

 % To calculate and save number of species
 num_species = (count-6)/4;
 frewind(THERMO_FILE)
 H1 = fgetl(THERMO_FILE);
 H2 = fgetl(THERMO_FILE);

 % Splitting the lines for the species
 Global_temp = strsplit(H2,' ');
 % Saving different temp values in different variables
 Global_min_temp = str2num(Global_temp{2});
 Global_mid_temp = str2num(Global_temp{3});
 Global_high_temp = str2num(Global_temp{4});

 % using for loop to skip comment lines
 for  L = 1:3
     H1 = fgetl(THERMO_FILE);
 end

 % Programme to extract coefficient of the species
 % To plot graph of the temperature,enthalpy,entropy and specific heat
 % To calculate molecular masses of species

 for s = 1:num_species
     L1 = fgetl(THERMO_FILE);
     L1_split = strsplit(L1,' ');

     % Saving the values of the local minimum,medium and high temperature
     % in particular variable
     species = (L1_split{1});
     local_min_temp = str2num(L1_split{end-3});
     local_mid_temp = str2num(L1_split{end-1});
     local_high_temp = str2num(L1_split{end-2});

     % Taking 1000 values between local min temp and local high temp
     T = linspace(local_min_temp,local_high_temp,1000);

     % Reading line by line for coefficient of species
     L2 = fgetl(THERMO_FILE);
     L3 = fgetl(THERMO_FILE);
     L4 = fgetl(THERMO_FILE);

     % Locating the exponential character and extracting all the 14
     % co-efficient

     % Locating the exponential character in first line
     location_E_L2 = findstr(L2,'E');
     c1 = str2num(L2(1:location_E_L2(1)+3));
     c2 = str2num(L2(location_E_L2(1)+4:location_E_L2(2)+3));
     c3 = str2num(L2(location_E_L2(2)+4:location_E_L2(3)+3));
     c4 = str2num(L2(location_E_L2(3)+4:location_E_L2(4)+3));
     c5 = str2num(L2(location_E_L2(4)+4:location_E_L2(5)+3));

     % Locating the exponential character in the second line
     location_E_L3 = findstr(L3,'E');
     c6 = str2num(L3(1:location_E_L3(1)+3));
     c7 = str2num(L3(location_E_L3(1)+4:location_E_L3(2)+3));
     c8 = str2num(L3(location_E_L3(2)+4:location_E_L3(3)+3));
     c9 = str2num(L3(location_E_L3(3)+4:location_E_L3(4)+3));
     c10 = str2num(L3(location_E_L3(4)+4:location_E_L3(5)+3));

     % Locating the exponential character in the third line
     location_E_L4 = findstr(L4,'E');
     c11 = str2num(L4(1:location_E_L4(1)+3));
     c12 = str2num(L4(location_E_L4(1)+4:location_E_L4(2)+3));
     c13 = str2num(L4(location_E_L4(2)+4:location_E_L4(3)+3));
     c14 = str2num(L4(location_E_L4(3)+4:location_E_L4(4)+3));


     % Universal gas constant (J/K.mol)
     R = 8.3145;

     % Calculating specific heat,enthalpy and entropy for different
     % temperature ranges
     for i = length(T)
         if T(i)local_mid_temp
             % Formula to calculate specific heat
             Cp(i) = R*(c1 + c2*T(i) + c3*T(i)^2 + c4*T(i)^3 + c5*T(i)^4);
             % Formula to calculate enthalpy
             H(i) = R*T(i)*(c1 + c2*T(i)/2 + c3*T(i)^2/3 + c4*T(i)^3/4 + c5*T(i)^4/5 + c6/T(i));
             % Formula to calculate entropy
             S(i) = R*(c1*log(T(i)) + c2*T(i) + c3*T(i)^2/2 + c4*T(i)^3/3 + c5*T(i)^4/4 + c7);

         else
             % Formula to calculate specific heat
             Cp(i) = R*(c8 + c9*T(i) + c10*T(i)^2 + c11*T(i)^3 + c12*T(i)^4);
             % Formula to calculate enthalpy
             H(i) = R*T(i)*(c8 + c9*T(i)/2 + c10*T(i)^2/3 + c11*T(i)^3/4 + c12*T(i)^4/5 + c13/T(i));
             % Formula to calculate entropy
             S(i) = R*(c8*log(T(i)) + c9*T(i) + c10*T(i)^2/2 + c11*T(i)^3/3 + c12*T(i)^4/4 + c14);
         end
     end

     % Plotting for temperature,specific heat,enthalpy and entropy
     % Plotting for temperature and specific heat
     figure(1)
     plot(T,Cp)
     xlabel('Temperature[K]')
     ylabel('Specific Heat[J/Kg.K]')
     title('Temperature vs Specific heat')

     % Plotting for temperature and enthalpy
     figure(2)
     plot(T,H)
     xlabel('Temperature[K]')
     ylabel('Enthalpy[KJ]')
     title('Temperature vs Enthalpy ')

     % Plotting for temperature and entropy
     figure(3)
     plot(T,S)
     xlabel('Temperature[K]')
     ylabel('Entropy[J/K]')
     title('Temperature vs Entropy ')

     % Saving the plots in the directory in different folder
     cd('D:\matlab\New folder')
     mkdir(species)
     cd(species)

     saveas(1,'specific heat','jpg');
     saveas(2,'enthalpy','jpg');
     saveas(3,'entropy','jpg');
     cd('C:\Users\91976')

     % Calculation for molecular mass of the species
     % Creating array to save species character into variable
     Atom = ['C','H','O','N','A'];

     % Creating array to save atomic weight into variable
     Atom_wt = [12.01,1.0079,16,14.0067,39.95];

     Mol_mass = 0;
     % Nested for loop for the multiple iteration
     for m = 1:length(species)
         for n = 1:length(Atom_wt)
             if strcmp(species(m),Atom(n))
                 Mol_mass = Mol_mass + Atom_wt(n)

              x = n
             end
         end

        % To convert species string value into number
        z = str2double(species(m));
        if z > 1
            % Calculate molecular weight
            Mol_mass = Mol_mass + (Atom_wt(x)*(z-1))
        end
     end

     % Print the floating values of molecular mass
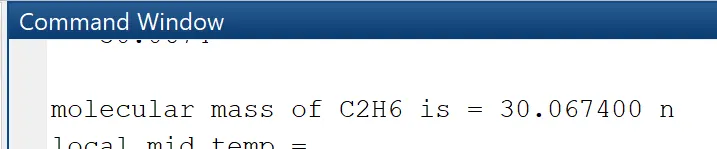
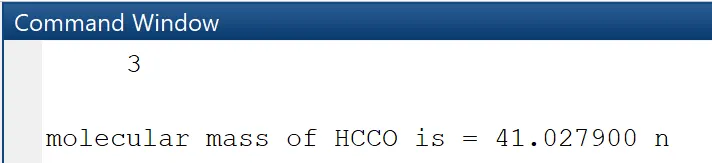
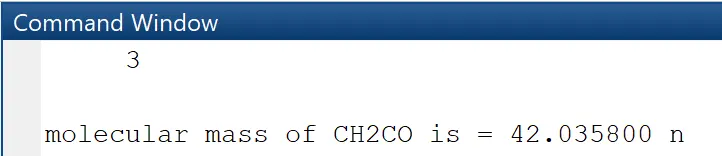
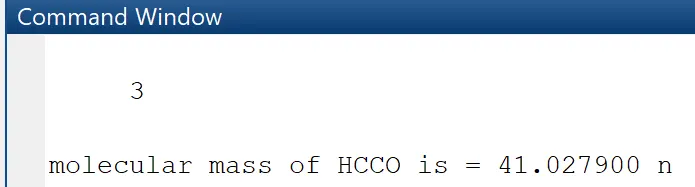
     fprintf('molecular mass of %s is = %f n',species,Mol_mass)
 end
Output:-
All Species Folder :-

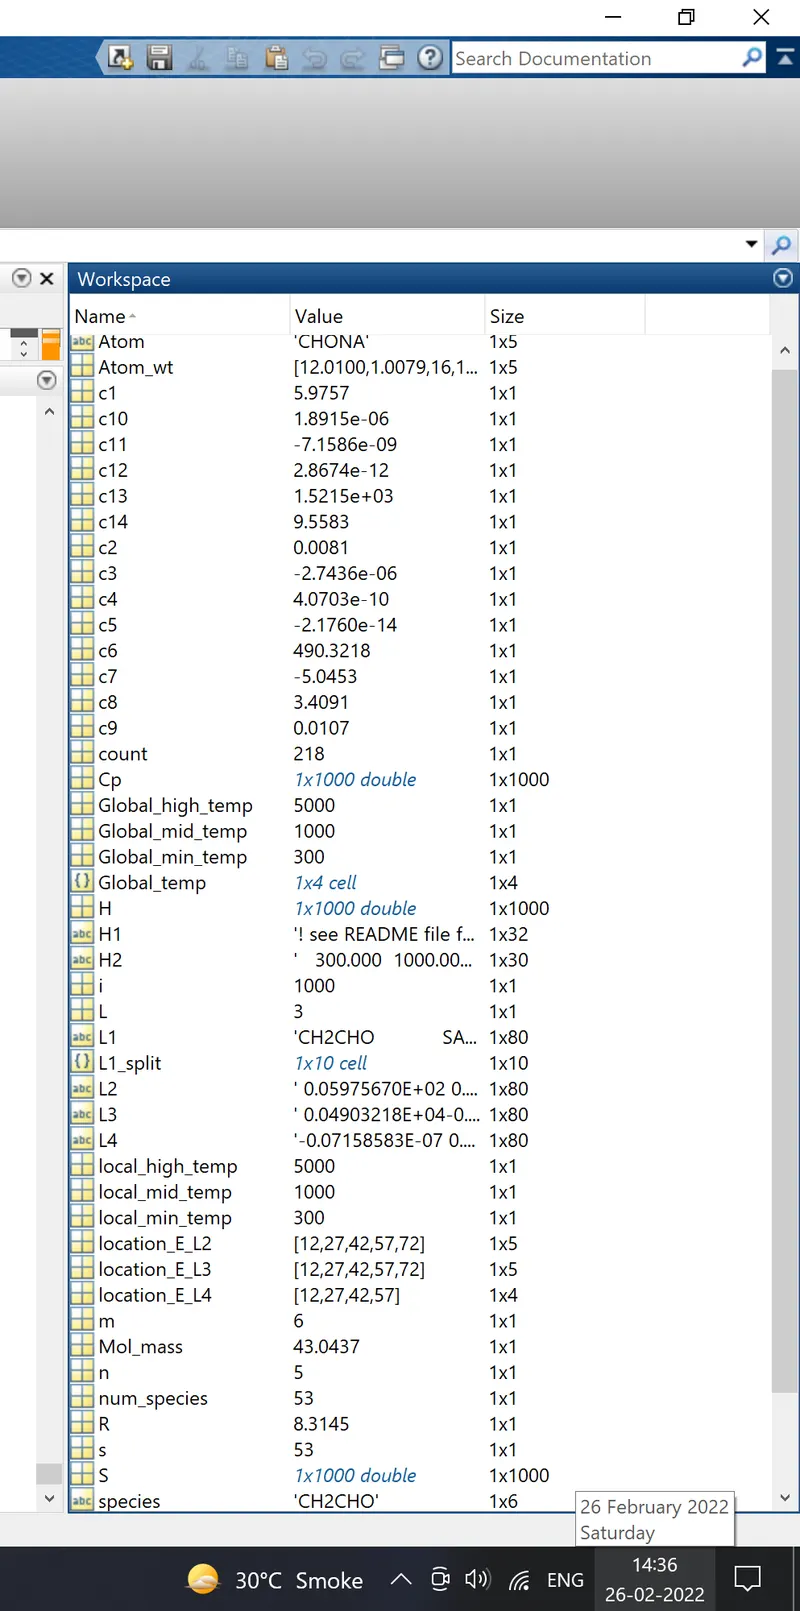
Workspace Of The Above Code:-
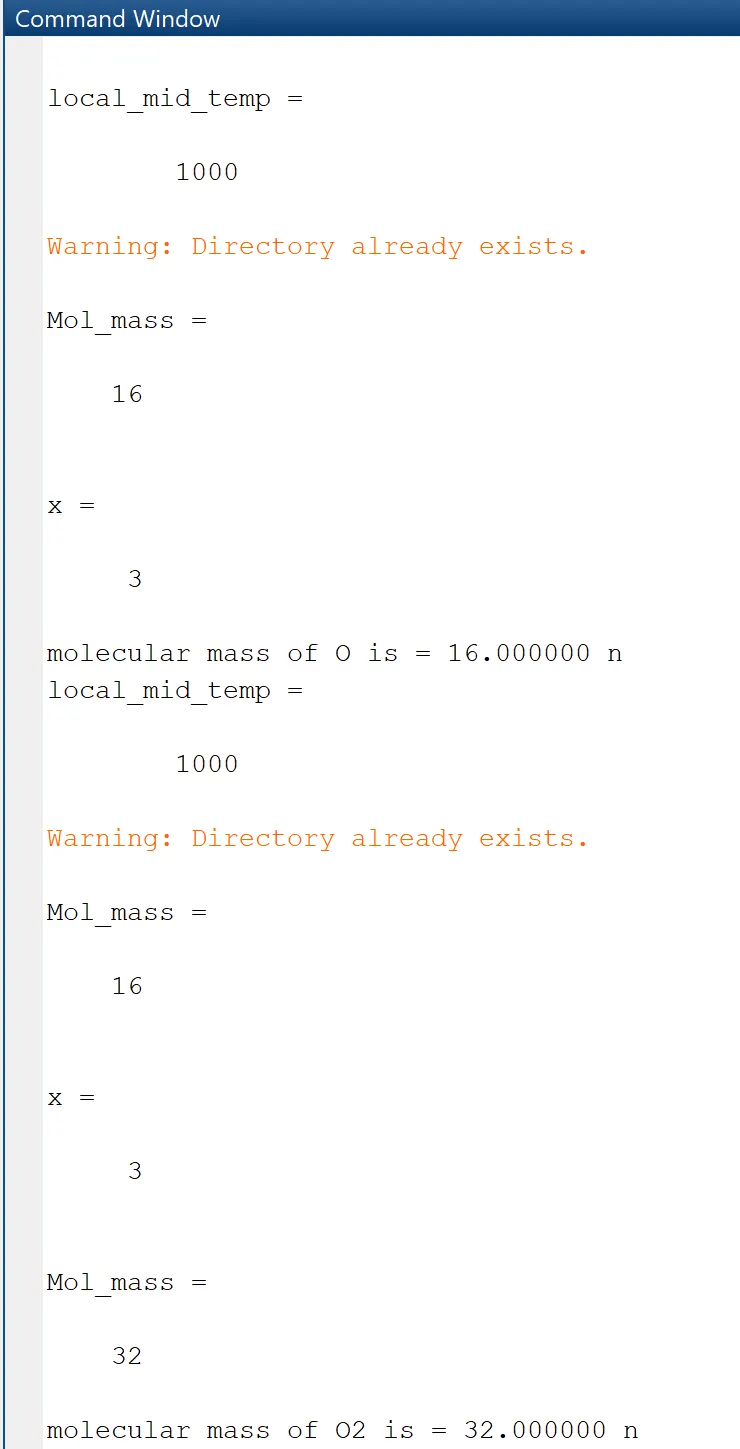
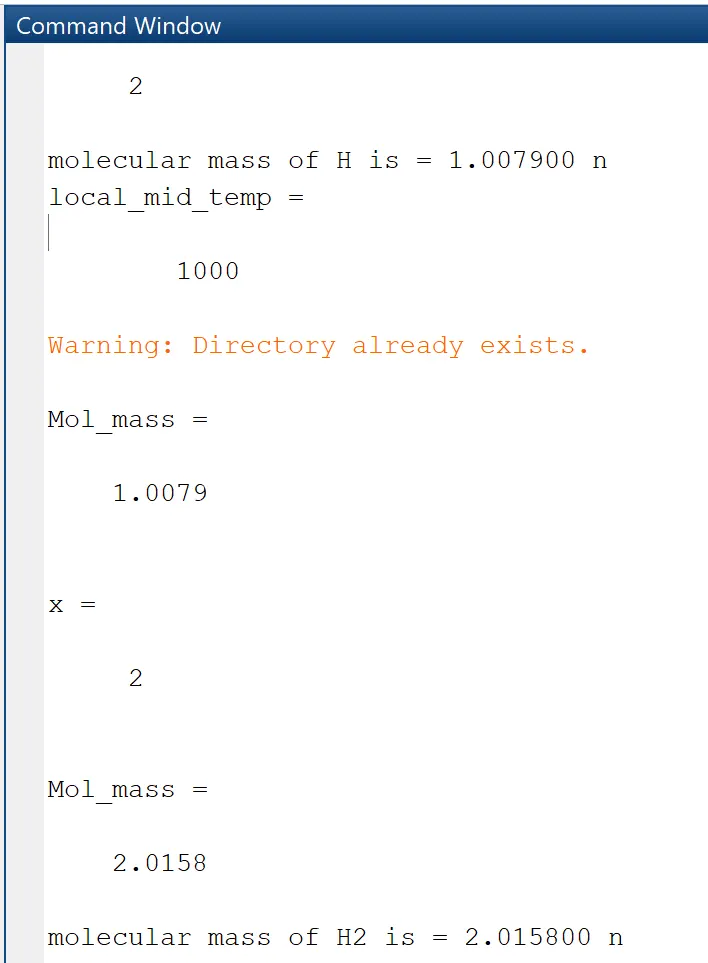
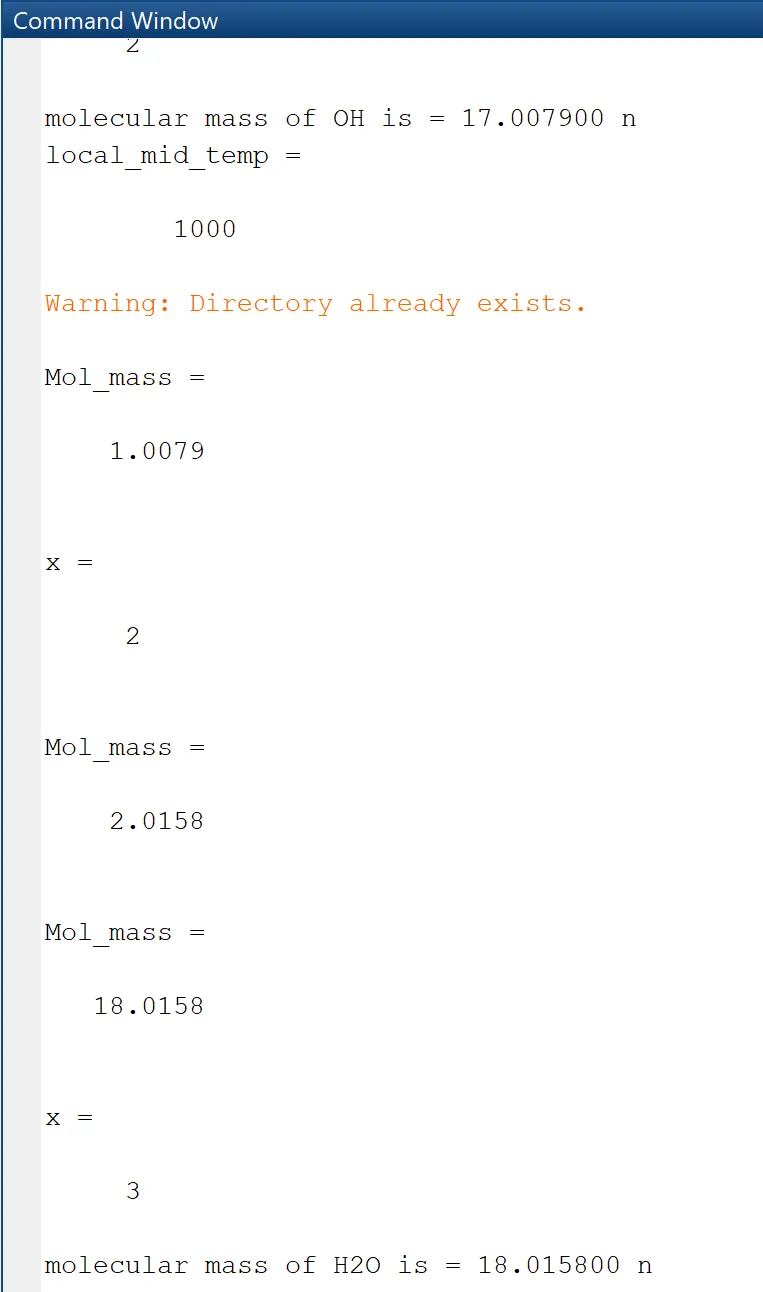
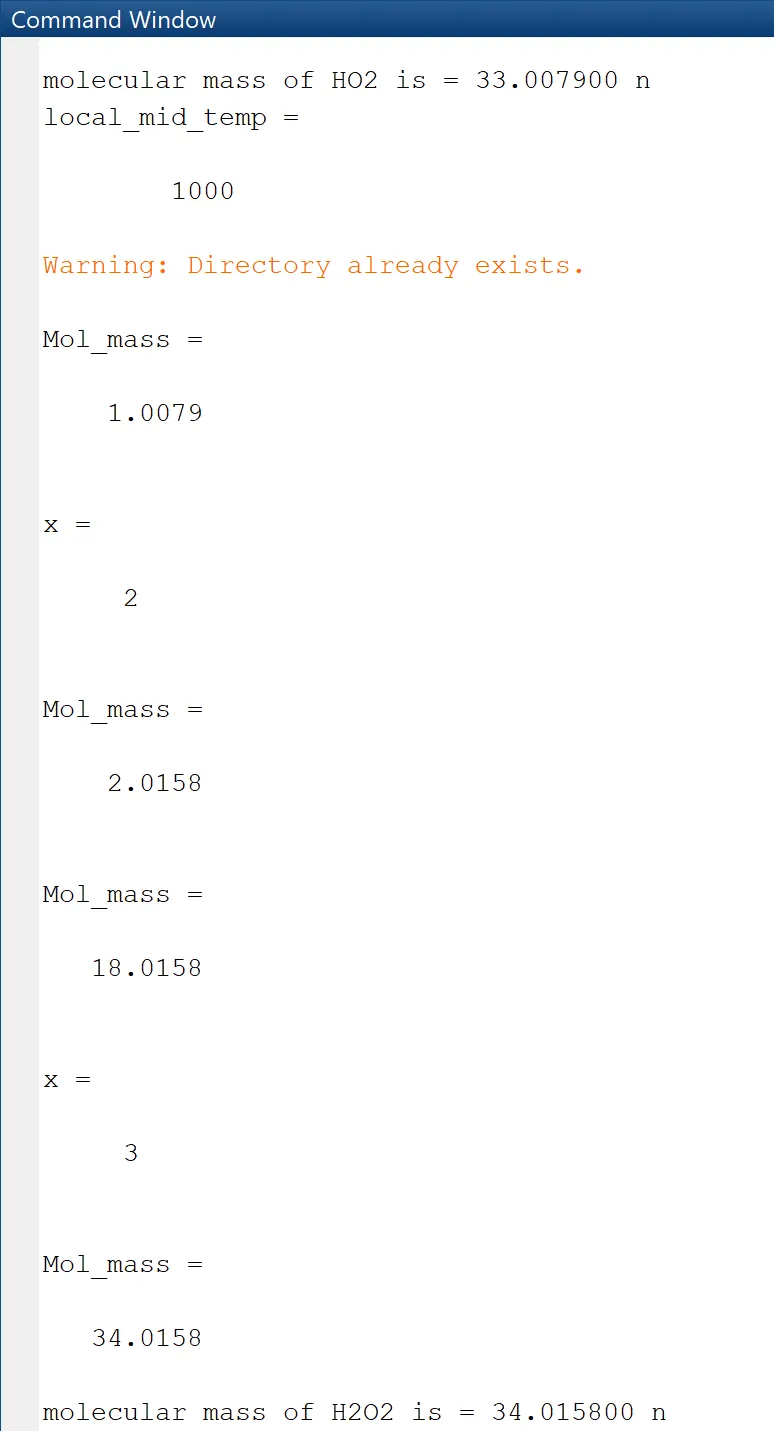
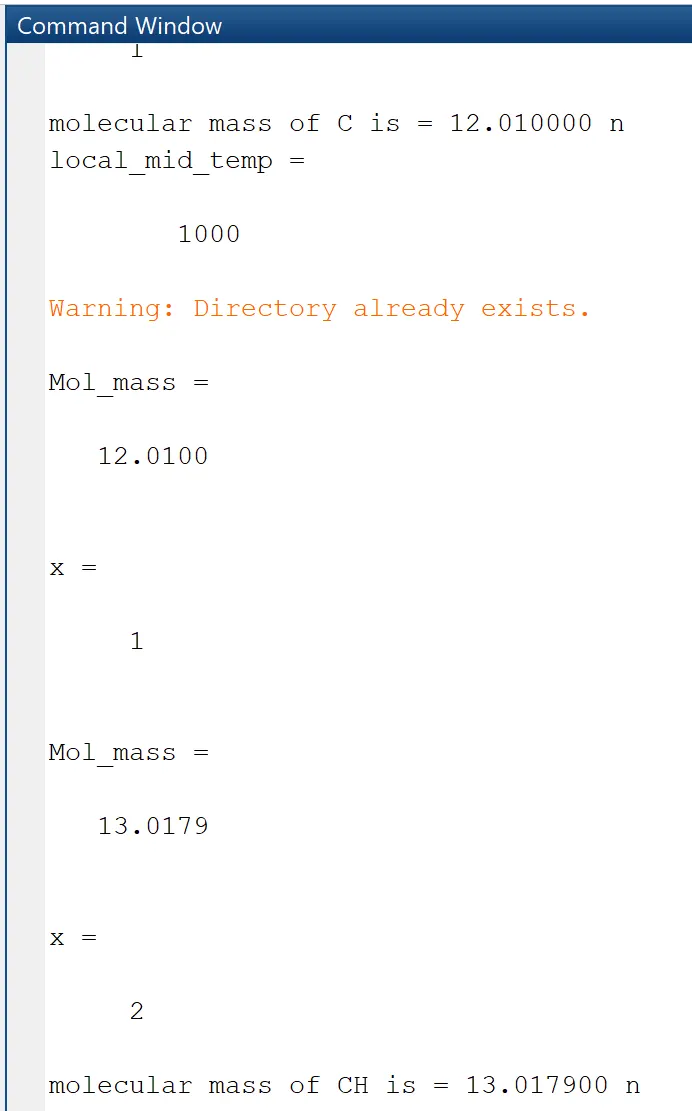
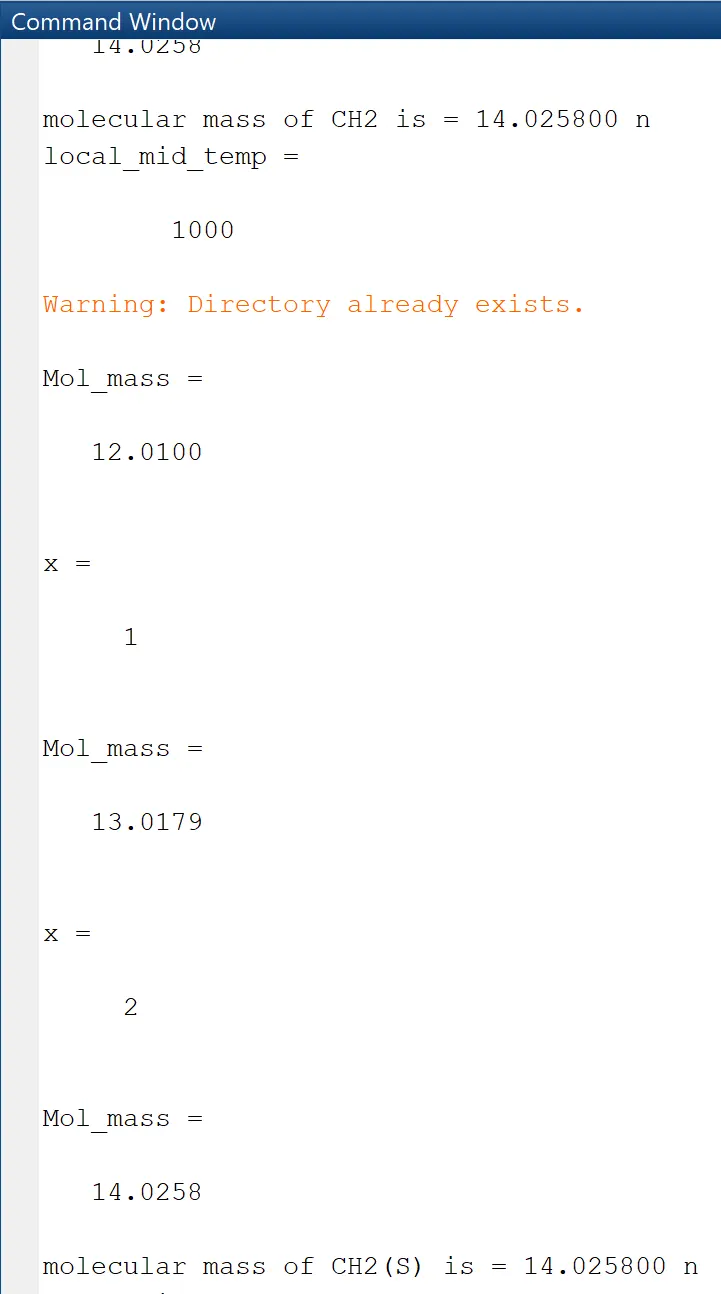
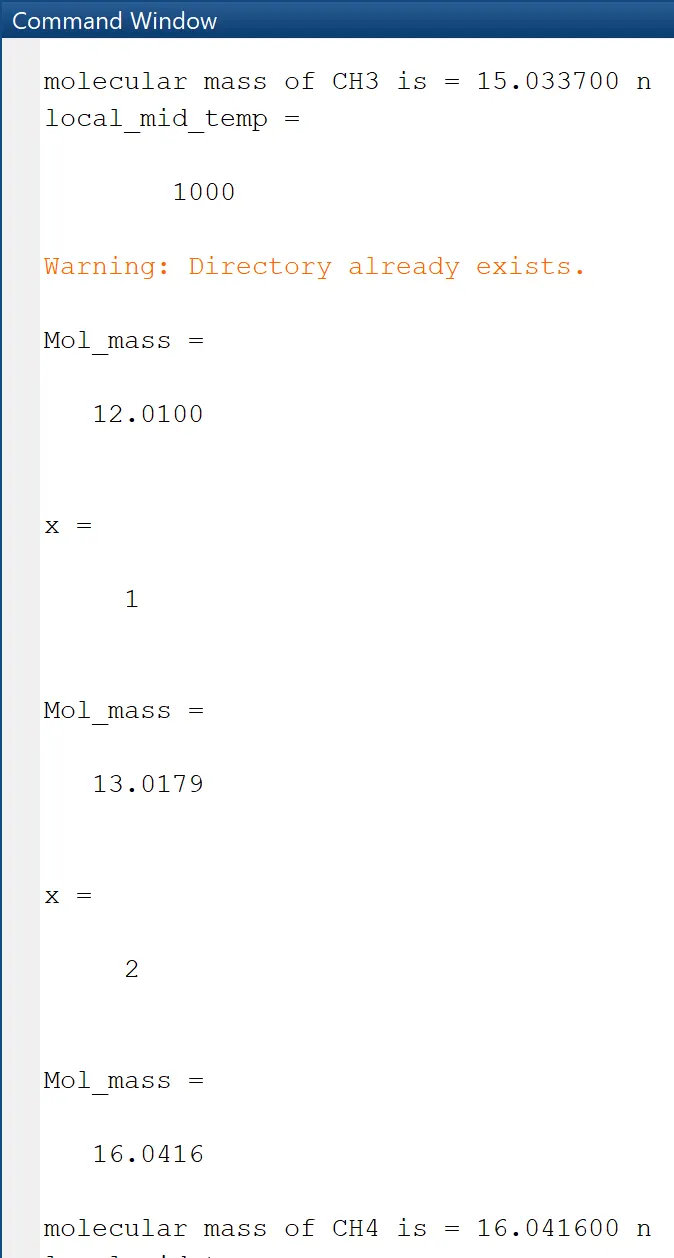
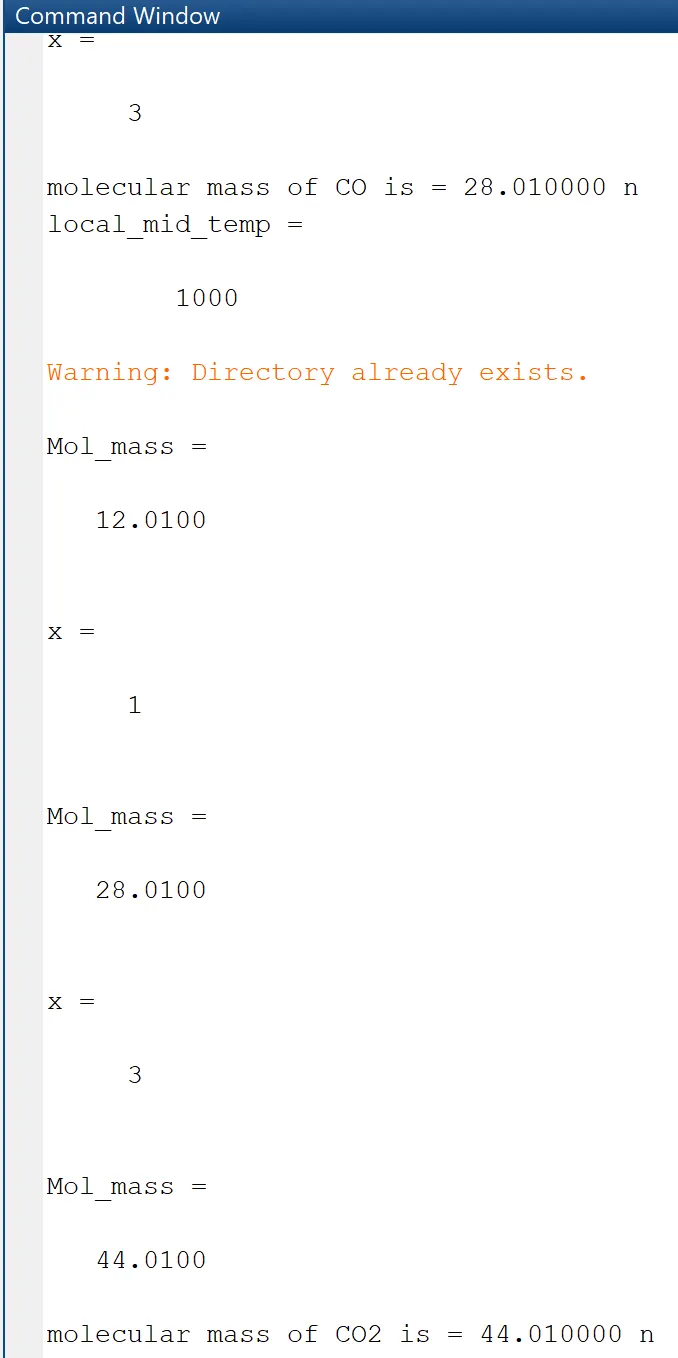
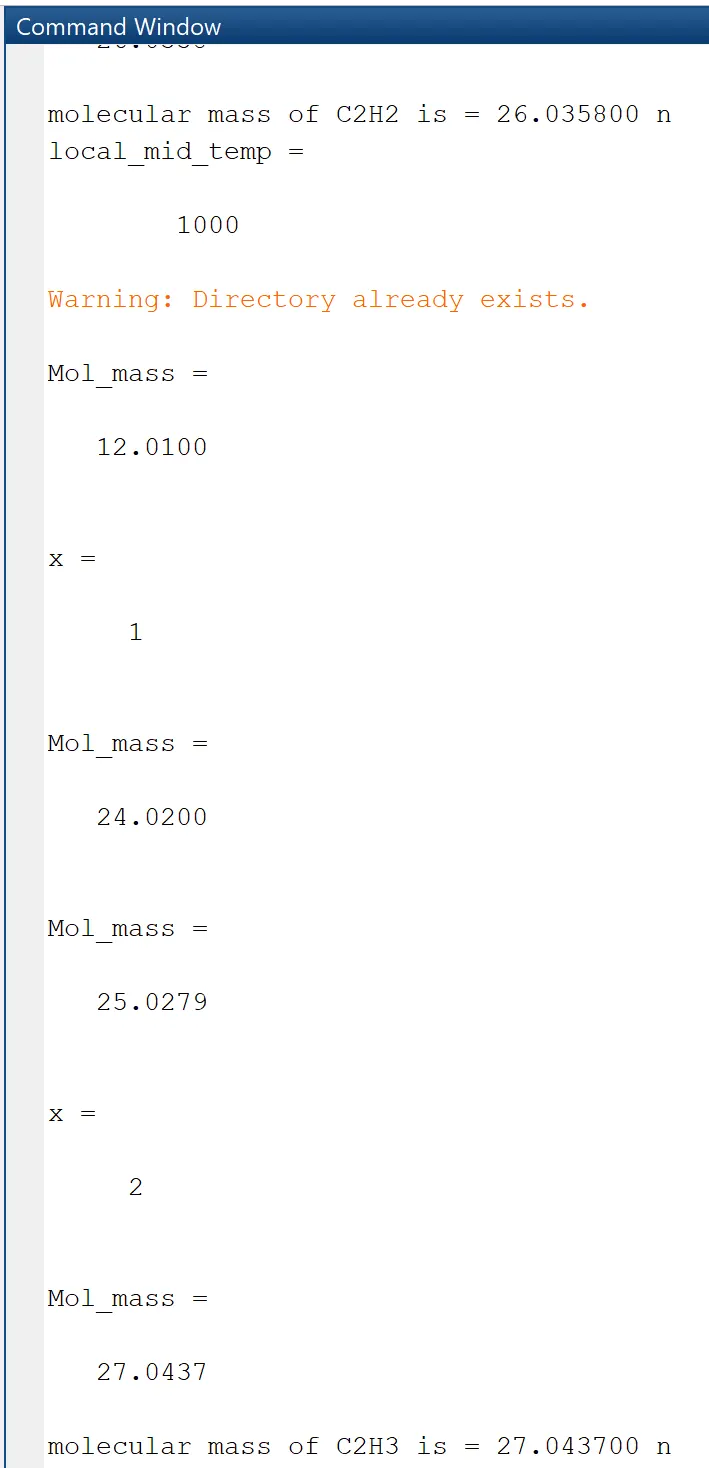
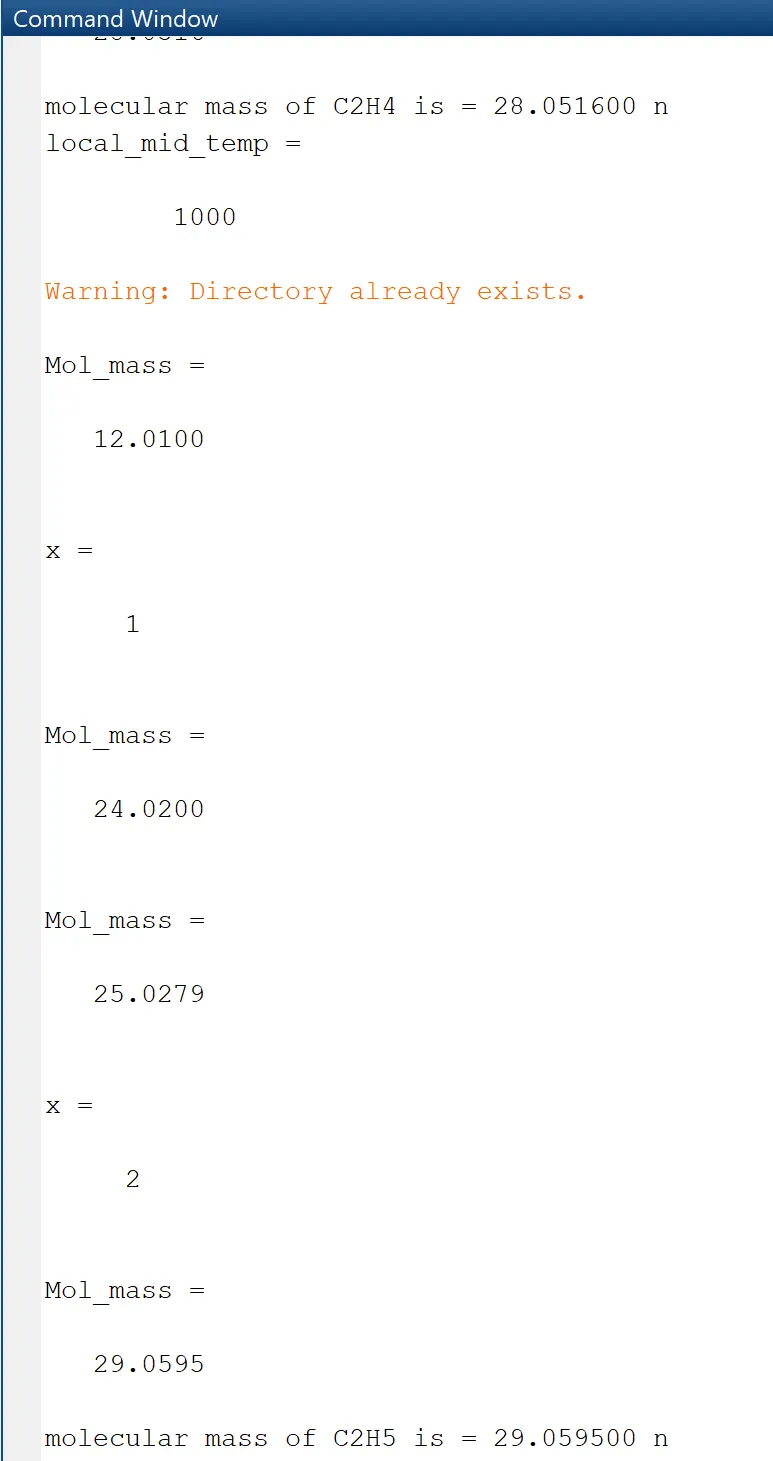
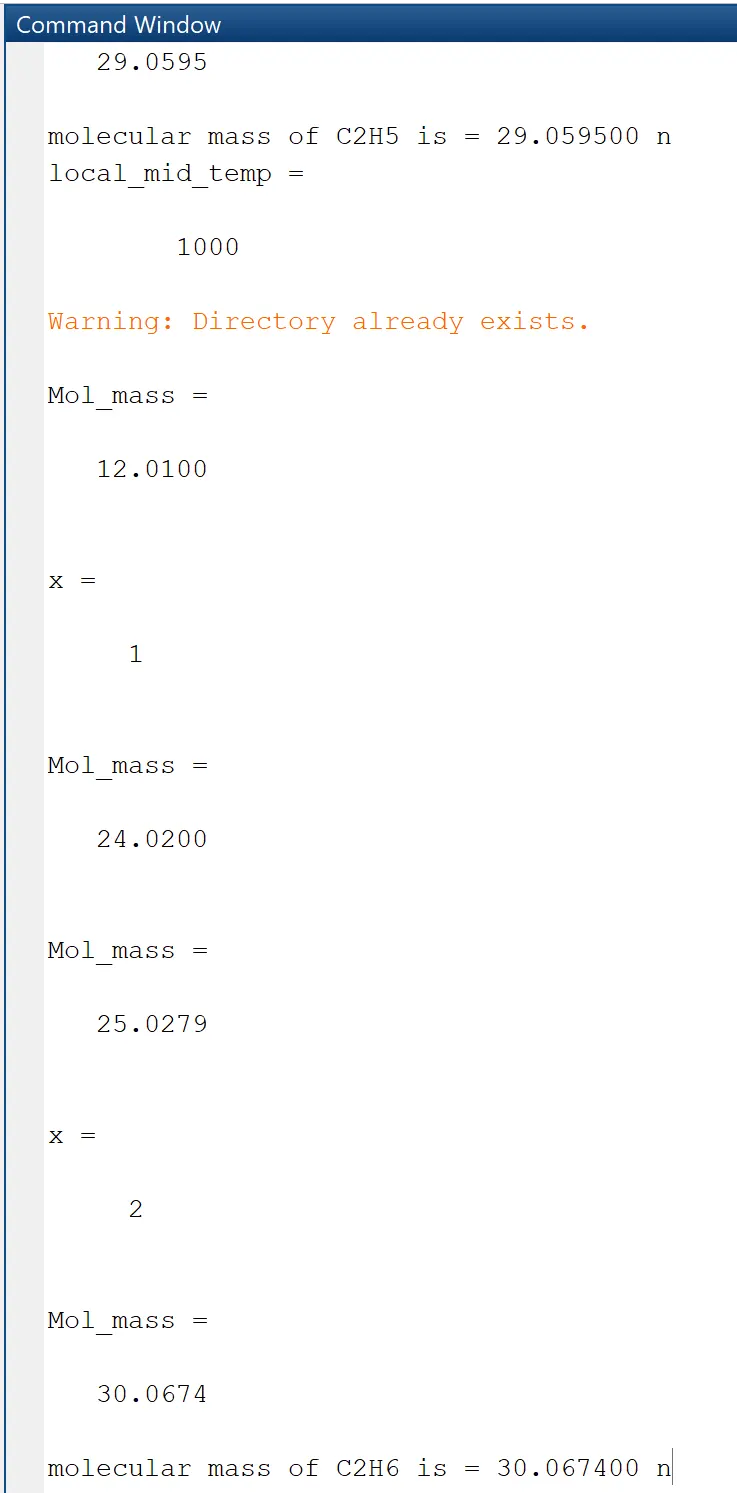
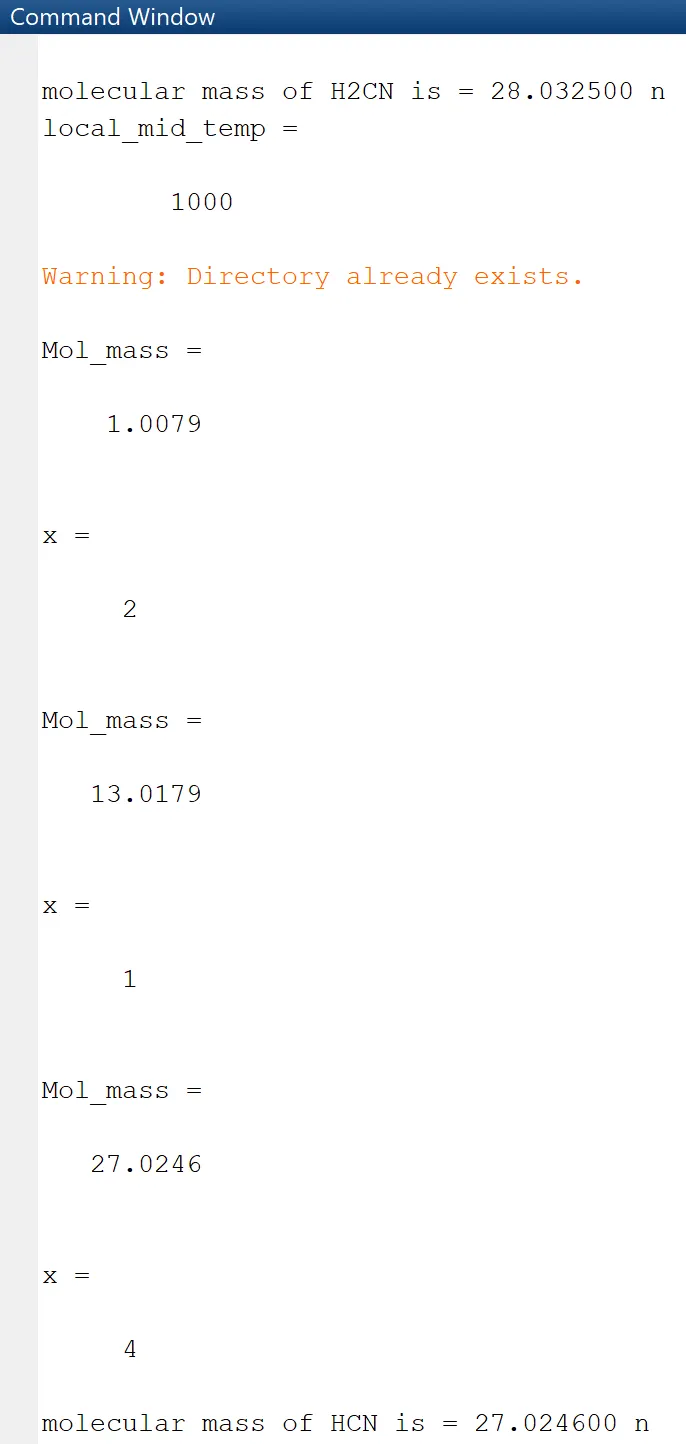
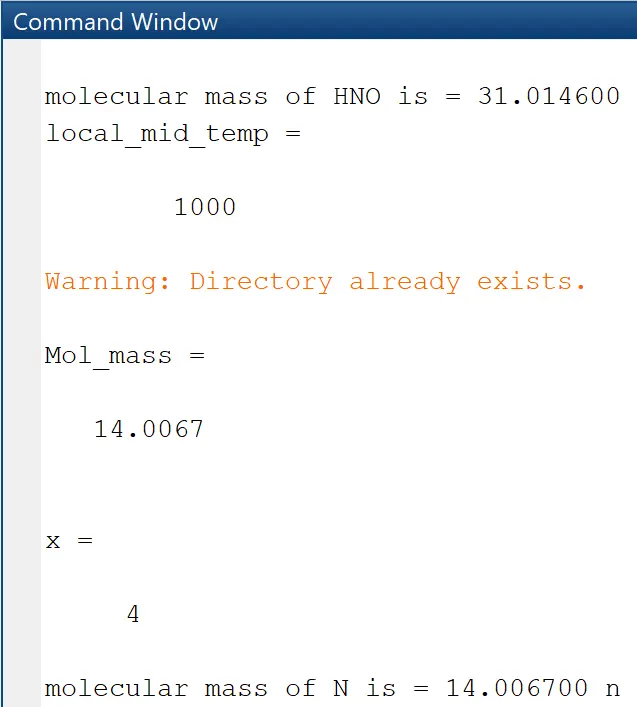
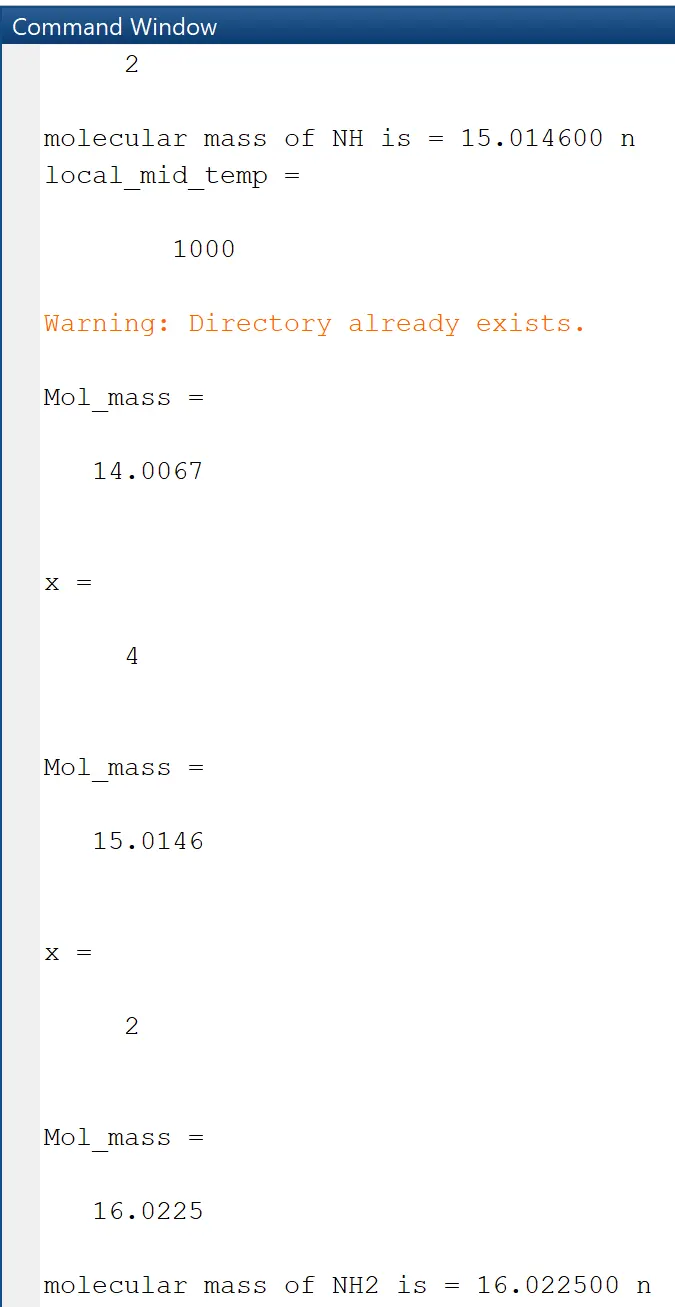
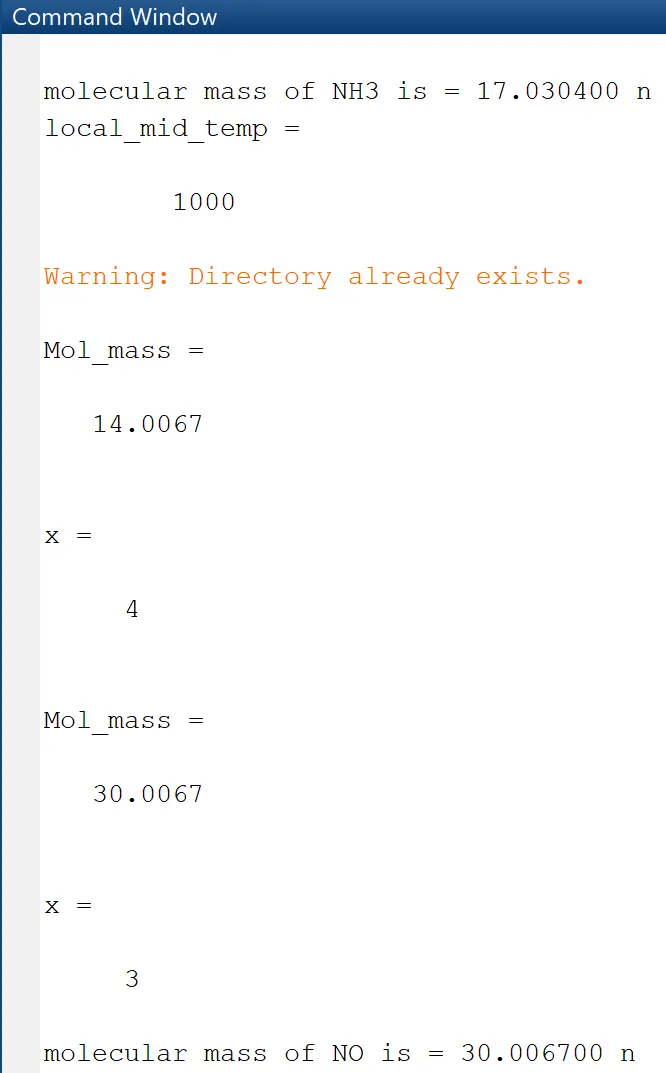
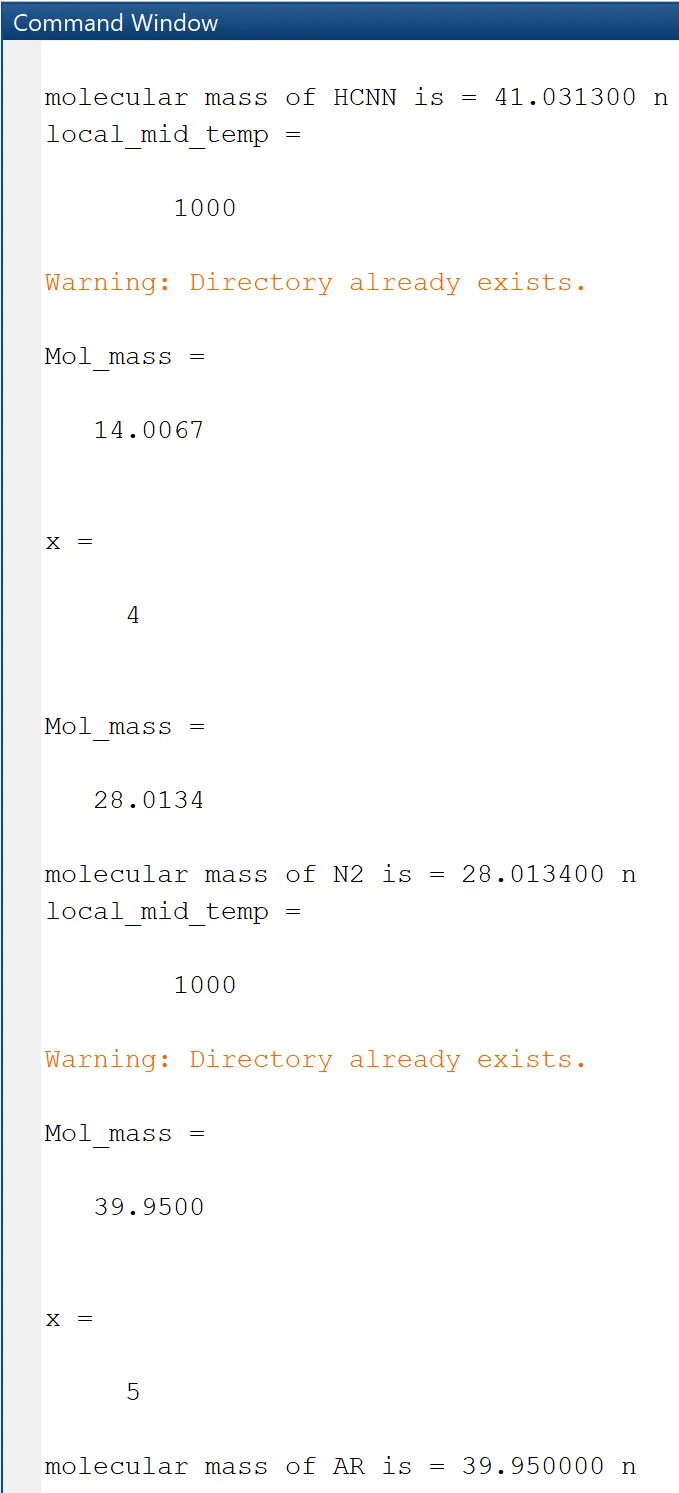
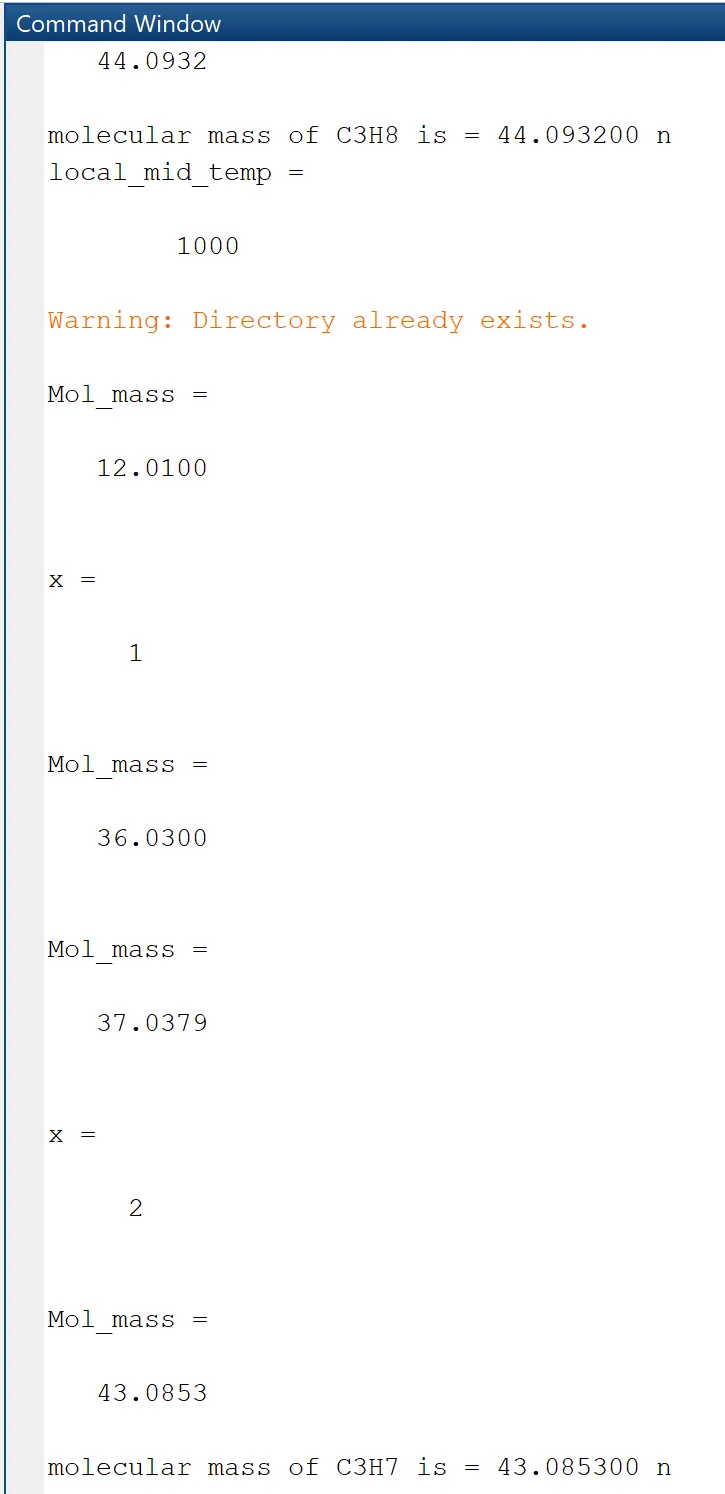
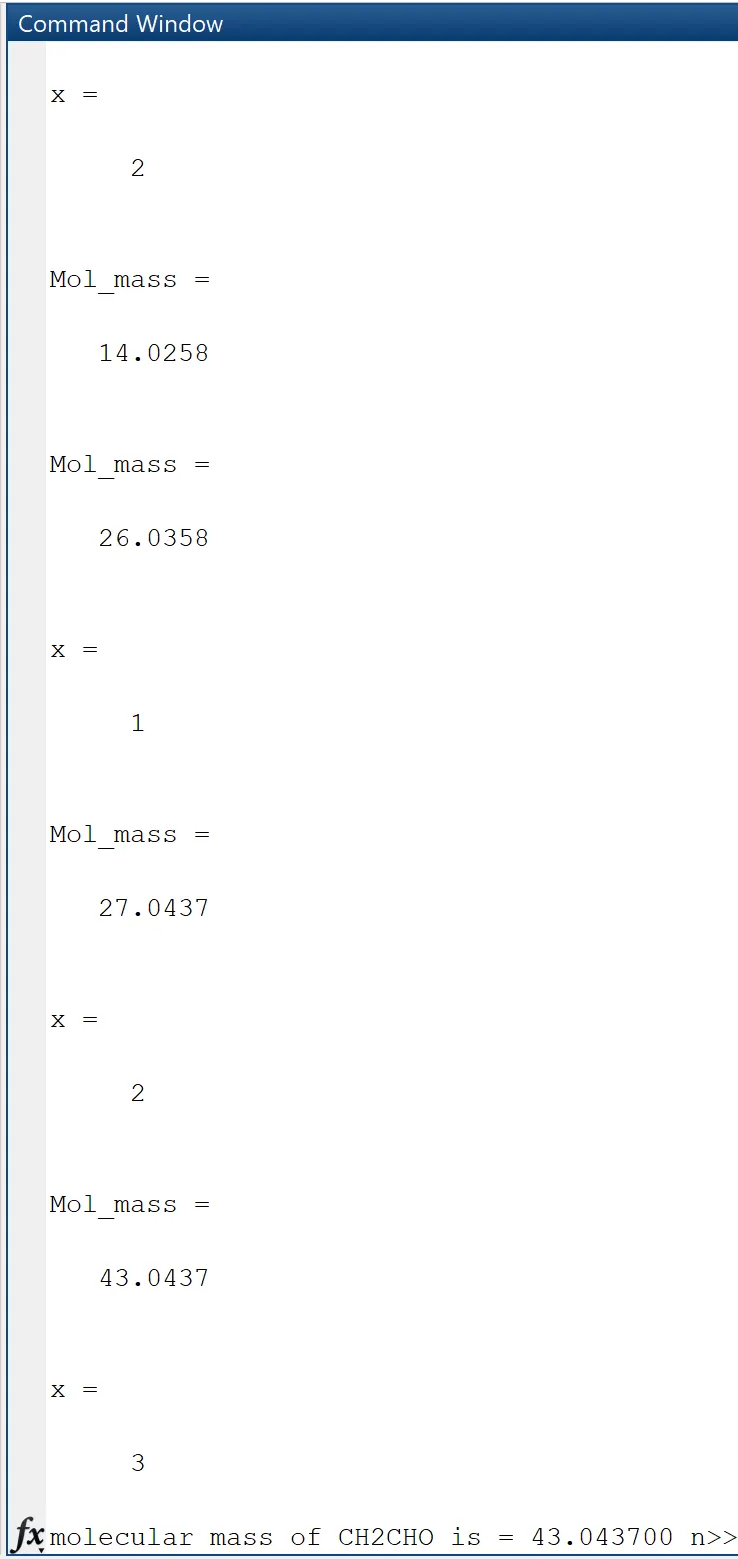
Molecular Weight Of Each Species And Displayed It In The Command Window :-



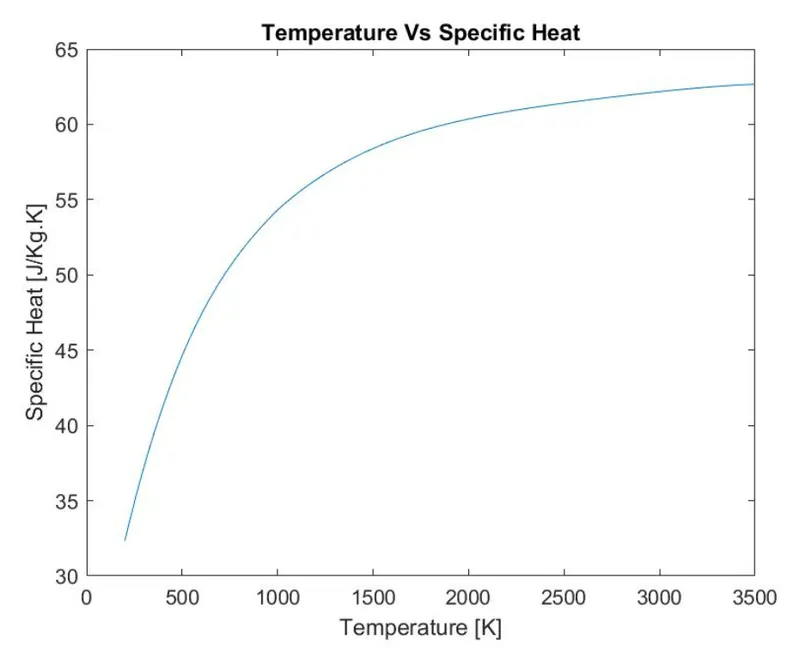
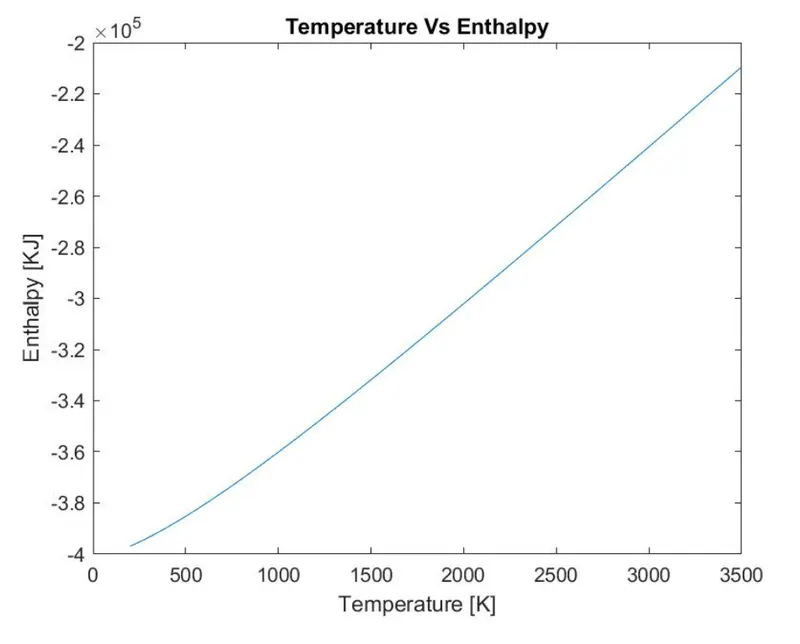
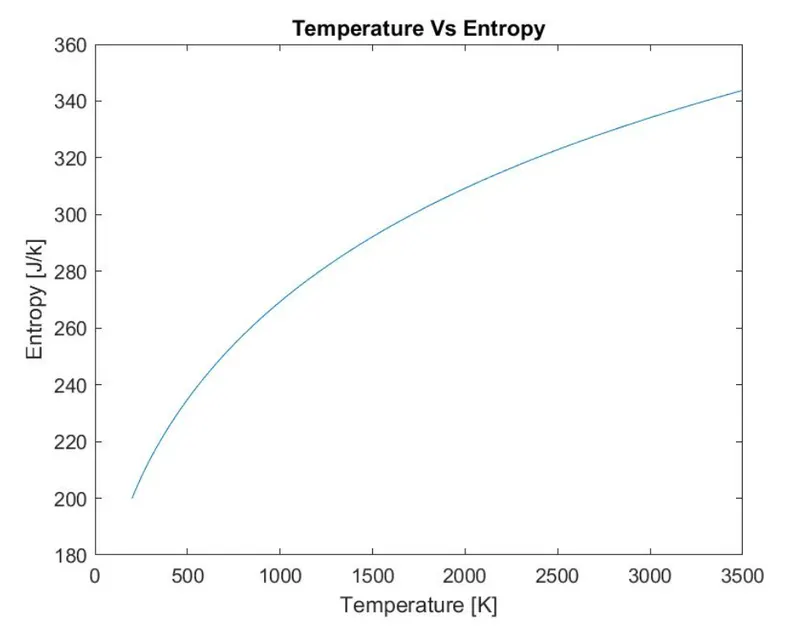
Plot for o2,N2 And Co2 :-
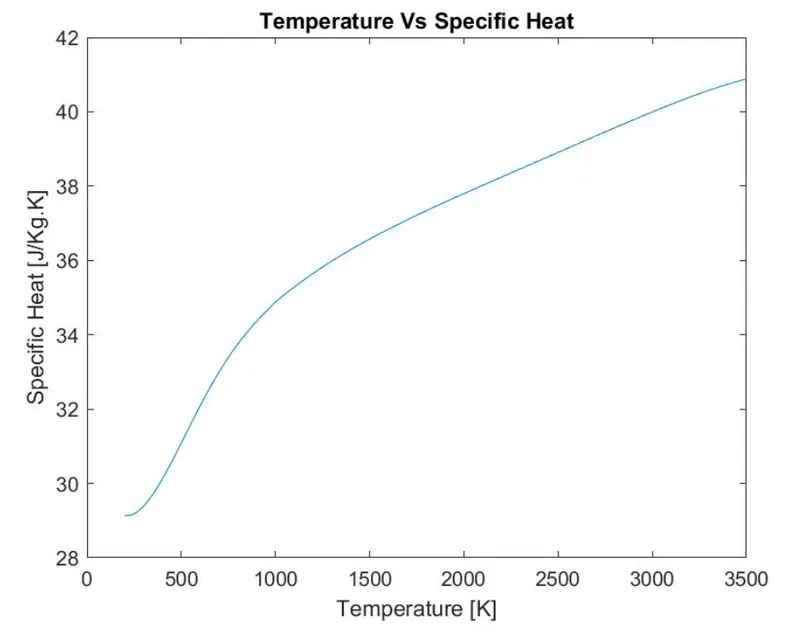
Plotting for o2 :-
Plot for temperature vs specific heat :-
Plot for temperature vs enthalpy :-
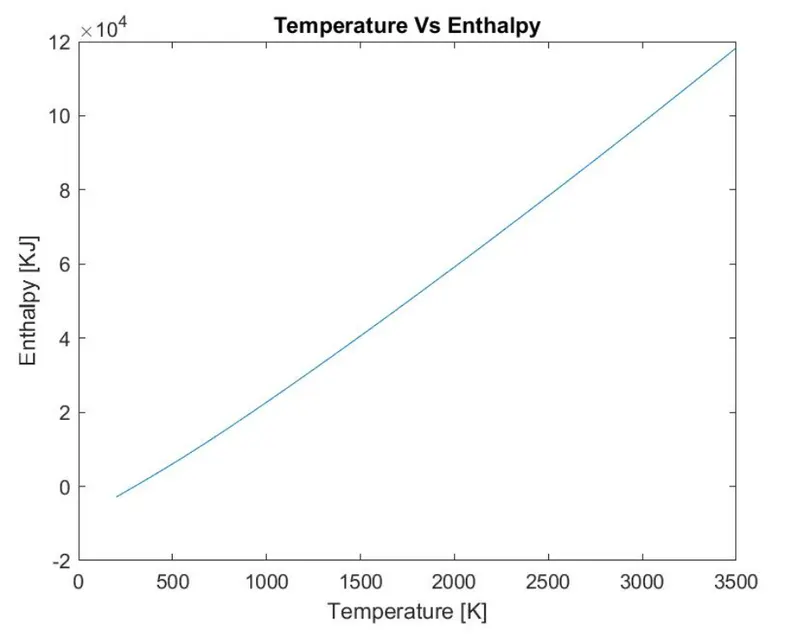
Plot for temperature vs entropy :-
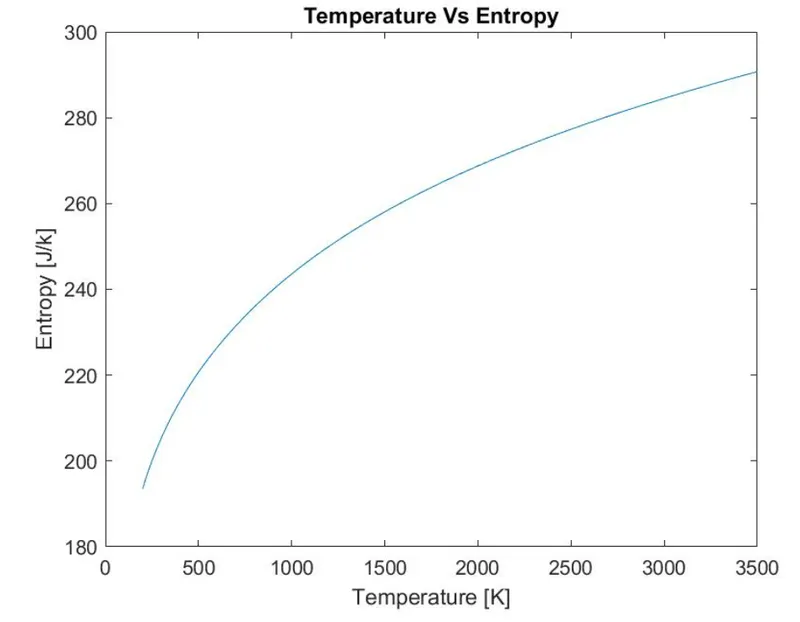
Plotting for N2 :-
Plot for temperature vs specific heat :-
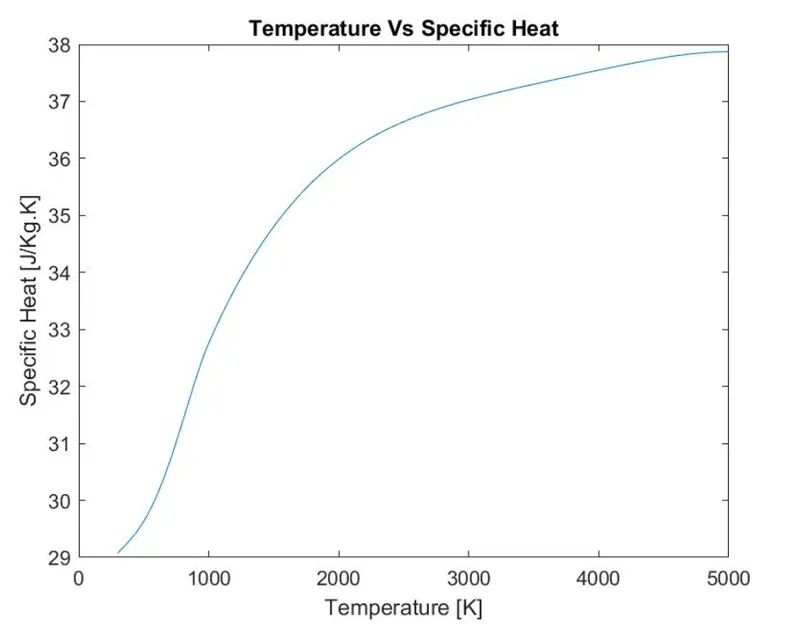
Plot for temperature vs enthalpy :-
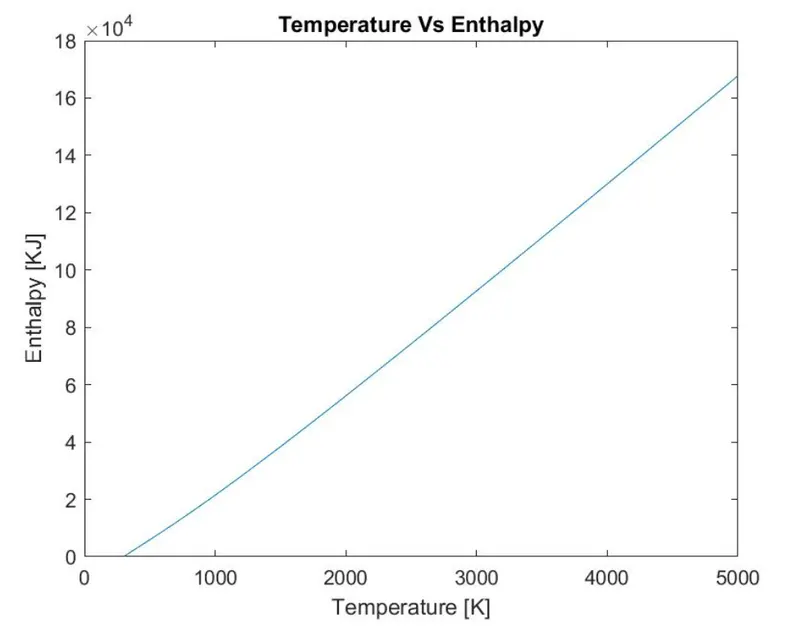
Plot for temperature vs entropy :-
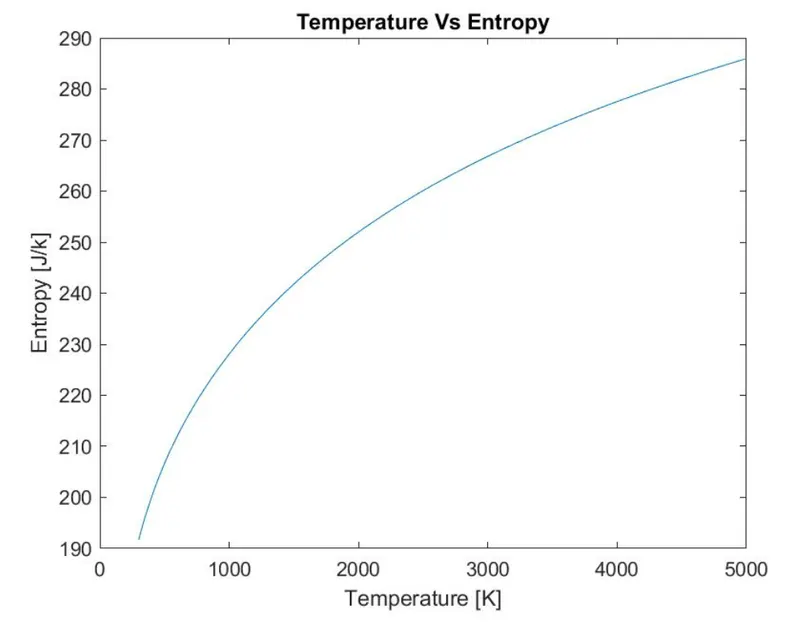
Plotting for Co2 :-
Plot for temperature vs specific heat :-
Plot for temperature vs enthalpy :-
Plot for temperature vs entropy :-
Conclusion :- Here,i learn how to read given data file using different commands in matlab.And also how to create folders using matlab.
References :-
- MATLAB & Simulink (mathworks.com)
MATLAB File Parsing Program For NASA thermodynamic data : Skill-Lync