Week 7 State of charge estimation
1.
here they asked me to simulate the three test cases of the harness dashboard and to run the simulation and to observe the output of those test sequence
so, here to get the closed loop harness we should have Battery management system file we can get that file from the MATLAB help section or we can also get that file from the link provided with the challenges
after downloading the file we should extract those file according to the MATLAB version ehich we are using in our system
and now lets get into the MATLAB and open that file location in the matlab window and then select the Battery_System.prf folder and then all the files are opened according to the BMS system
after that open the BMS_closedloop_Harness_dashboard simulink model which is there in the tests folder
below i am attaching the image of the model of closedloop harness of the BMS system in the simulink
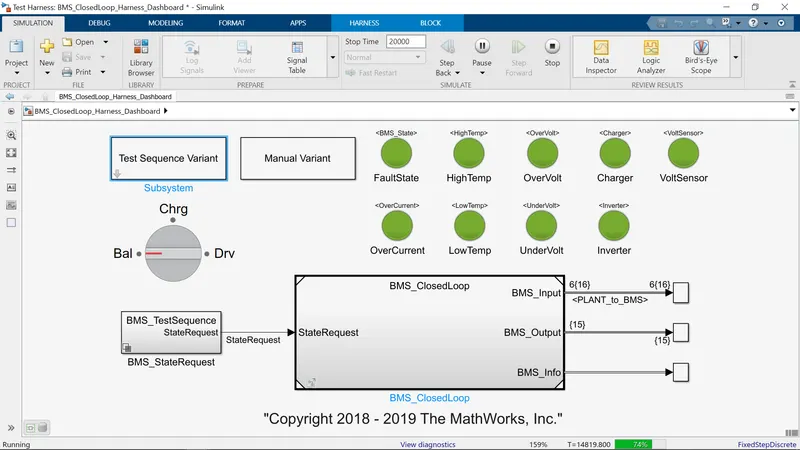
after opening this model those lamps will be at off condition, but here it is showing those lamp blocks in green because it is a running model and we should select the test case parameters in the test sequence varient block and according to our case sequence we can change the parameters
below i am attaching the image of the selection of the test sequence case in this model as this is our first case
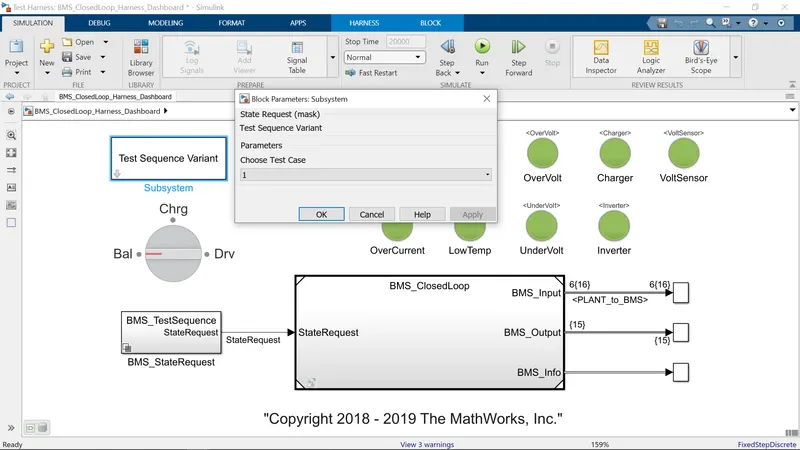
so if we observe we had taken the test sequence as 1 in our case one and after once we click the run button in the window the model starts compiling and then it starts running. but the compiling takes a lot of time and the running of the model will also take a long time as we taken our run time is for 20000sec and in meanwhile the simulation is running the graph plots will aslo starts with the model running
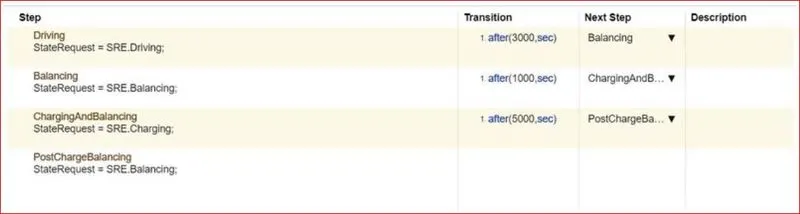
as we see the above image after hitting a run buttion the model will be in driving condition and after for 3000sec it will be in balancing condition and then after for 1000sec the model will be in charging and balancing condition and and then after for 5000sec the model will be in post charging balancing condition.
below i am attaching the image of the obtained graph plots of the model after the simulation of the model is finished
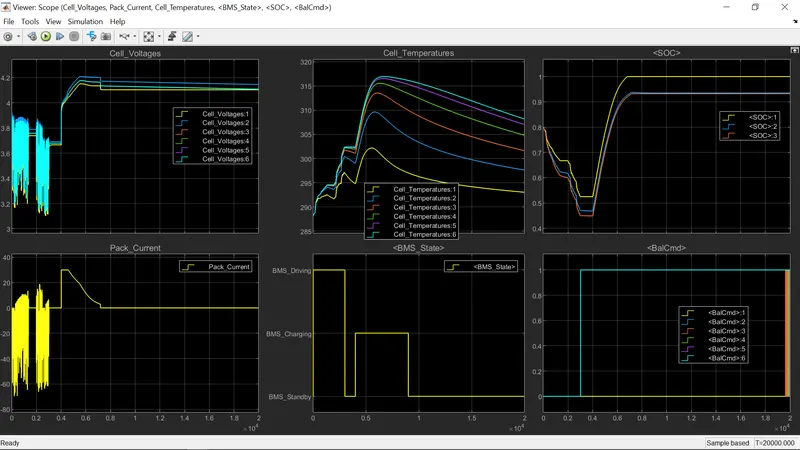
here if we observethe obtained plots the voltage value is 4 to 4.2v of the cell voltage and coming to the current graph from the starting 0 condition to it went to negative value and then raised to positive value 20 and after certain time it maintained constant at 0A. and now coming to the cell temparature at starting the temparature of the each cell is increasing in driving and charging and then after gradually the cell temparaure gets cool in the standby mode and this charging, driving and the standby modes can be observed with respective of time in the BMS stateand the SOC is started to fall at the starting condition from 80% to 30% approx in driving condition and then after again increased in charging state.
now lets get into the case - 2 that is test sequence 2 for this again we should go back and select the test sequence case as 2 in the test sequent varient block parameters
below i am attaching the image of the test sequence selection for case-2 study of this model
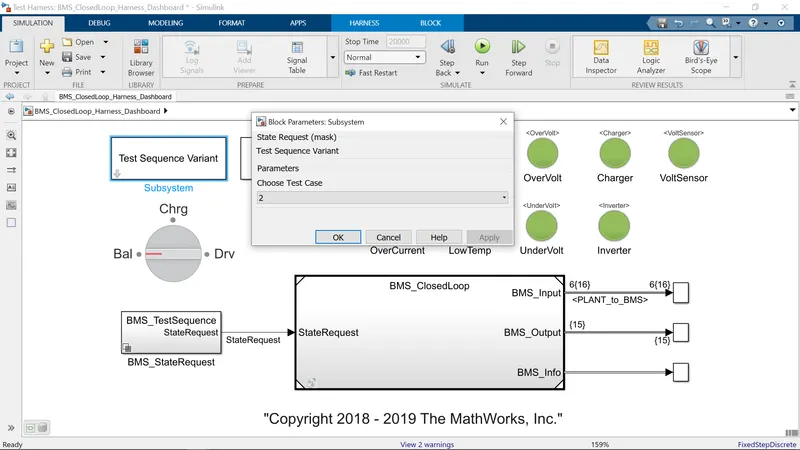
so as we selected the test sequence as 2 the model will start compiling after clicking the run bitton in this the compiling take the same time period as the case 1 took and the run ntime is also taken as 20000sec but once if we click the run button the simulation will stop in between the 9000 to 10000sec because the SOC will become to 0 at this time period.
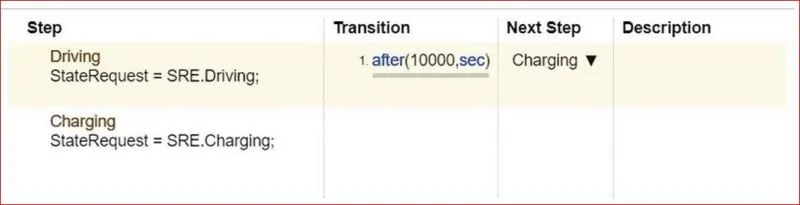
here initially the model will be in driving condition and then after 1000sec the model will be in the charging condition
below i am attaching the image of the obtained output results of this case 2 test sequence of the model
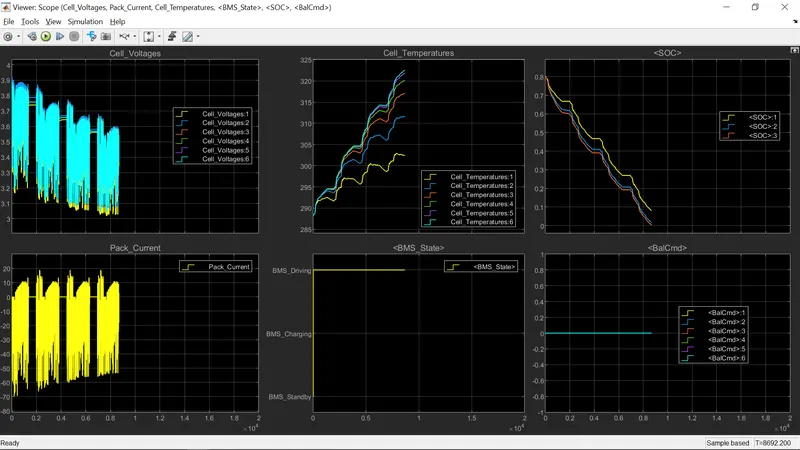
so as we observe the battery completey discharge in between 9000sec to 10000sec we can observe this clearly in the SOC plot hence the charging is zero the vehicle stops and the it will come in to rest position as the simulation stops in the middle
now lets get into the case - 3 that is test sequence 3 for this again we should go back and select the test sequence case as 3 in the test sequent varient block parameters
below i am attaching the image of the test sequence selection for case-3 study of this model
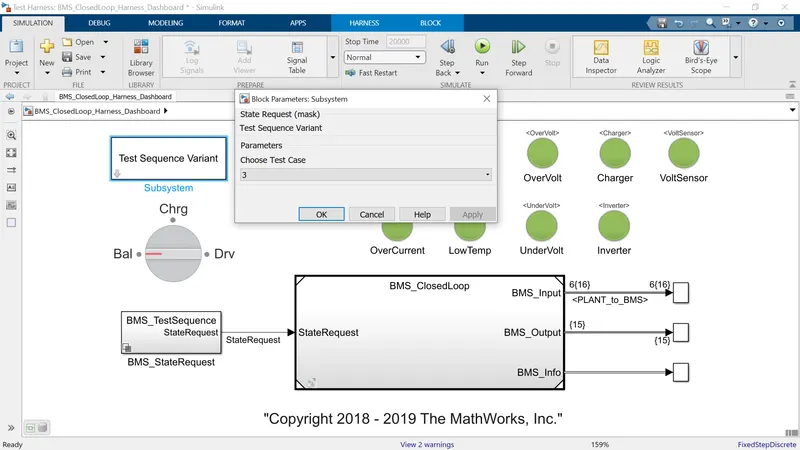
so if we observe we had taken the test sequence as 3 in our case one and after once we click the run button in the window the model starts compiling and then it starts running. but the compiling takes a lot of time and the running of the model will also take a long time as we taken our run time is for 20000sec and in meanwhile the simulation is running the graph plots will aslo starts with the model running in this case-3

if we observe this the model will be in charging condition for the time period of 20000sec
below i am attaching the image of the obtained graph plots of the model after the simulation of the model is finished in this case-3
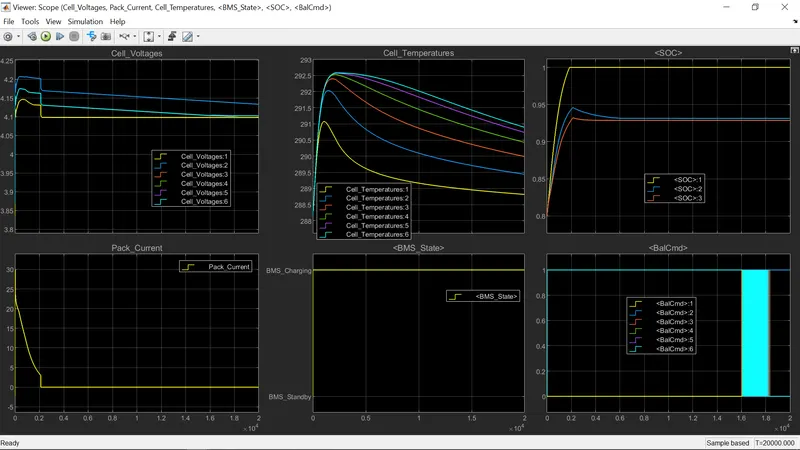
as we observe the cell voltage is increased to 4.2v and again settled at 4.1v throughout the operation and if we observe the cell temparature initially the value of temparature is high because the cells get started charging an while the charging is going on the temparature of the cells is also decreasing and coming to SOC plot it started increasing and once it reached to 100% or its maximum condition it maintained constant for 20000sec
so the BMS_Closedloop_Harness_dasboard model is studied and simulated and the results for the all three test sequences (3 test cases) are explained
2.
coulomb counting :
Coulomb counting is a technique used to track the State of Charge of a battery pack. It works by integrating the active flowing current (measured in amps) over time to derive the total sum of energy entering or leaving the battery pack. This produces a capacity that is typically measured in Amp-hours.
The state of charge (SoC) can be described as the level of charge of a battery relative to its capacity. The units of SoC are percentage points and it is calculated as the ratio between the remaining energy in the battery at a given time and the maximum possible energy with the same state of health conditions.
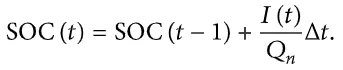
But there are several factors that affect the accuracy of Coulomb counting method including temperature, battery history, discharge current, and cycle life
Modified coulomb counting method :
To improve the Coulomb counting method, a new technique called modified Coulomb counting method is proposed. The modified Coulomb counting method uses the corrected current to improve the accuracy of estimation.
The corrected current is the function of discharging current. There is a quadratic relationship between the corrected current and discharging current of battery. By practice of experimental data, corrected current is calculated by the following form:

where k2, k1 and k0 are constant values obtained from the practice experimental data.
In modified Coulomb counting method, SOC is calculated by the following equation:
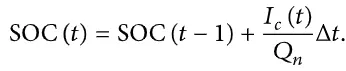
The experimental results show that the accuracy of the modified Coulomb counting method is superior to the conventional Coulomb counting method.
to observe this also in MATLAB we should have the BMS file which we had downloaded and unzipped previously for harness model
from that only we can open BMS_closedloop model in the SIMULINK model
below i am attaching the image of this BMS closedloop model
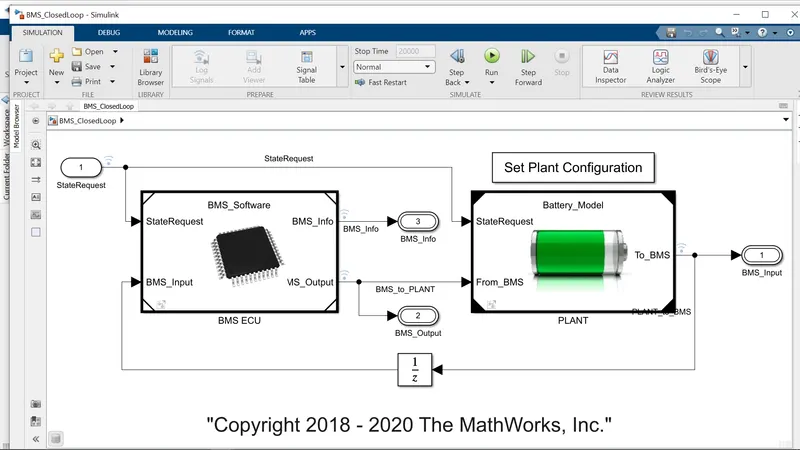
and if we observe this model there we can see the BMS ECU block actually its a sub-system and to explore this coulomb counting we should get into this sub-system
below i am attaching the image of the arrangement in the BMS ECU sub-system of this model
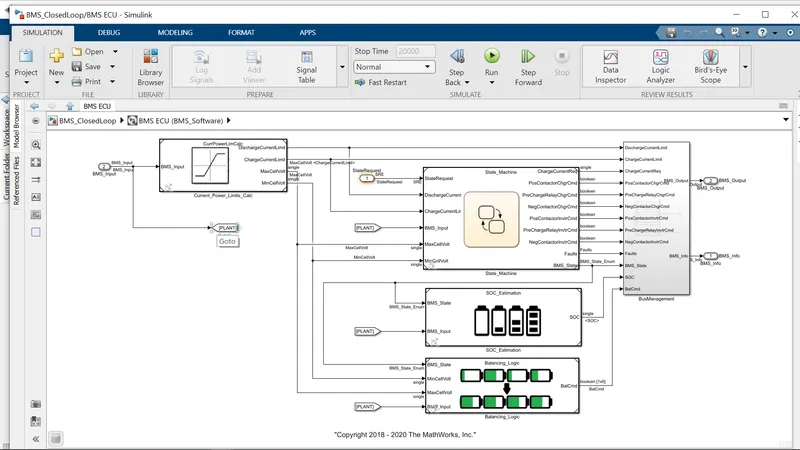
here if we see this arrangementthere is an number of sub-system's and if we observe we can see the SOC_Estimation subsystem. to explore the coulomb counting we should get into this SOC_estimation sub-system
below i am attaching the sub-system arrangement of this SOC_estimation sub-system
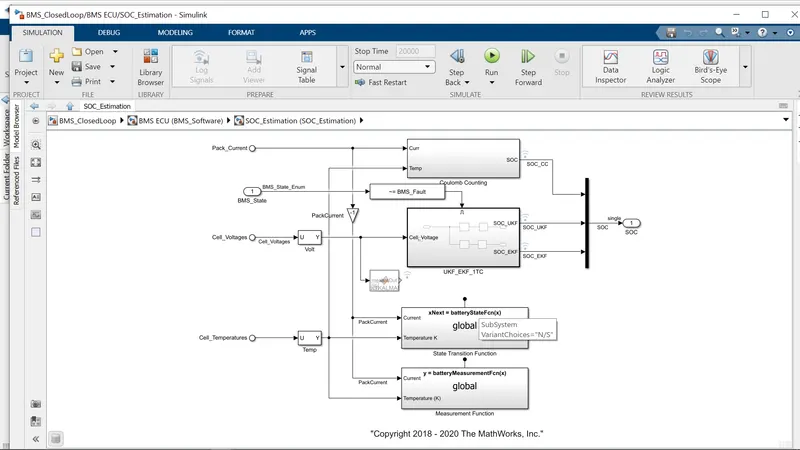
and now in this we can see the coulomb counting sub-system to know more about the arrangement we should get into this coulomb counting sub-system
below i am attaching the image of this coulomb counting sub-system
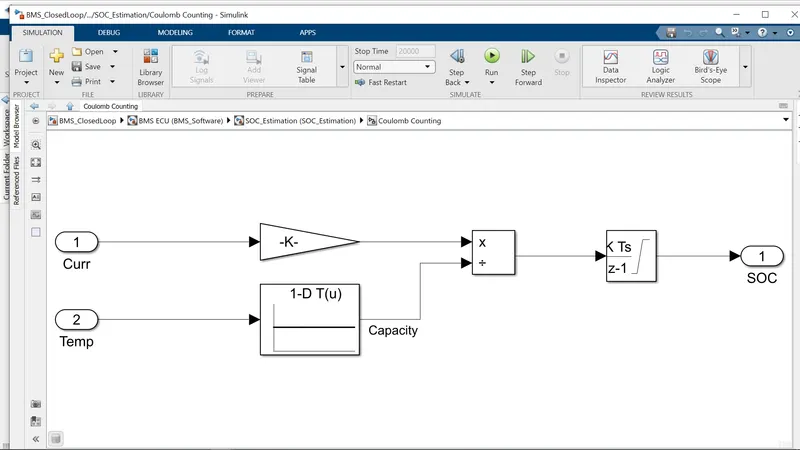
the temparature and current from the battery is given as inputs, current signal is given to the gain block and the temparature is given to the capacity block
these block inputs are given to the integrator where current will be integrated according to the time and this output is given to the discrete time integrator and the SOC is calculated according to the above mentioned equation.
Note :
* the 3 test cases from harness dashboard is simulated and the results are plotted and explained
* the coulomb counting in the BMS_closedloop is explained with relevent equations and the images of the sub-systems in the model
Thank you ;
B. V. N. SANDEEP.