Week-4 Challenge WOT Condition Part-2
1.
Here, When you customize a SI or CI reference application, you can use either a dynamic or mapped engine model.
So, lets first see about the implementation of mapped engine models
- While implementing the mapped type of engine Model uses a set of steady-state lookup tables to characterize engine performance.
- In that The tables provide overall engine characteristics, including actual torque, fuel flow rate, BSFC, and engine-out exhaust emissions.
Now lets see the conditions when to use the mapped type of engines
- If you have engine data from a dynamometer or a design tool like GT-POWER
- For quasi steady-state engine simulations
These are the conditions when to use and how to implement the mapped type of engine
Now, lets see about the implementation of the dynamic engine models
- In this type of engine Model decomposes the engine behavior into engine characteristics that are separated into lower-level components. By combining components in this way, the models capture the dynamic effects.
Now lets see the conditions when to use the mapped type of engines
- If you need a more detailed dynamic model and have component-level data.
- To analyze the impact of individual engine components on the overall performance
In a mapped motor block implements a mapped motor and drive electronics operating in torque-control mode. The output torque tracks the torque reference demand and includes a motor-response and drive-response time constant. Use the block for fast system-level simulations when you do not know detailed motor parameters, for example, for motor power and torque tradeoff studies. The block assumes that the speed fluctuations due to mechanical load do not affect the motor torque tracking.
The above picture represents the basic example of mapped motor in simulink
We can change the motor model type by entering in to the variant manager section which is present in the modeling portion at the top of the simulink page and then selecting the passenger car system and entering into it and then select electric plant and then motor, there you can see the both dynamic type of moder and mapped motor.
2.
To calculate miles per gallon in the given model we should open ev reference application in the powertrain blockset and then, we should go into the visualization sub system, and then again we should enter into the performance calculations
* below i am attaching the arrangement of sub-system of an performance calculation.
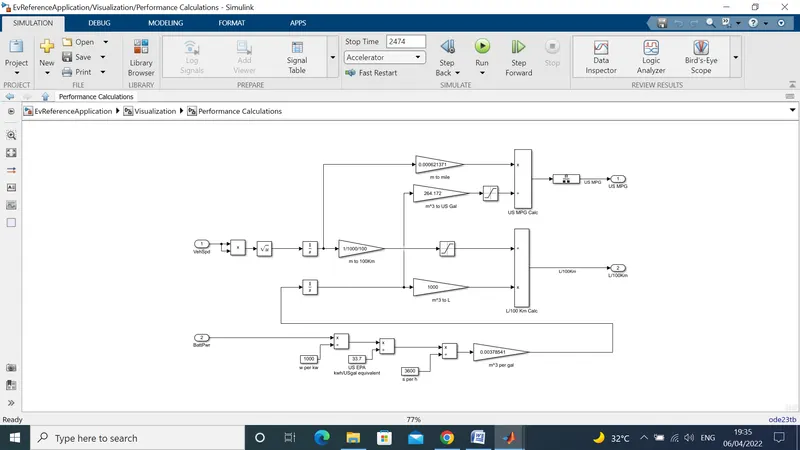
* Battery power data is used to find power used in kwh which is then converted into gasoline equivalent using US EPA value by dividing with 33.7
* Dividing distance travelled in miles by the number of gallons we can get miles per gallon
* As per the US EPA 1 gallon of gasoline is equal to 33.7 kwh
* Vehicle speed data is used to calculate the distance travelled in meters which is then can be converted in miles
* For HEV this gallon is added with gallon used by IC engine then miles per gallon is calculated
* In the system you can observe the blocks (us mpc calc; L/100 km calc; m to 100km; …..)
* Here the vehicle speed and the battery power is taken as the reference or input for these kind of calculations
so, by considering the speed and battery values of the vehicles the performance calculations of the model is calculated
3.
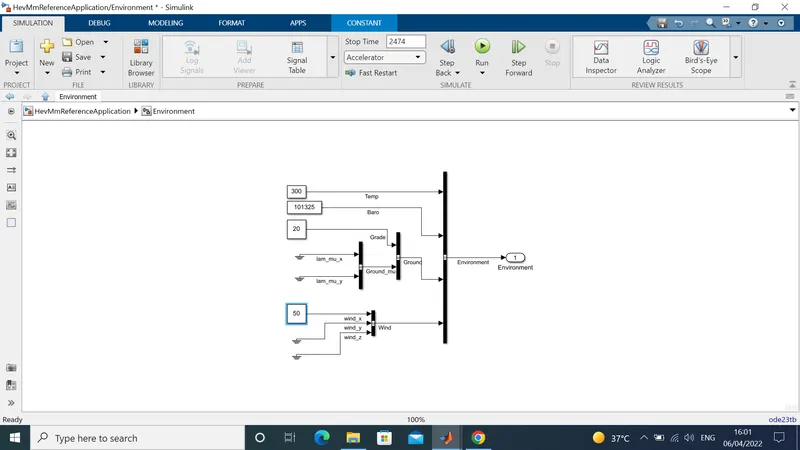
Here they asked me to run the HEV ReferenceApplication with WOT drive cycle by Changing the grade and wind velocity in the environment block
* so, here i am taking the HEV reference application example from the help section of the MATLAB
.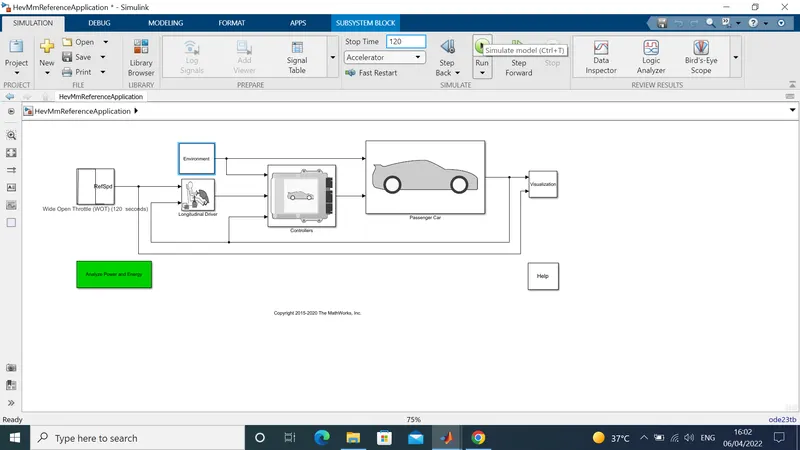
* here i had taken run time as 120 sec, and also changed the drive cycle to WOT (Wide Open Throtal) cycle and below i am also attaching the screenshot of my drive cycle
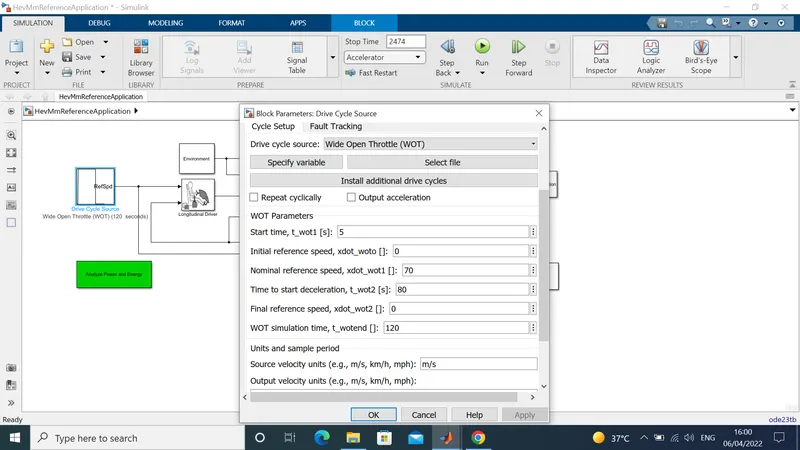
* as you can see that i also changed the spped value and deceleration value and according to that only i had set my run time
* and now i am going to change the grade value and wind velocity value and also attaching the picture of that below
* so, here i am going back and now i am going to run the model and below i am attaching the image of the scope result obtained to me
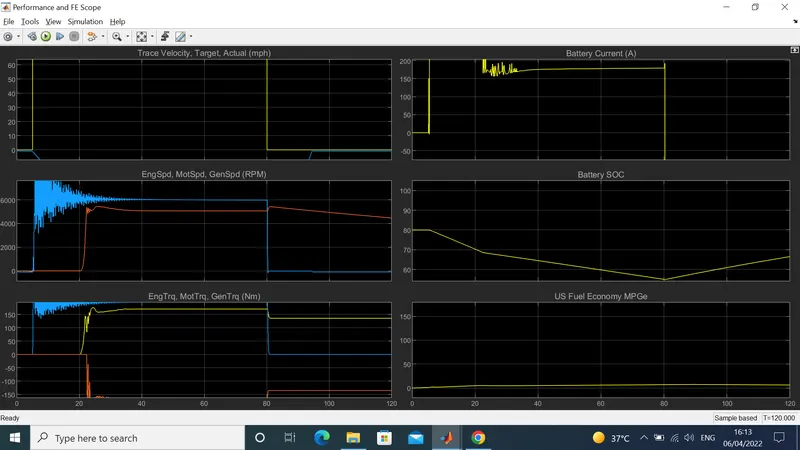
so, in the above attachment you can observe the output values for trace velocity; SOC; ENG speed and MOT speed; battery current; ENG & MOT torque; and fuel economy.
4.
Here they asked me to repeat the same exercise by Keeping all other parameters same, compare the simulated results of hybrid and pure electric powertrains
* so lets see for HEV powertrain blockset
so, as previously i am taking an example of HEV block set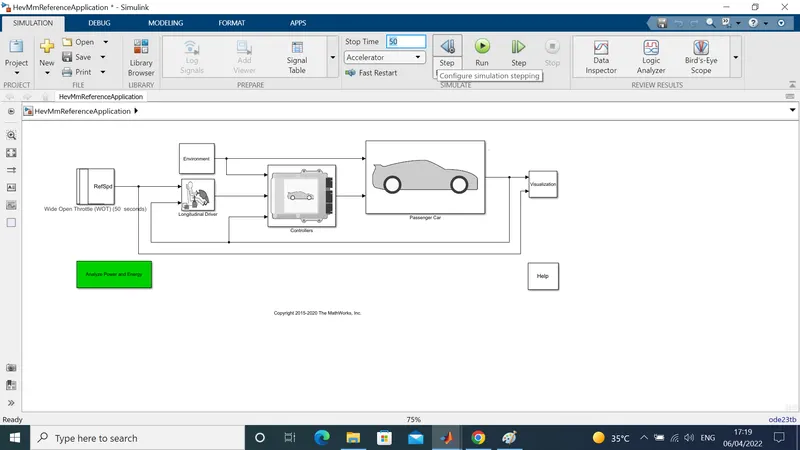
* so here i had taken my run time as 50 sec and keeping all the other parameters at normal value, i had kept the drive cycle as WOT drive cycle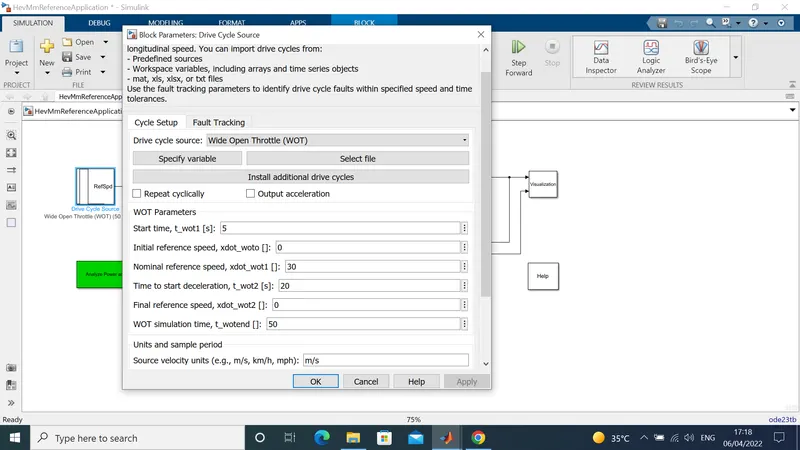
* and now i am coming back and going to run my simulation and below i am attaching the scope obtained
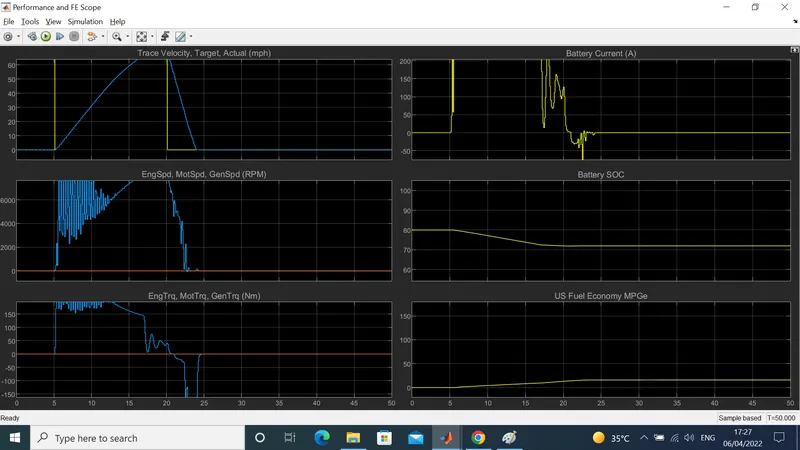
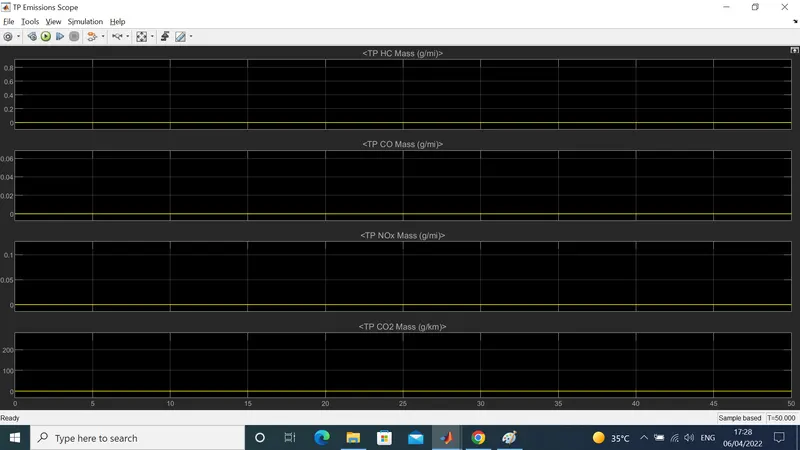
* here we can also observe the another scope that is TP emission scope and those values will be at constant because there are very less of TP emissions
** so, now i am taking the pure electric powertrain blockset
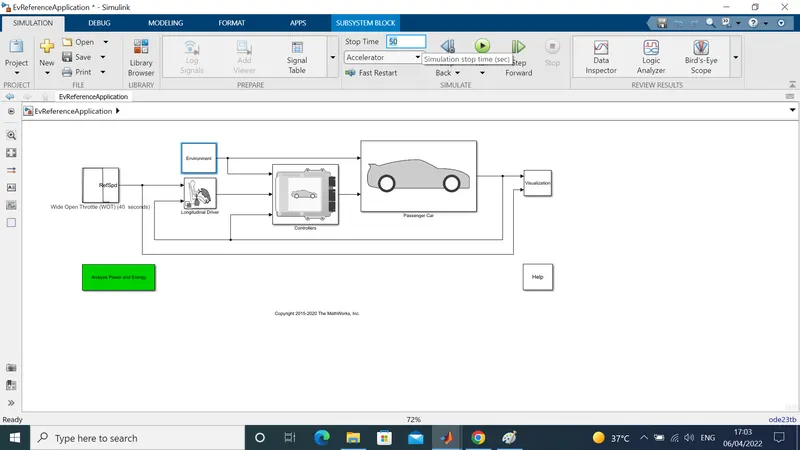
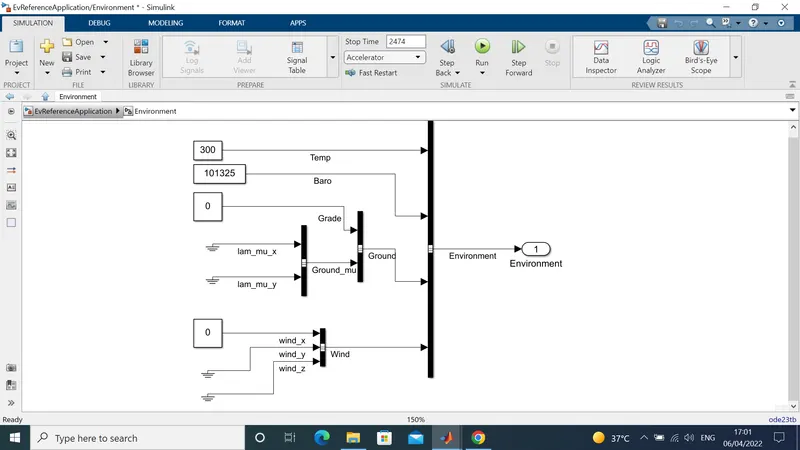
* here also all the environment values are at same and there is no change in those parameters
* here also i had taken WOT drive cycle into consideration
* and now i am going to run my model for 50 sec and below i am attaching the scope results that obtained
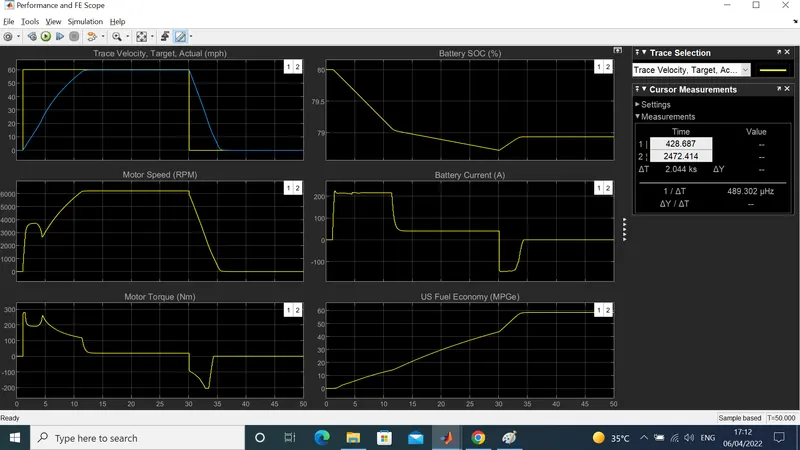
so. here also we can observe the output graphs for different kind of parameters as we observed previously
so, comparing the both models we can observe a lot of change in the graph of SOC between the EV and HEV model not only in SOC but also in battery current and the torque values are also very different
there is also a lot of difference between the speed of the motor and fuel economy is also varied accordingly in both EV and HEV models and their outputs
so this is the difference between the EV abd HEV modules
Thank you
B. V. N. SANDEEP