Week 7 State of charge estimation
SOLUTION 1 : We are asked to simulate the 3 test cases from harness dashboard and write a detailed report on the results.
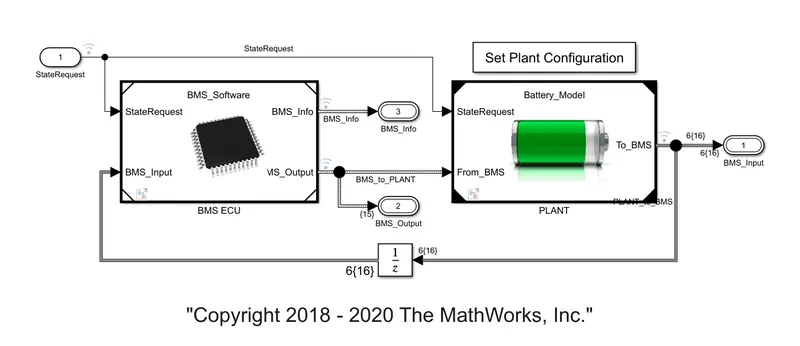
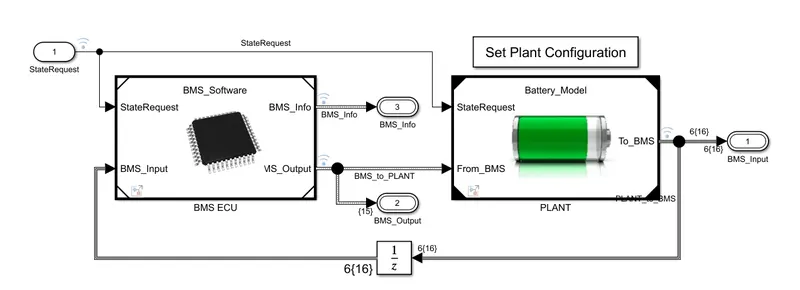
The matlab Model for the Battery Management System is shown in the figure below :
The matlab model for the Testing Harness is shown in the figure below :
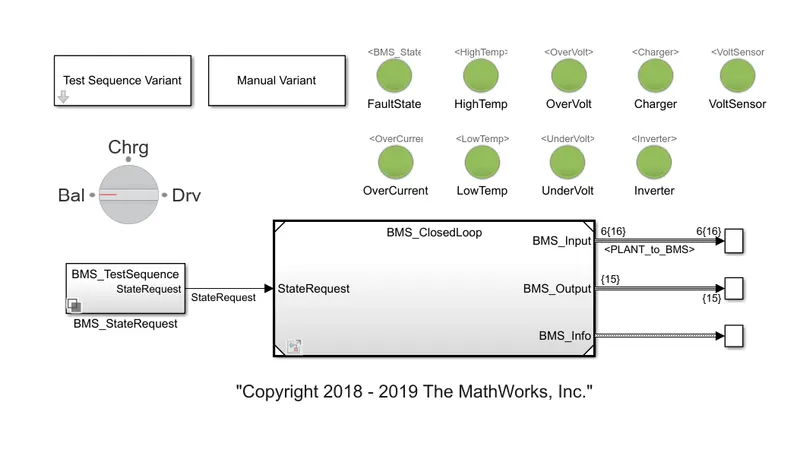
In this Harness Testing model we have 3 tests , which can be selected using the Test Sequence Variant block .
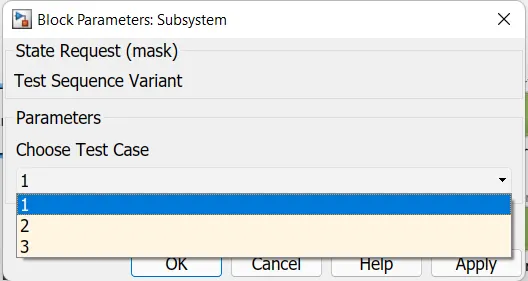
Test cases can be selected from this subsystem block.
After selecting a certain test number we can see whether it is the correct one selected for testing and also the Steps in that testing .
This can be done with the help of the BMS_StateRequest block used in the model . On opening this BMS_StateRequest model we get :
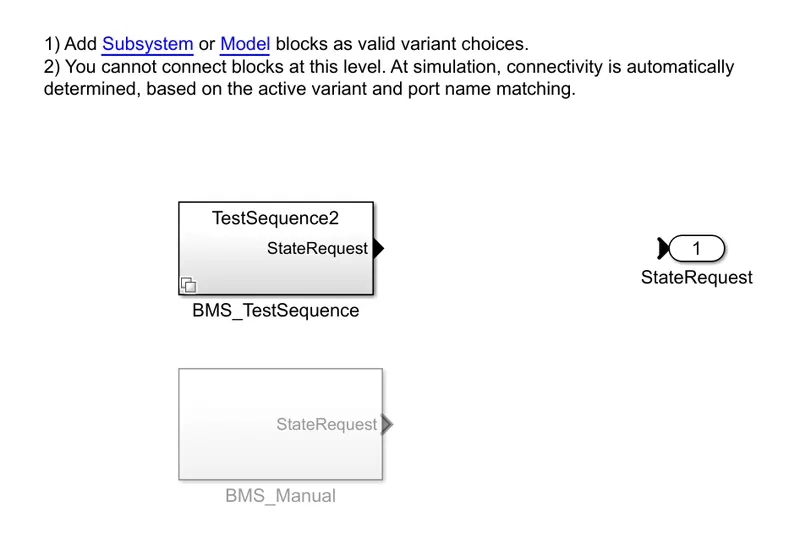
Going further into the BMS_TestSequence block inside this block, we can see whether it is properly selected .
From the following figure we can see which Test sequence is selected ,
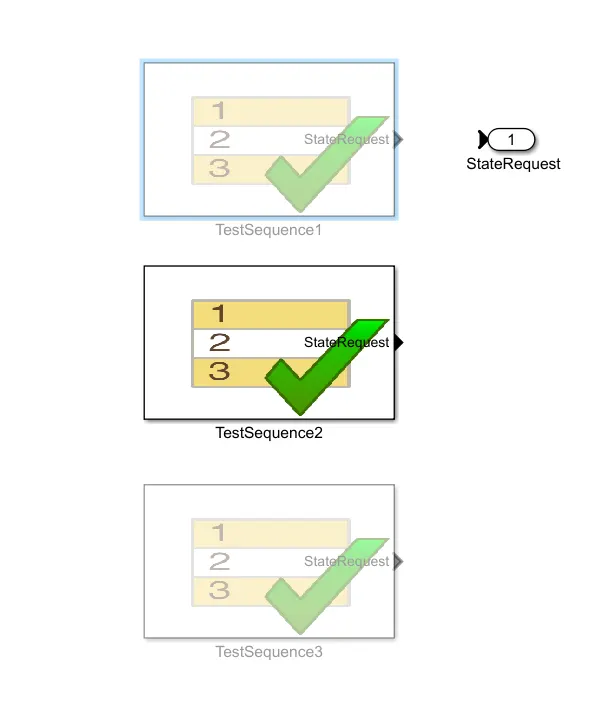
Here it is seen that Test 2 is selected , hence it shows correctly .
So we are next going to each Tests one by one .
CASE 1 : Test 1
We select the Test number 1 from Test Sequence Variant block .
The following will be the result of the simulation :
On running the simulation we get the Scope result as :
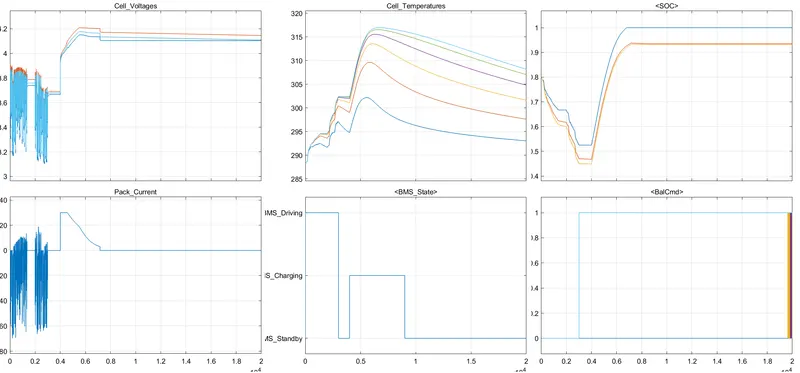
In this plot Cell temperature for 6 seperate cells in the pack are shown .
The initial transients in the Cell voltage are observed which can be later seen as constant value when the simulation is nearing its end .
SOC of the cells can be seen decreasing initially and then it steeply increases and remains at a constant value .
The pack current also has initial transients which then steeply increases all of a sudden , then returns to the intial value .
We can check now whether actually the Test 1 itself is being considered for the Harness test . For this we go to the appropriate blocks as
mentioned before . We get it as :
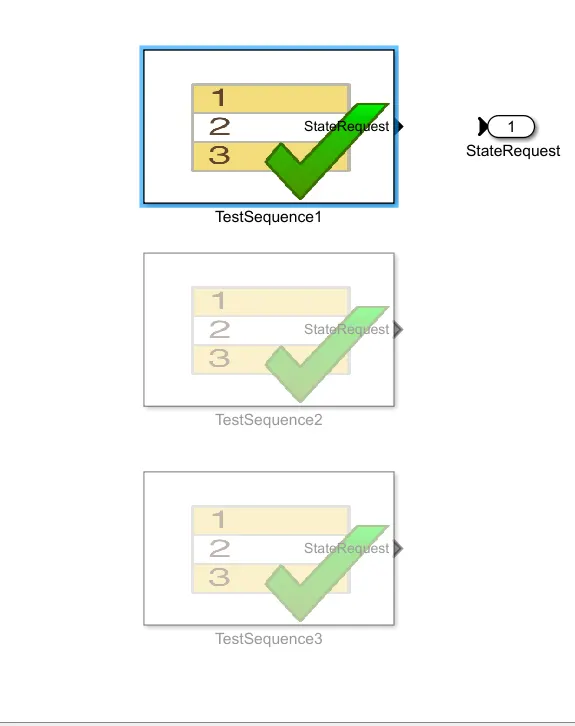
On getting into the TestSequence1 block we can see the following window open :
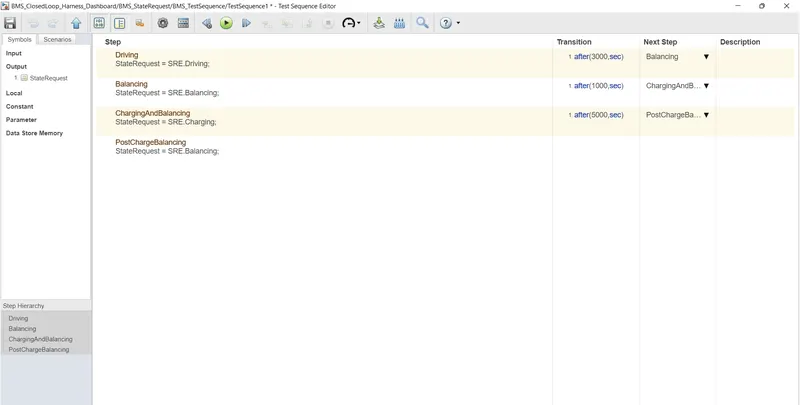
It has 4 steps in it , which are Driving ,Balancing , Charging and Balancing , Postchargebalancing .
CASE 2 : Test 2 :
ON selecting the 2ND test we can see that in the test sequence it is 2 itself that is selected .
Inside the TestSequence2 block we get the following window :
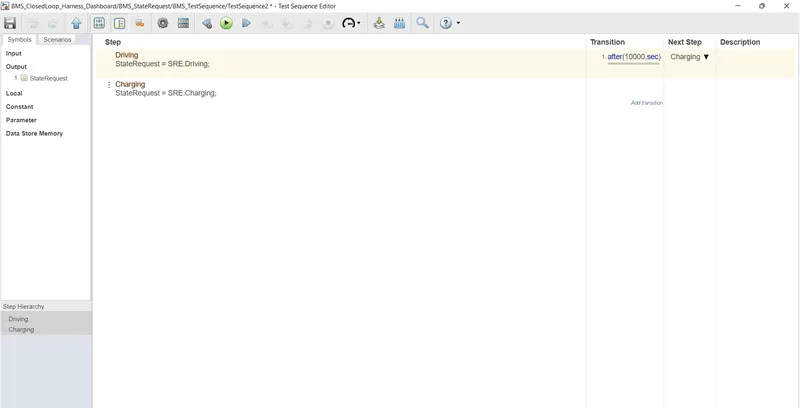
Here there are 2 steps in the test .They are driving and charging .
The simulation results will be displayed in the scope as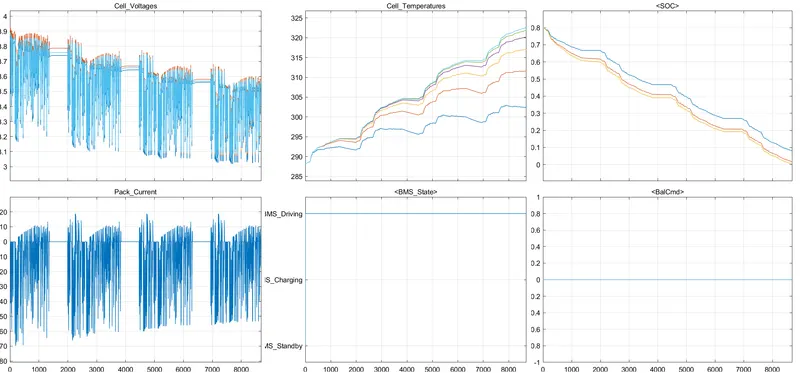
Here it can be observed that the Cell voltage and the pack current are both consisting transients during the simulation. The Cell temperature of each cells can be seen increasing . The SOC can be seen decreasing non linearly over the runtime .
CASE 3 : Test 3 :
Now test 3 is carried out and we get the Testsequence3 result as :
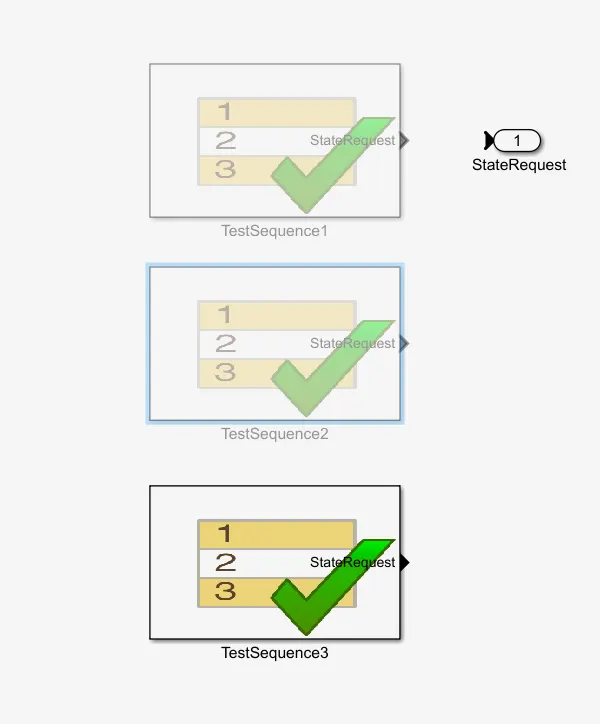
On getting into this block we get the step as :
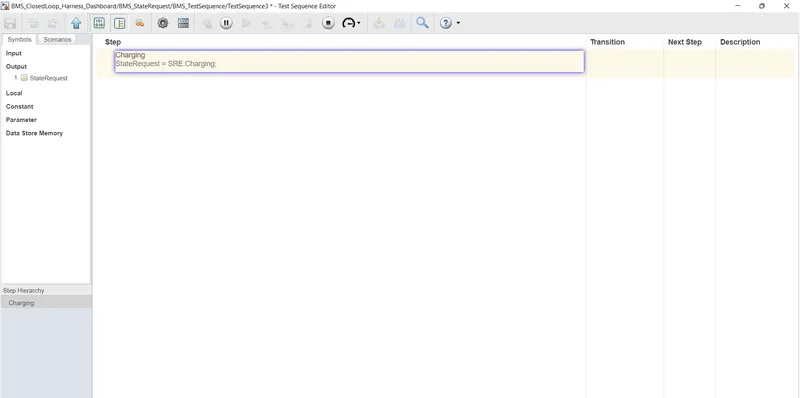
There is only a single step : Charging in the Test3 .
The result shown in the scope will be as follows :
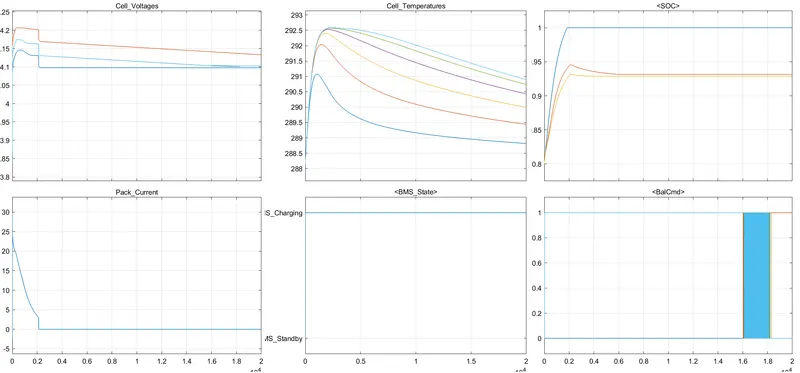
Here it is seen that there is no transients in both the pack current and the cell voltages as it was there in the early Tests.
Cell temperature can be seen rising initially , which then reduces gradually. SOC Of the battery is seen increasing initially and then remains at a certain point . Pack current can be seen decreasing and then remains at a constant value .
SOLUTION 2 : We are asked to explain Coulomb counting and explain how BMS implements coulomb counting for SOC estimation in the given model of Battery .
Coulumb counting is a method which is used to find the SOC of the battery with the help of discharging current and also the previous SOC Values .
What it does is , discharging current is measured and then it integrats discharging current over time and thus SOC is estimated .
The figure below shows the Model of the BMS :
The BMS ECU Subsystem will be as shown in the given image below :
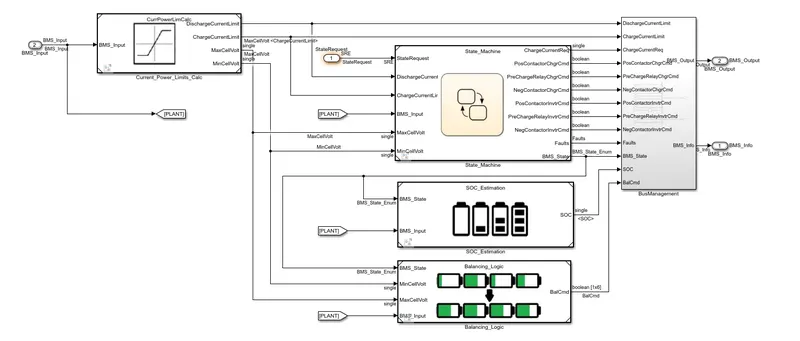
This BMS contains a Current Power Limits Calculator, State Machine ,Bus Management , Balancing logic and SOC estimation connected .
The Current Power Limits Calculator is the block which sets both upper and lower limits values for current and voltage for discharging and charging of the battery . These limit values will be fed into the State Machine block as the input .
From this State machine block an output is send to the next block SOC Estimation which finds the approximate value of the SOC . The other input to this SOC Block is from the PLANT BLOCK .
Next we go into the SOC estimation subsystem . It will look as follows :
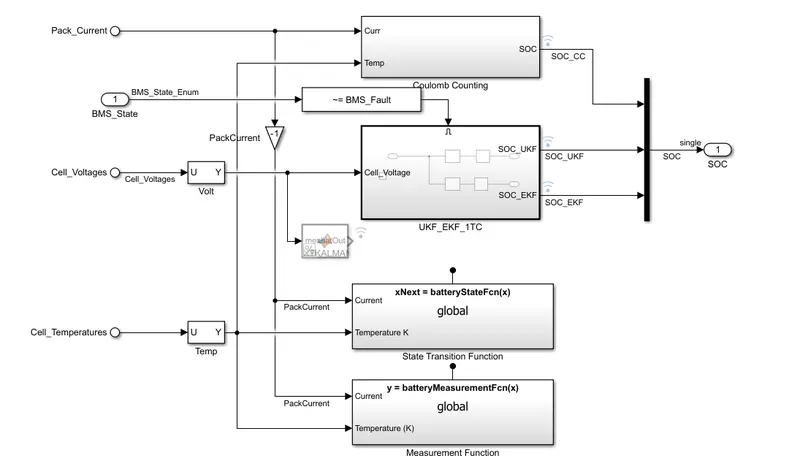
Cell voltage and cell temperature is given as inputs to the blocks in this subsystem .
The inputs given to the Coulomb counting block are the Peak current and the Temperature . Using these the SOC is estimated by the Coulomb Counting block .
In the following figure the susbsytem of Coulomb counting is shown :
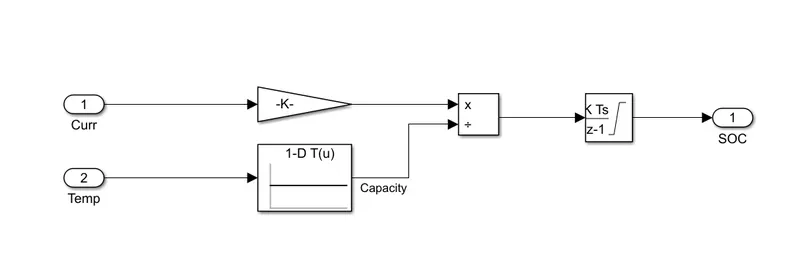
There is a Gain block with the following parameters in it :
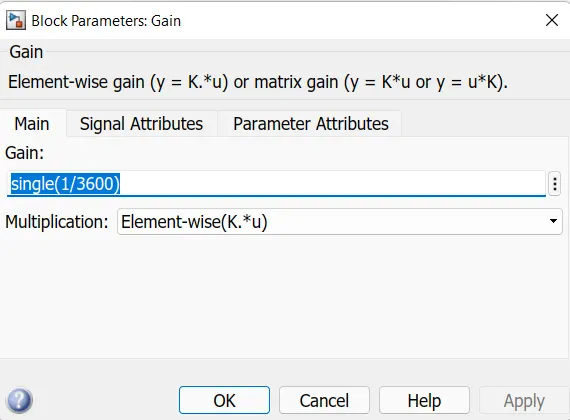
The gain is the value of the Current in the battery, discharging or charging during a certain time interval .
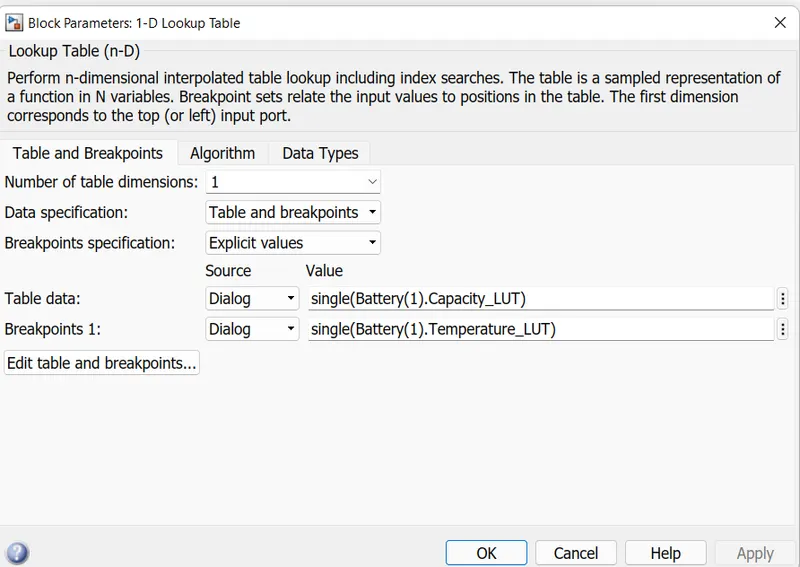
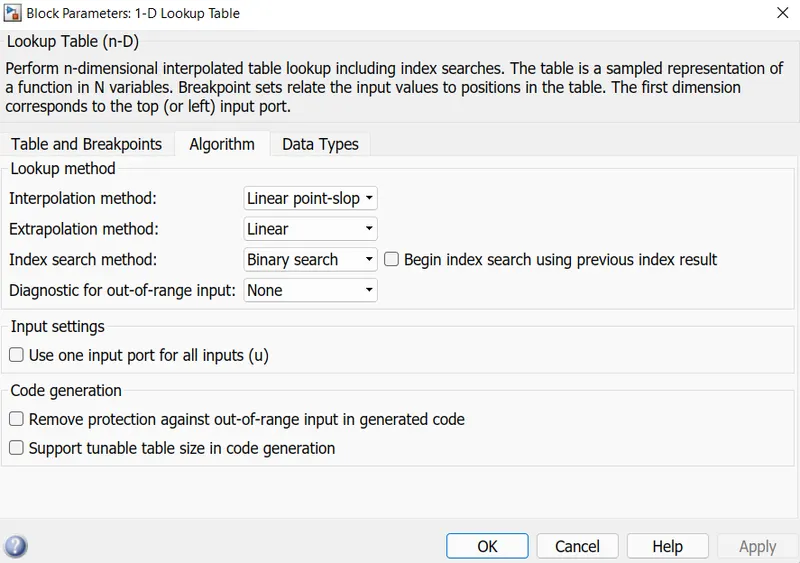
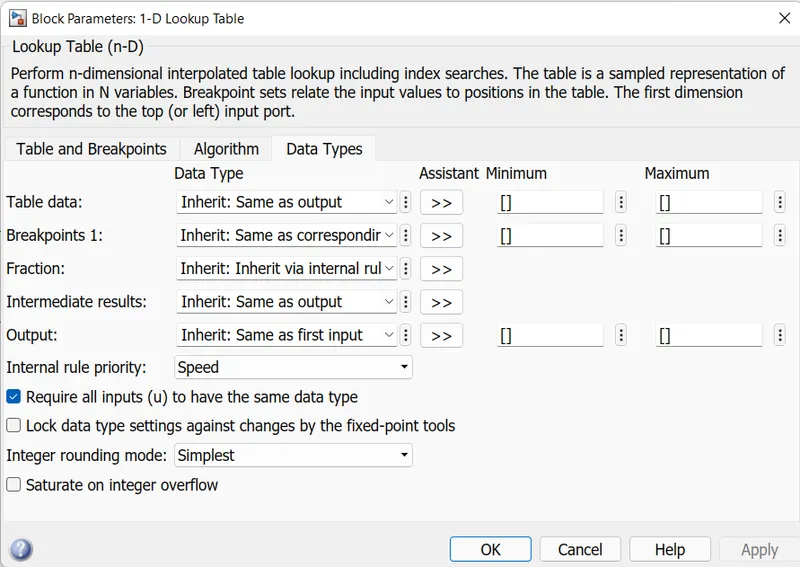
We have 1D Lookup table which represents the battery capacity .
An there is a Lookup table with the following images showing the different parameters of it :
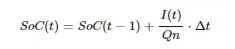
The SOC of battery can be estimated by using the following equation :
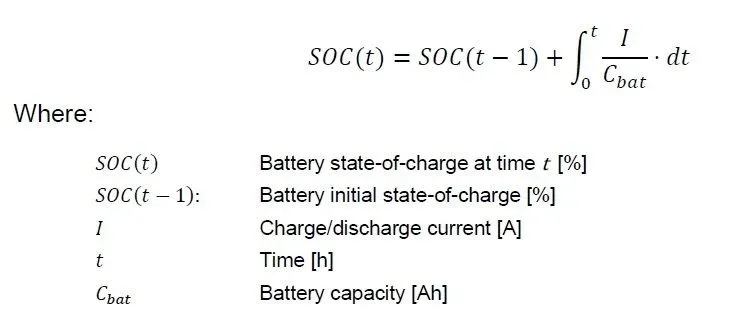
A DISCRETE INTEGRATOR BLOCK is used to integrate the SOC over a time period to calculate SOC added or subtracted for charging and discharging respectively .
This SOC value can be then added or subtracted from the previous SOC value .
So a model is built for this equation and hence SOC can be calculated .