Week - 4
AIM I : Create a simulink model for the simulation of a Washing Machine
To implement the control logic of a “washing machine” using Stateflow as per given sequence:
- If the power supply is available, the system gets activated
- If the Water supply is not available, stop the process & indicate through LED
- Soaking time should be 200s followed by Washing time of 100s.
- Then rinsing happens for next 20s & dryer runs for 50s
After all the processes have completed turn on the finished LED.
Introduction
Washing machine is a revolutionary machine which was invented by Jacob Christian Schaffer in 1767 and is used for the cleaning clothes in a much simpler way when compared to the age old method of washing clothes by hands which is a vigorous physical process.Since the invention of the machine there has been a lot of improvement with the working and models of the washing machine . There are manual and automatic washing machines too in the market , which reduce the human effort almost to zero.
Working principle
There are two forces acting in the machine which plays a major role in the working of this machine .They are Centrifugal and Centripetal forces. There are two primary working cycles for the washing machine . They are Wash cycle( which uses Centrifugal Forces) and the Rinse cycle ( which uses the centripetal forces ). The entire cleaning process of the washing machine happens in such a way that both these cycles repeat one another many times , so that the dirt is removed properly from the clothes.
Layout of a Washing Machine
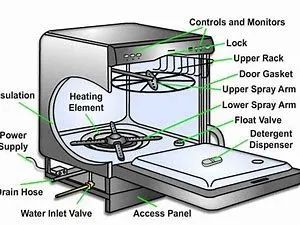
We can arrange the data given to us into a step algorithm with the processes involved . :
(a) Soaking - 200 sec ( 0 -200 )
(b) Washing - 100 sec ( 200 - 300 )
(c) Rinsing - 20 sec ( 300 - 320 )
(d) Drying - 50 sec ( 320 - 370 )
(e) Power OFF : After drying (> 370)
To implement this simulation model we use the following blocks :
(a) Constant - Power and Water Supply
(b) Toggle Switch - To Turn ON & OFF the machine
(c) Chart - Control Logic
(d) Lamp - Indicating Signal
(e) Scope- To Display the output states.
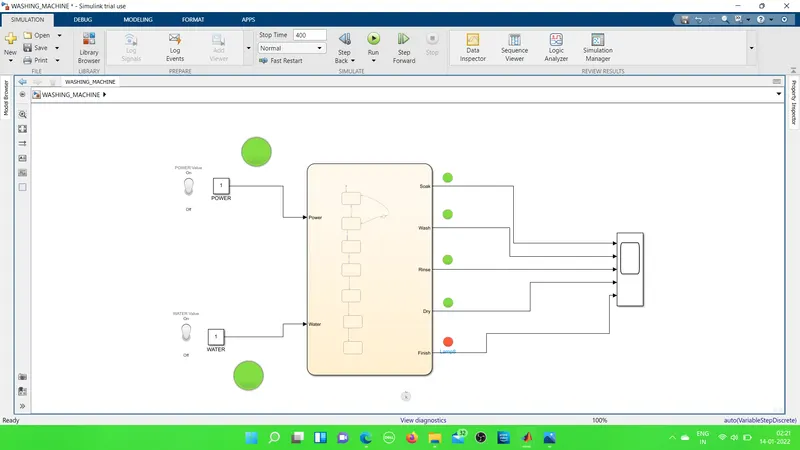
MAIN SYSTEM MODEL :
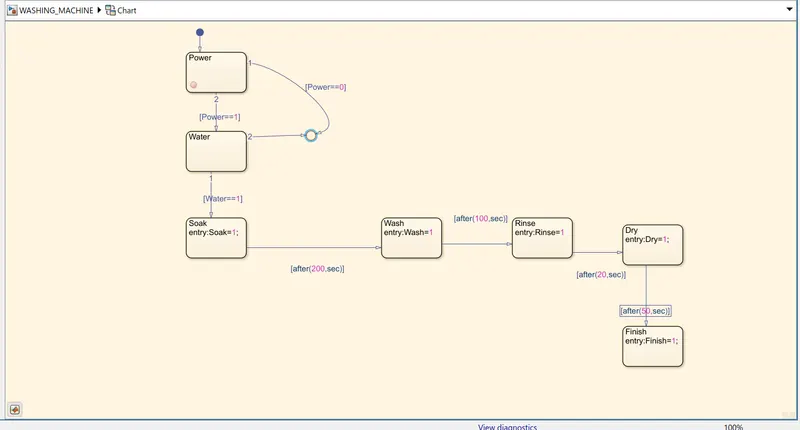
CHAR STATEFLOW MODEL :
The input and outpu ports in the chart is mentioned below
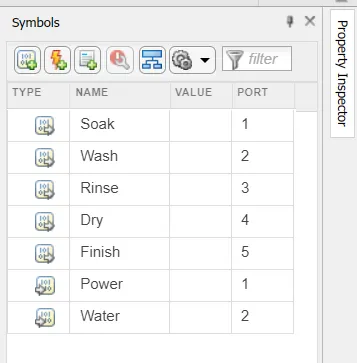
In this given table it is clearly mentioned that Power and Water are input ports 1 and 2 respectively.
The output ports are Soak, Wash,Rinse,Dry and Finish represented by ports 1,2,3,4 and 5 respectively .
DETAILED ILLUSTRATION OF THE STATEFLOW :
There are 7 states which we used in this Chart block to run the stateflow , they are mainly :
POWER STATE : Here we check whether the Power in to the system is ON or OFF. If the Power is ON , then the program will run , i.e it goes to the next state if the condition is true or else it will not .
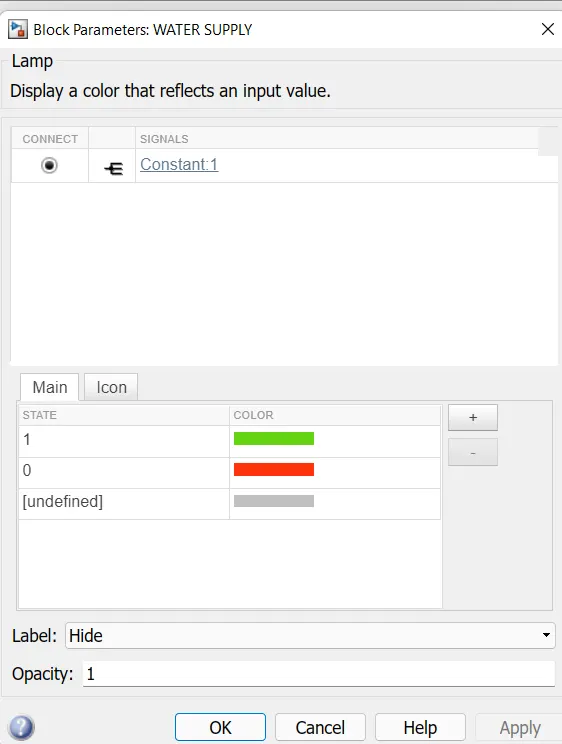
This is the lamp block dedicatedv to the water supply condition. It indicates green colourif the input port has water supply ON or else it shows red colour. Similarly we have a Power Supply indicator lamp also , which does the same process but checks for Power Supply availability.
WATER STATE : This state is used to check whether there is a Water supply into the system or not.
Using input ports , toggle switch and lamp indicators ,here we make sure that the chart process happens according to the ON and OFF of these toggle switches.
A junction is inserted so that if there was no input then the cycle of the simulation will not proceed forward and the function will be terminated.
SOAKING STATE : This soaking state is the process immediately if there is Power and Water supply . This process runs for 200 seconds. Only then will move to the next part of the cycle.
WASHING STATE : After the soaking process of 200 sec this state will be ON where clothes are washed.This washing process will continue for another 100 seconds.
RINSING STATE : After a 100 sec washing process this state will be ON. This rinsing process continues for the next 20 seconds.
DRYING STATE : A 20 second process of rinsing will take us to this state, which again takes another 50 seconds to dry the clothes..
FINISH STATE : In this state the process will be over and the stateflow should be over. A manual switching OFF of the power should be done which can be done with the help of a switch and lamp indicators.
So now we carry out all the scenarios as mentioned in the objective :
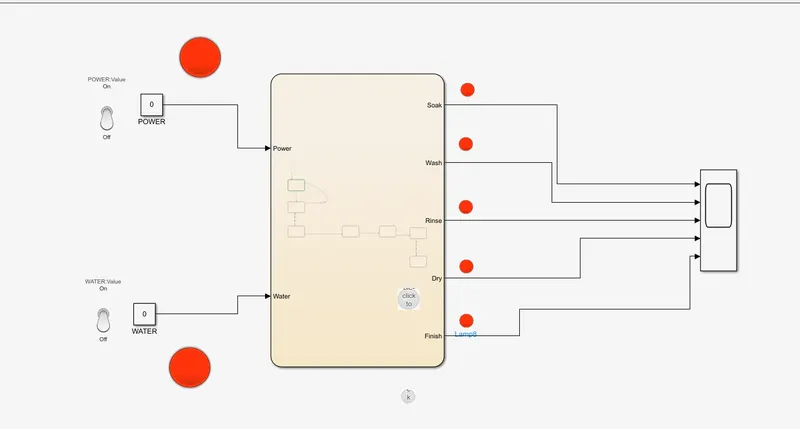
1.Initially we check our system with No power and water supply .We get the following lamp indications :
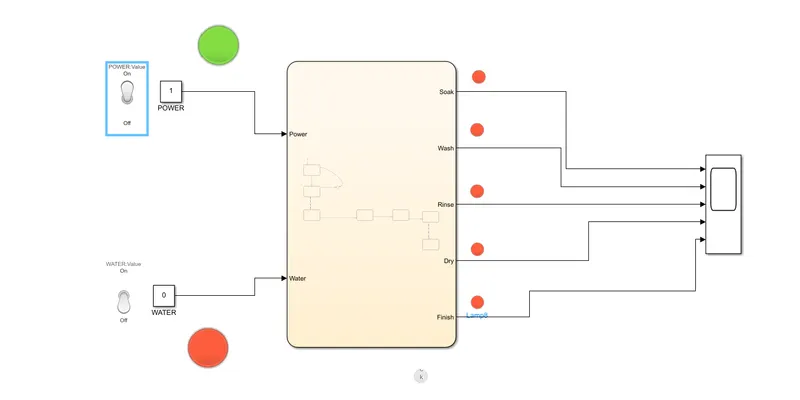
2.We now Turn the Power supply on , with stilll no water supply
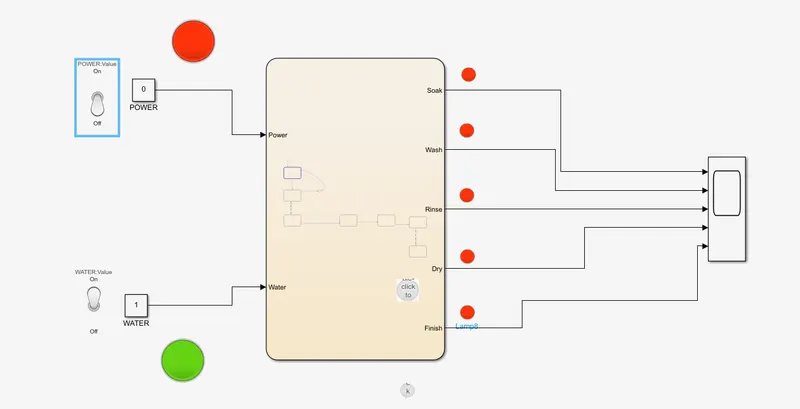
3.Then we give water supply but no power supply :
Then we give both the Supplies then we can see that the process occurs properly :
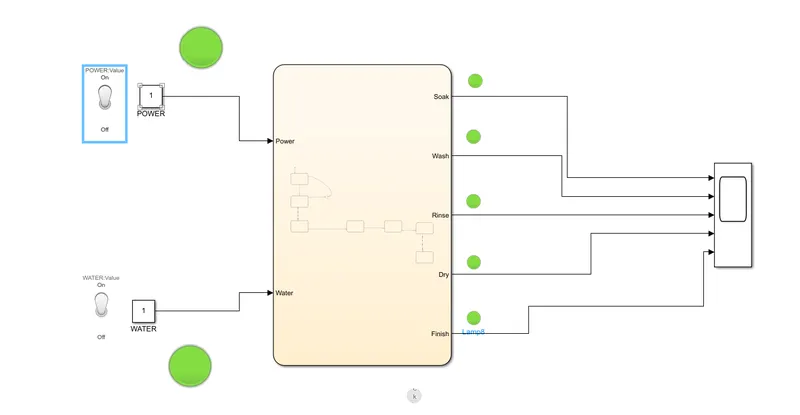
Now we check how the processes are done with time :
First we see it at 200 seconds' : which shows that soaking is being done .
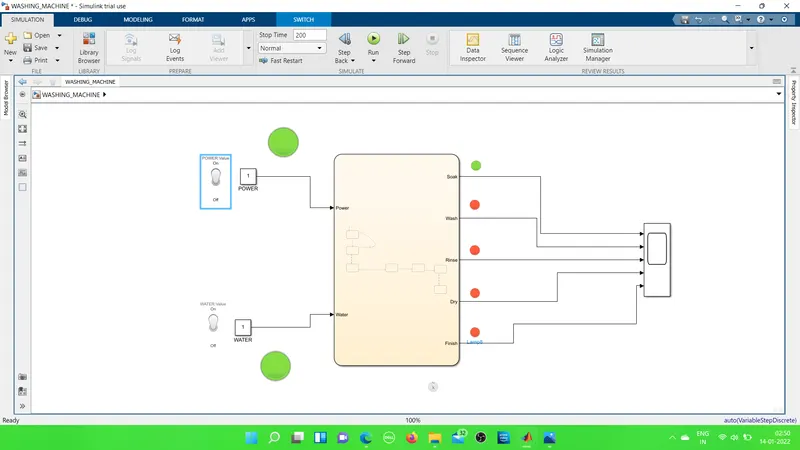
Similarly we can see that all the processes are being done properly on time with proper indication in the lamps .
The output of the scope is as follows :
Hence the simulation is done . Conditions are checked and the output is seen in the Scope .
AIM II : To make a simulation for the Gift Shift Logic according to the given conditions :
| Speed Range(kmph) | Gear |
| 0 - 15 | 1 |
| 16 - 25 | 2 |
| 26 - 40 | 3 |
| 41 - 60 | 4 |
| Above 61 | 5 |
We are asked to enter Speed while the simulation is going On and the gear number should be indicated at that time .
INTRODUCTION :
Gear is a component in a mechanical system ( a mostly toothed cylindrical or roller shape component ) which mesh with another toothed part to transmit power from one shaft into another.Gear is mainly used to obtain a different torque and speed, or to change the direction of the shaft . Several other power transmission devices like belt drive, chain drive, rope drive etc. are available but the main advantage of gear system is that it has almost negligible or no slippage between the components in the system. Gear works under the principle which state that energy can neither be created nor destroyed but can be converted from one form into another ..
Explanation of Model :
In this Gear Shifting simulation model we have used the following blocks :
(a) Slider : Thus block is used here to change the speed maually during the simulation. We didnt keep the simulation time here as Infinity , instead we used a Real time-kernel block :- Real time synchronization block.
(b) Chart : To carry out the processs of stateflow we need a chart. Chart illustration will be explained in the further section.
(c) Display : To display the Gear no. according to the speed we use a display block .
(d) Scope : To depict the variation of the Speed and Gear , we use a scope
(e) Constant: This block is connected to the Slider block which is furtherly connected to the chart block ehich carries the control logic for speed variation and gear change .
(f) Real time synchronization :
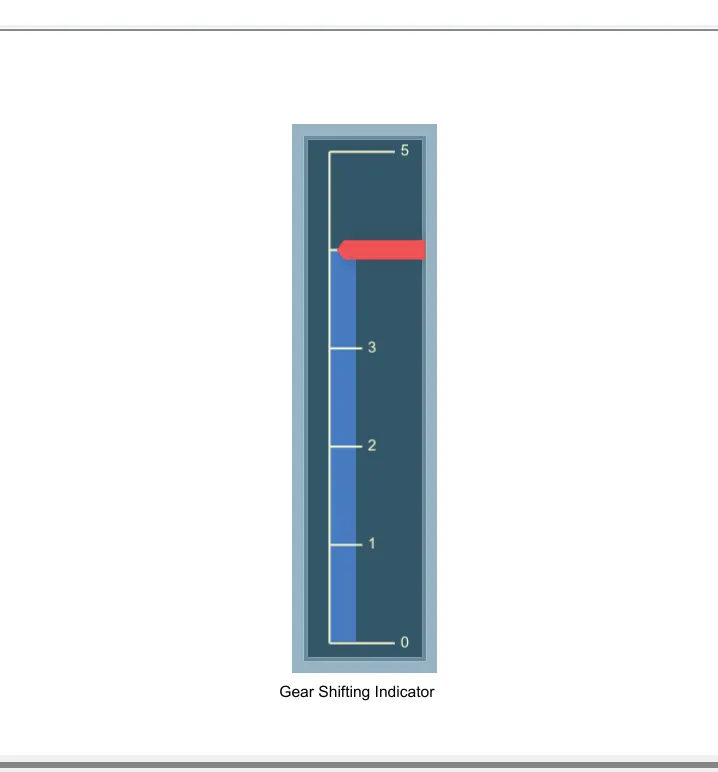
(g) Vertical Gauge block : We have used a Gauge block here named as Gear Shifting indicator which has all the gears arranged vertically and according to the displayed gear , it shows up in the Indicator block.
SIMULINK MODEL :
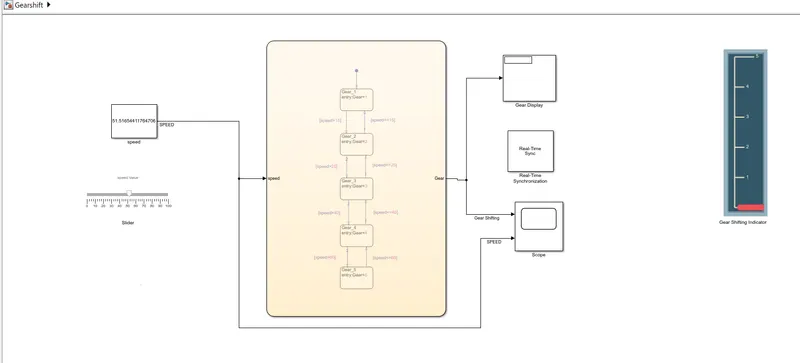
Stateflow logic :
The speed is taken as input into the chart .
So we have 5 states here named as Gear_1,Gear_2,Gear_3,Gear_4 and Gear_5 . Only a single variable named Gear is used in this chart .
Initial State is Gear_1, here if the speed is greater than 15 then the gear will be shifted to 2nd gear or else it will remain in the 1st gear itself..In the 2nd state i.e. Gear_2 ,here if the speed is greater than 25 then the gear will be shifted to 3rd gear or else it will remain in the 2nd gear itself. In the 3rd state i.e. Gear_3 , where if the speed is greater than 40 then the gear will be shifted to 4th gear or else it will remain in the 3rd gear itself. Then there is the 4th state ,where if the speed is greater than 60 then the gear will be shifted to 5th gear or else it will remain in the 4th gear itself. Then if speed is greater than 60 iit will remain in the 5th gear itself or else it will shift to the lower gear. This is what the 5th state checks.
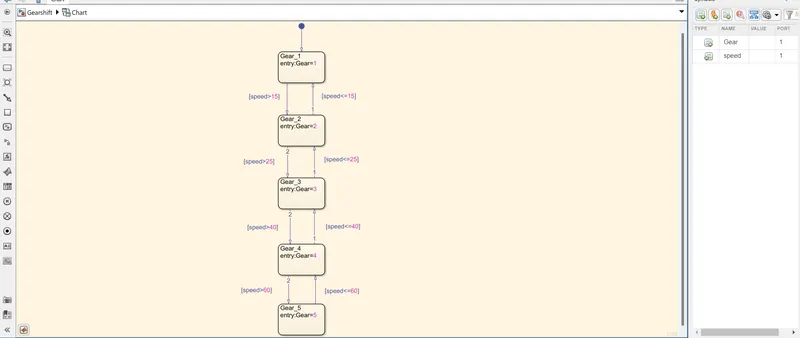
Inthe symbols pane we have assigned speed as the input given to the chart and the output is Variable named 'Gear' .
Now we show the example of a running condition here :
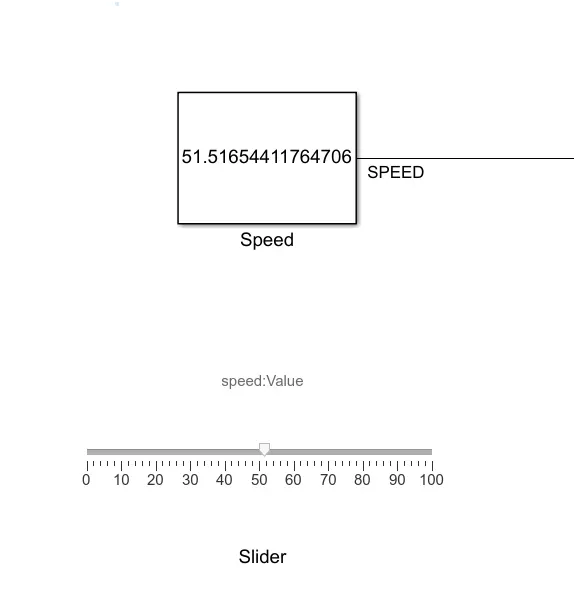
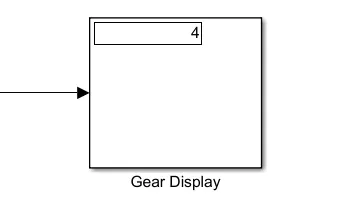
The speed entered is 51 in the slider . So according to the data given to us the gear for this speed will be 4th gear .
The input speed :
The Output Display:
Gear Shifting Indicator Display
Hence we displayed the Gear according to the speed and thus objective is achieved .