Week 7 State of charge estimation
Q1. Test case 1:
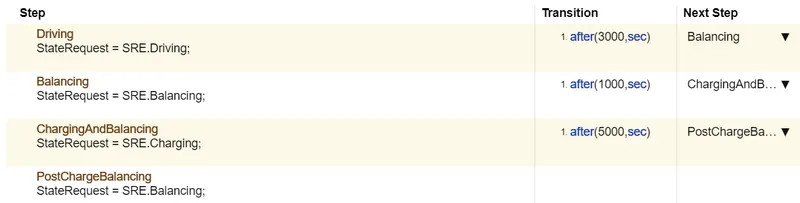
When the above test case was applied on the BMS model, the following results were obtained:
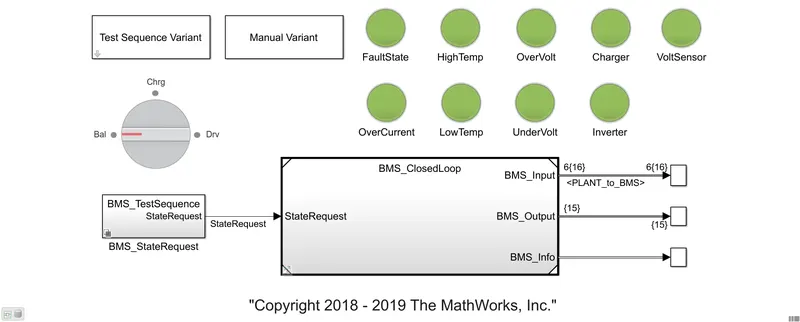
We observe from the harness dashboard that all system paramters like voltage, current and temperature are within limits and no faults were observed during this test cycle.
Now let's look at the output plots:
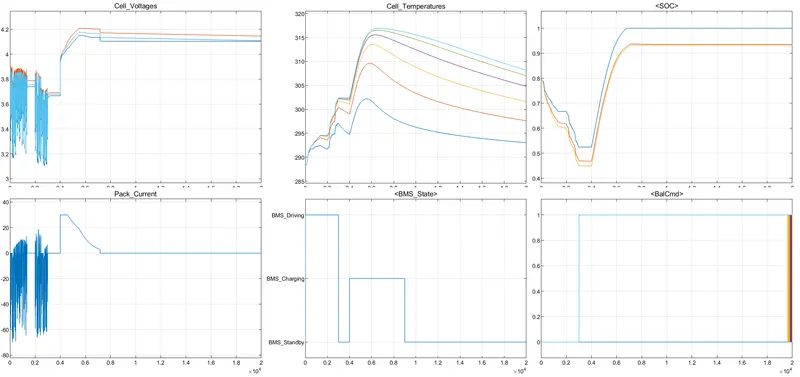
Inferences from the result plots:
1. The EV was subjected to three modes: driving, charging and stand by.
2. During the driving state from t=0-0.3*10^4 sec, The cell voltages and currents follow the car's drive cycle.The lowest cell voltage was around 3.1V and the lowest current was -70A. The negative voltage and current were due to regenerative braking mode.
3. We can observe slight increase in SOC and cell temperature peaks during this time again due to regenerative braking. The final SOC is around 50% and the highest temp around 315K
4. From time t=0.4-0.9*10^4 sec, the EV is in charging mode. That's why we observe increase in the cell voltage as cell gets charged. Also there is a momentary peaking in the current in the cell, but after the full voltage is reached, the current dies to zero.
5. The cell temperatures start decreasing during this time, but a clear difference is seen in the temperatures of various cells.
6. The SOC start increasing and reach 1 which is fully charged. We see difference in SOC due to different methods of calculations.
7. The cell balancing command was provided for one cell at 0.3sec.
Test Case 2:
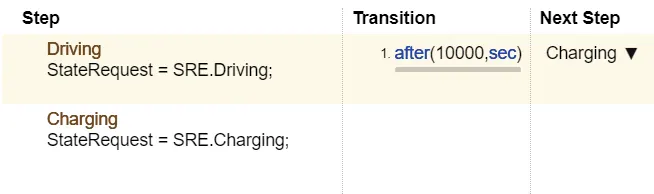
After applying the second test case, the following results were observed on harness dashboard:
Again all the parameters seem normal, lets observe the plots to find the difference:
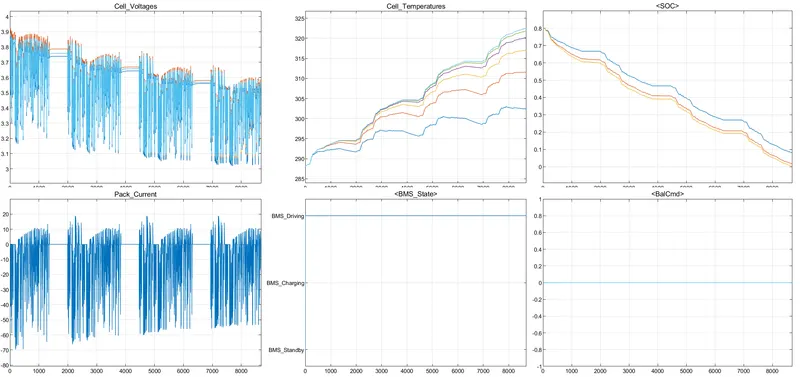
Inference:
1. The simulation stopped at 9000 sec when the SOC became zero
2. We observe a fall in cell voltage and current based on the drive cycle.
3. The temperature seems to go on rising which will cause a thermal runaway.
4. The SOC falls down to zero by 9000 sec
Test case 3:

The following test case was applied on the model and the harness dashboard appeared as follows:
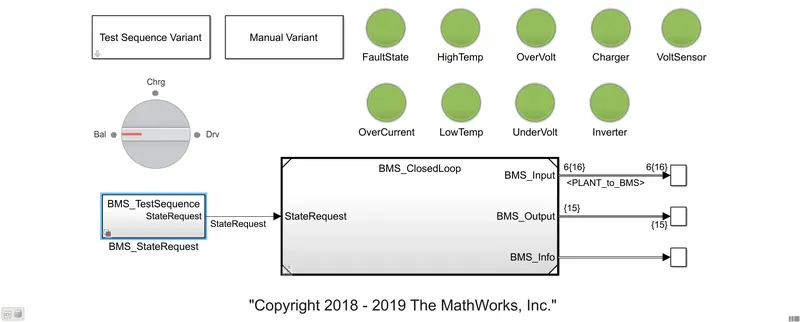
All the parameters are within the limits. No fault detected.
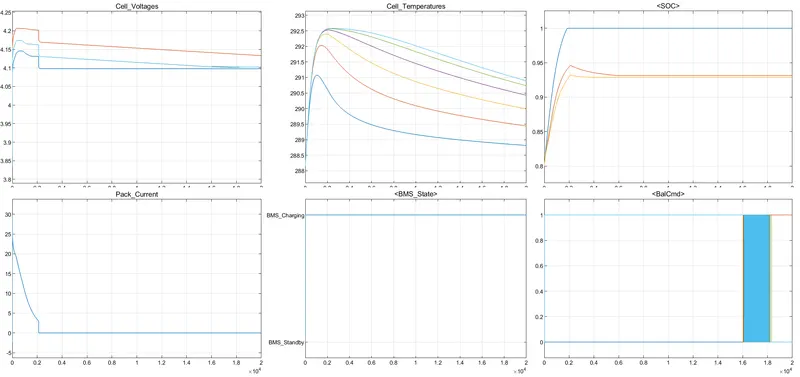
From the plots we have the following inference:
1. Due to charging throughout the test case, we see the pack current, rise in the beginning due to transients and then maintains at zero when it's fully charged.
2. The cell voltages also rise momentarily but later maintain at their full charged voltage. The difference in cell voltages is observed which later undergoes balancing.
3. The cell temperature rise to around 292.5K. After the full charging is done, there is a decrease in cell temperatures.
4. The SOC reaches 1 in 0.2*10^4 seconds, we observe the differences in SOC due to method of calculation.
Q2. Coulomb counting method for SOC determination:
The coulomb counting method is also known as the battery current integration method. In this method, a discharging/charging current I(t) is measured and integrated over time to calculate the amount of energy remaining inside the battery.
Let's observe the model blocks that do coloumb counting-
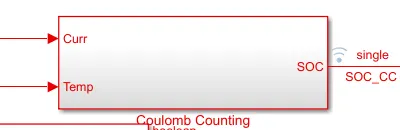
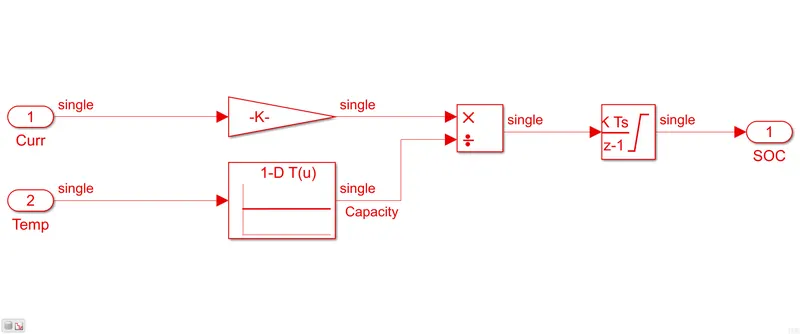
The coulomb counting block takes the pack cuurent and temperature as inputs to estimate the SOC. Now lets see the inside of this block:
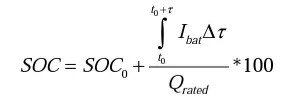
The common equation to calculate the SOC where the `SOC_0` represents the initial SOC, `I_(bat)` represents the current across the battery and,`Q_(rated)` is the nominal capacity of the battery.
The SOC module takes the current input and multiplies it by 1/3600. Then takes the temperature and finds the capacity at that temperature using look up table. Then the current is divided by the capacity and integrated to get the SOC.