Week-4 Challenge WOT Condition Part-2
Q1. Difference between mapped and dynamic models of Generator, Motor and engine:
First, let us look at a dynamic engine model-
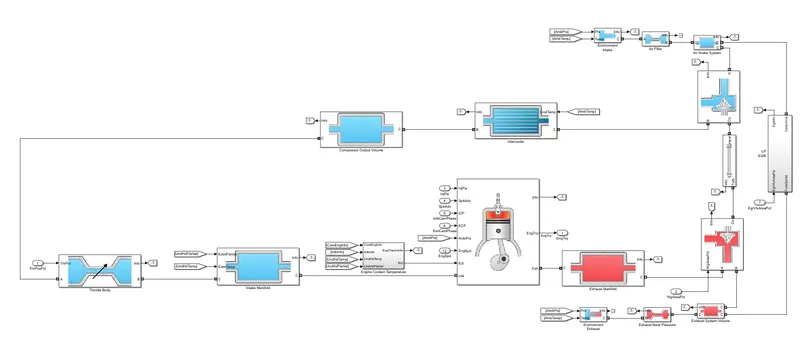
It can be observed that the engine is connected to different blocks such as throttle, coolants, exhaust of which the input,output values are calculated in real time continuosly. The accuracy of a dynamic model is higher but it takes more time for execution.
Now lets see the mapped engine-
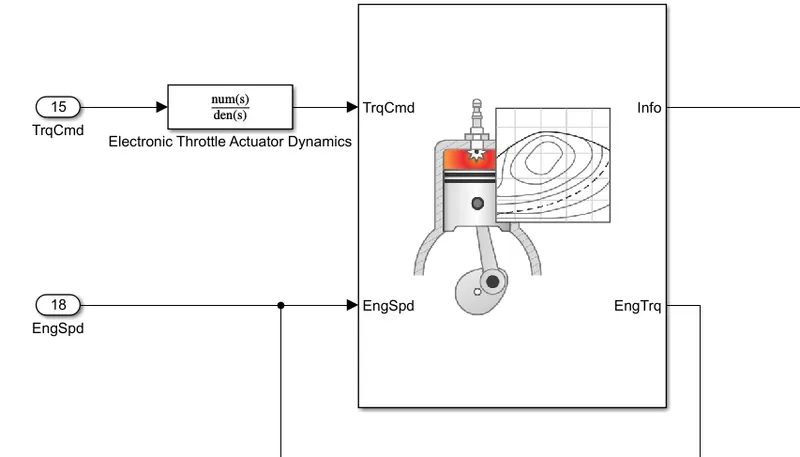
In the mapped engine, there are no blocks for throttle,coolants or exhaust connected but the outputs are based on various data maps that are fed to the block. Lets look at the different maps included
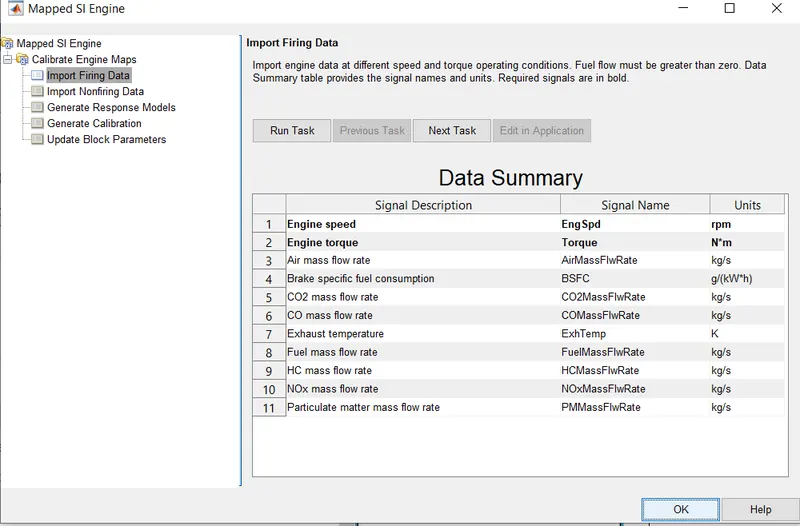
Based on these maps, the output is given without considering the current situation of various blocks. This model is useful when a quick study needs to be done but where the accuracy is compromised.
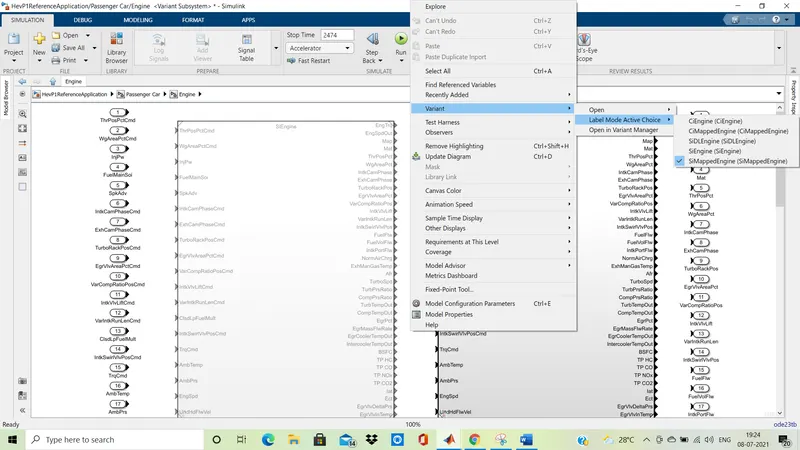
These models can be switched by following these steps:
1. Right click on screen to open menu and select Variant option.
2. In variant select Label mode active choice and make your selection.
The same differences apply for motor and generator models as well.
------------------------------------------------------------------------------------------------------------------------------------------
Q2. Miles per Gallon calculation :
The following model is used for miles per gallon calculations-
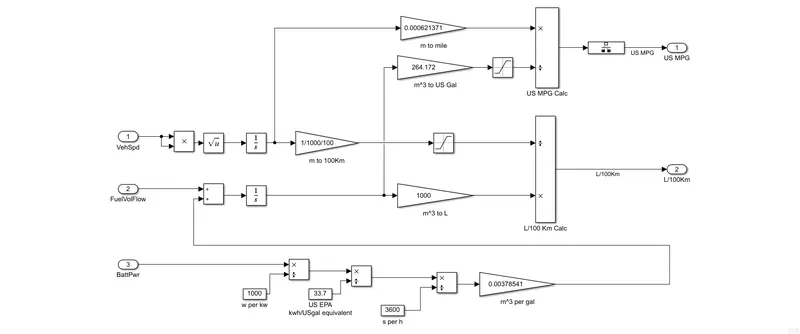
First the vehicle speed is converted to a positive value and then integrated to get the distance travelled in metres. Next its converted to miles and fed to US MPG Calc block.
On the other end, the battery power is converted to kw and then changed to US gal equivalent by dividing by 33.7. Next it is converted to kwsec/Usgal equivalent values and then multiplied by 0.00378541 to convert to m^3 per gal which is the volume of fuel equivalent. This is then added with actual fuel used(in case of HEV) and converted to US gal by multiplying by 264.172 and fed to US MPG Calc.
By dividing the miles by the US Gallon value we get the MPG value which is displayed. It is the mileage of the vehicle in terms of miles and gallons.
-----------------------------------------------------------------------------------------------------------------------------------------------
Q3. WOT Analysis of HEV Reference model-
Given below is the model for a Hybrid Electric Vehicle
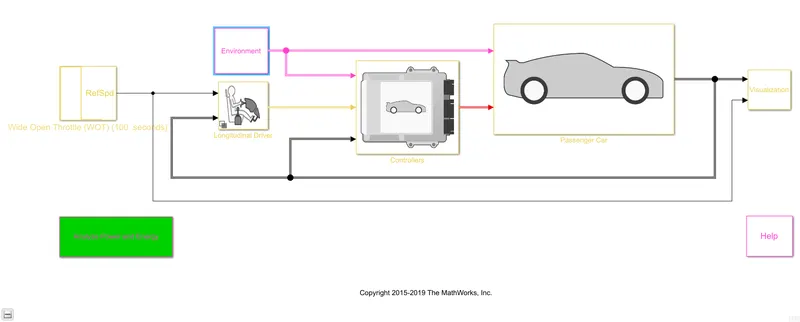
The different blocks used to simulate a HEV are:-
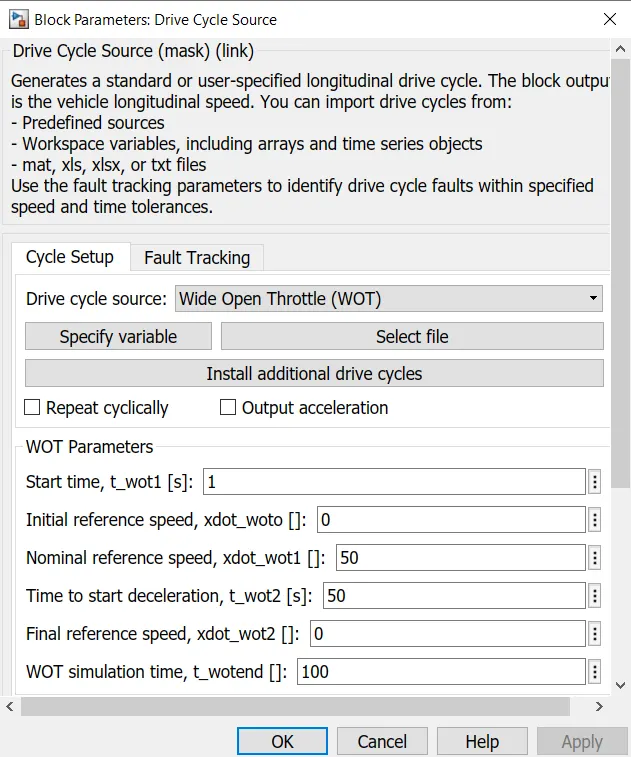
1. Drive Cycle:
We have fed a Wide Open Throttle (WOT) drive cycle with a top speed of 50m/s run for 50sec and then zero speed for next 50sec.
2. Environment:
This block includes various environmental factors such as temperature,pressure, air velocity and road grade.
3. Longitudinal Driver:
This block has two inputs, one from drive cycle and other is feedback speed. It tries to make car follow the drive cycle.
4. Controllers:
This block holds the brain of the HEV. It has the Engine Control Module(ECM), the Hybrid Control Module(HCM) and the Transmission Control Module(TCM). It takes inputs from environment, the driver and the feedback.
5. Passenger Car:
This consists of the engine, motor and drive train of the vehicle.
6. Visualization:
This block is used to plot the various outputs and to do MPG calculations.
Results:
The various plots achieved from visualization are as follows-
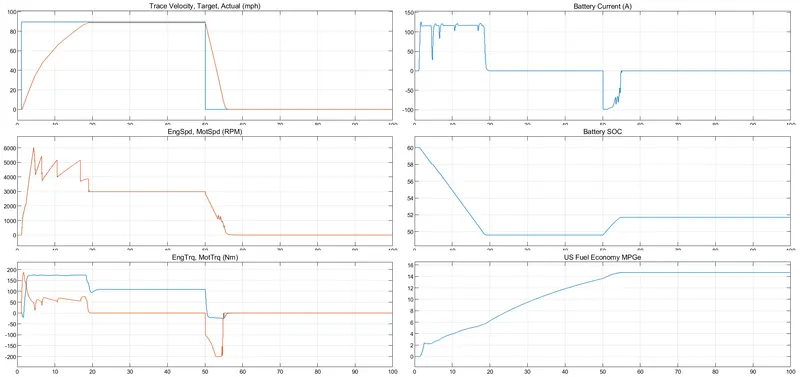
From the first graph we can see the drive cycle and the vehicle velocity. We see that it takes time to catch up the top speed due to battery current limit.
The second graph of battery current shows the negative current which is case of regenerative braking. We also notice that the positive peak is greater than the negative peak.
The third graph shows how engine and motor speed are coupled.
The fourth is of battery State of Charge(SOC) .We see the battery charge falling from 60% and falling to around 49% and then rising again due to charging by degenerative braking.
The fifth is of Engine and Motor Torque.
The sixth is of the Economy of the car.
Here are the key readings of the plots-
| Top Speed(mph) | 88.84 |
| Time for top speed(sec) | 19.372 |
| SOC at top speed | 49.59% |
| MPG | 14.69 |
Case 2:
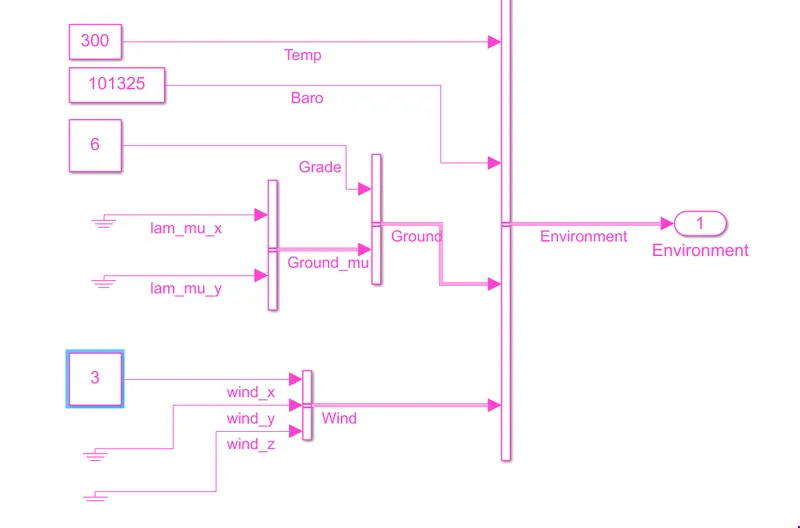
Changing the environmental factors as grade to 6 and the wind velocity to 3.
The results obtained are as follows-
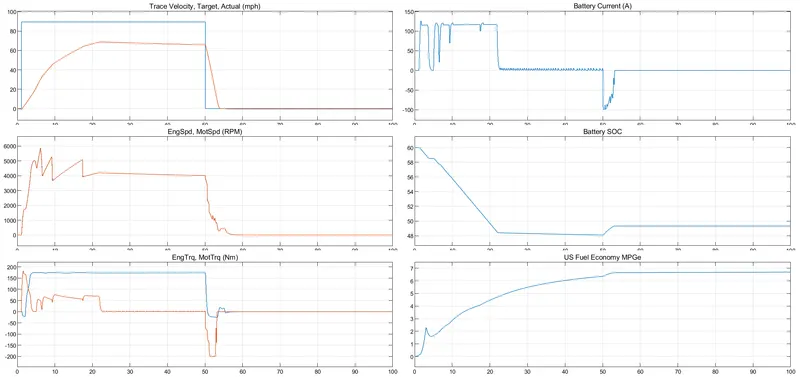
Key readings of the plot
| Top Speed(mph) | 68.8 |
| Time for top speed(sec) | 22.34 |
| SOC at top speed | 48.9% |
| MPG | 6.65 |
From these we notice how the grade of the road and the wind velocity can reduce the top speed of the vehicle and it takes more time to achieve it. The SOC change was just of 1%. But there was huge change in mileage, nearly got halved.
--------------------------------------------------------------------------------------------------------------------------------------------------------------
Q4. Comparison with pure EV under same conditions:
We simulated the EV reference model for same WOT analysis and with same grade and wind velocity.
The output recieved is as follows-
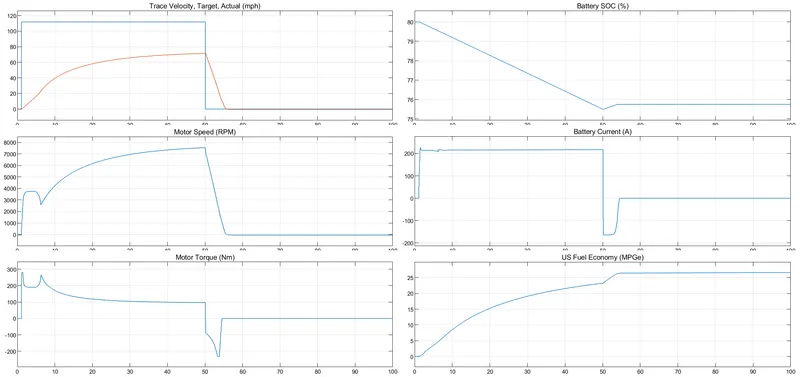
Lets compare the key values:
| HEV | EV | |
| Top Speed(mph) | 68.8 | 71.48 |
| Time for top speed(sec) | 22.34 | 49.86 |
| SOC at top speed | 48.9% | 75.52% |
| MPG | 6.65 | 26.45 |
The top speed has now increased by ~2.5mph but the time taken to achieve this has increased drastically,nearly a double. This is because of the battery current limit and the vehicle can't push beyond it. The SOC drop was about 12% in HEV but in EV it was about 5%. Lastly the MPG has increased 4 times for EV as electricity is cheaper than fuel.