Week 7 State of charge estimation
- Simulate the 3 test cases from harness dashboard and write a detailed report on the results.
- What is coulomb counting? Refer to the above model and explain how BMS implements coulomb counting for SOC estimation?
In the following dashboard of the given model, double click on the Test Sequence Variant block. Select the test case from the drop down box and run the simulation to analyze the results.
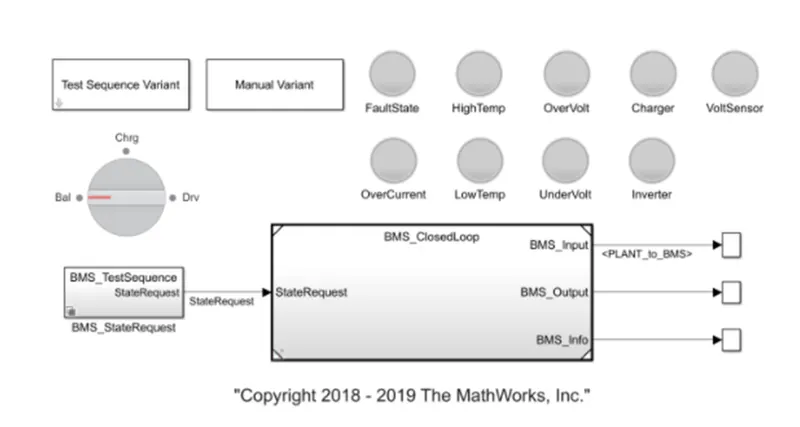
Test case 1:
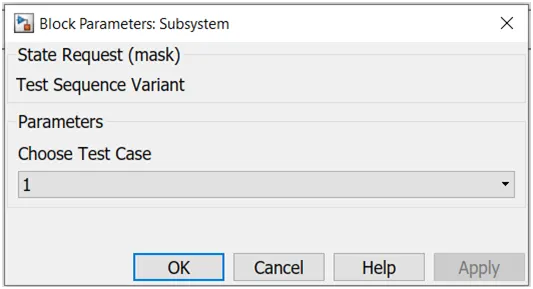
From the test sequence variant, select test case 1 and run the simulation.
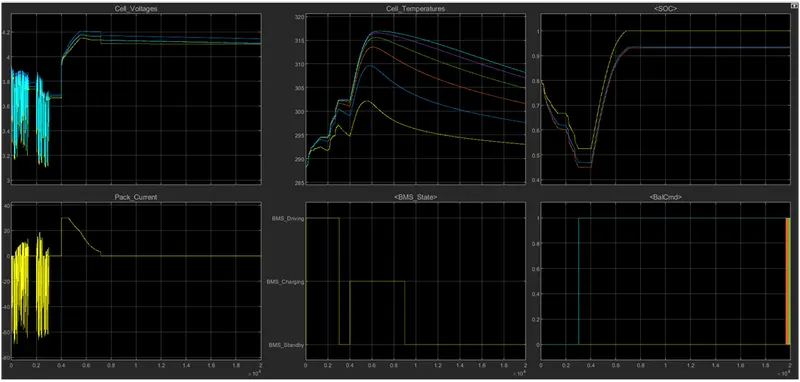
The above depicts the cell voltages, cell temperature, SOC, battery pack current, BMS state and Balance command during the test case 1 for time 20000 seconds.
BMS state (plot 5):
From the plot 5, we infer that the BMS is in driving state for 3000 seconds (t=0 to 3000 sec) and in charging state for 5000 seconds (t=4000 to 9000 sec). The BMS is stand-by during the remaining time of the duty cycle.
Balance Command (Plot 6):
The balance command is ON from t=3000 sec. Whenever the BMS mode, the cells are balanced by the algorithm i.e., during t=3000 to 4000 sec and t=9000 to 20000 sec the BMS is in Balancing mode.
|
Time (seconds) |
Duration (seconds) |
BMS state |
|
0 to 3000 |
3000 |
Driving |
|
3000 to 4000 |
1000 |
Stand-by / Balancing |
|
4000 to 9000 |
5000 |
Charging |
|
9000 to 20000 |
11000 |
Stand-by / Balancing |
Cell Voltage (Plot 1):
From the plot, it is clear that the cell voltage fluctuates between 3.1V to 3.9V during driving state. From t=3000 to 4000 seconds, the balancing mode, the battery cells get balanced and cell voltage maintained as ~3.7V till t=4000 seconds.
During the charging period, t=4000 to 5000 seconds, the cell voltage increases to maximum level of 4.2V. After t=5000 seconds, the cell is fully charged so the cell voltages is maintained constant as 4.1V
Pack Current (Plot 4):
From the plot, it is found that the pack current fluctuates between -60A to 20A during driving state. From t=3000 to 4000 seconds, the stand-by/balancing mode, the battery voltage get balanced and current is 0A till t=4000 seconds as there is no current consumed during stand-by mode.
During the charging period, t=4000 to 4200 seconds, the pack current is constant of 30A which implicates the battery is charged in constant current mode during that time. From t=4200 to 7000 sec, the current exponentially reduces which says the battery is charged in constant voltage mode. After t=7000 seconds, the cell is fully charged and current is 0A as there is no current consumed during stand-by mode.
Cell temperature (Plot 2):
The cell temperature increases gradually during the driving state as the battery is discharged. During the time of balancing, the temperature decreases a little bit.
By charging of battery, the temperature increases abruptly as charging current is high. Once the battery is fully charged, the temperature follows decreasing pattern as the pack current is 0A.
SOC (Plot 3):
At the start of the cycle, the SOC is 80% and gradually reduced to 50% during driving cycle as the battery is getting discharged. The SOC is remains constant during the stand-by period. The SOC is increasing slowly during the charging state and reaches 100% at t=7000 sec and remains constant throughout the rest of the stand-by period of the battery.
Test case 2:
From the test sequence variant, select test case 2 and run the simulation.
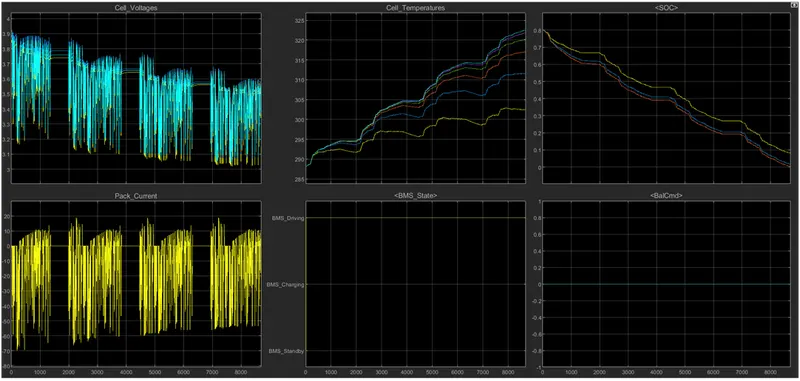
The above depicts the cell voltages, cell temperature, SOC, battery pack current, BMS state and Balance command during the test case 2 for time 9000 seconds.
BMS state (plot 5):
From the plot 5, we infer that the BMS is in driving state for entire 9000 seconds of the duty cycle.
Balance Command (Plot 6):
The balance command is OFF from for whole 9000 seconds of the duty cycle.
|
Time (seconds) |
Duration (seconds) |
BMS state |
|
0 to 9000 |
9000 |
Driving |
Cell Voltage (Plot 1):
From the plot, it is clear that the cell voltage fluctuates and shows a decreasing pattern. The voltage reduced to 3.1V at end of cycle. The Voltage curve follows a reducing pattern because the battery pack is discharged continuously during the driving cycle.
Pack Current (Plot 4):
From the plot, it is found that the pack current fluctuates between -70A to 10A. The curve shows most of the current is in negative range because the Battery is discharging the whole time and not charged at all.
Cell temperature (Plot 2):
The cell temperature increases gradually during the entire cycle because the battery is discharged and pack current is fluctuating during driving state.
SOC (Plot 3):
At the start of the cycle, the SOC is 80% and gradually reduced to 0% during driving cycle. The battery is getting discharged during the driving cycle. After the SOC hits 0% i.e., the battery is completely drained or discharged, it can’t any further duty cycles without charging.
Test case 3:
From the test sequence variant, select test case 3 and run the simulation.
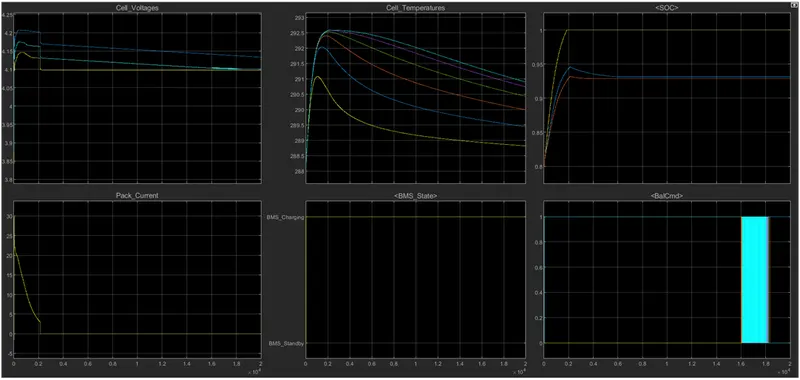
The above depicts the cell voltages, cell temperature, SOC, battery pack current, BMS state and Balance command during the test case 3 for time 20000 seconds.
BMS state (plot 5):
From the plot 5, we infer that the BMS is in charging state for entire 20000 seconds of the duty cycle.
|
Time (seconds) |
Duration (seconds) |
BMS state |
|
0 to 20000 |
20000 |
Charging |
Cell Voltage (Plot 1):
From the plot, it is clear that the cell voltage increases till t=2000 sec and remains almost constant throughout the rest of the cycle. The Voltage curve follows an increasing and constant pattern because the battery pack is charged continuously during the driving cycle.
Pack Current (Plot 4):
During t=0 to 2000 seconds, the pack current is decreases from30A which implicates the battery is charged in constant voltage mode during that time. After t=2000 seconds, the cell is fully charged and current is 0A as there is no current consumed during stand-by mode
Cell temperature (Plot 2):
The cell temperature increases gradually till t=2000 seconds, as charging current flows in the battery. After t=2000 sec, the battery is completely charged, the pack current is 0A, temperature curve follows decreasing pattern.
SOC (Plot 3):
At the start of the cycle, the SOC is 80% and gradually increased to 100% during charging. After the SOC hits 100% i.e., the battery is completely charged, it SOC won’t be increased further.
COULOMB COUNTING:
State of Charge:
The state of charge is the measurement of the charge available in the battery pack at the time. The range of SOC varies from 0% to 100%. The 100% SOC indicates the batter pack is completely charged and 0% SOC shows the battery pack is completely discharged or drained.
The State of Charge can be determined indirectly by one of the following five methods
- Chemical
- Voltage
- Current integration
- Kalman filtering
- Pressure
Coulomb counting is one of the methods to estimate the state of the charge by measuring the current entering or leaving the battery pack. The current entering and leaving the battery pack is measured by a current sensor. During charging, the current enters the battery pack from charger and current measured is in negative. During discharging, the current leaves from the battery pack to the electrical load connected and the current measured is in positive.
Once the battery is completely charged, the State of charge will set to 100%. The current consumed by the electrical load after charging, are measured by the current sensor and integrates over period of time. The remaining charge in the battery can be estimated by subtracting the current consumed till that time.
SOC is calculated by the following equation:
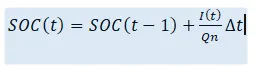
By coulomb counting, the SOC can be estimated from the discharging/discharging current and previously estimated SOC values.
The implementation of SOC estimation in the given model is achieved by following methods.
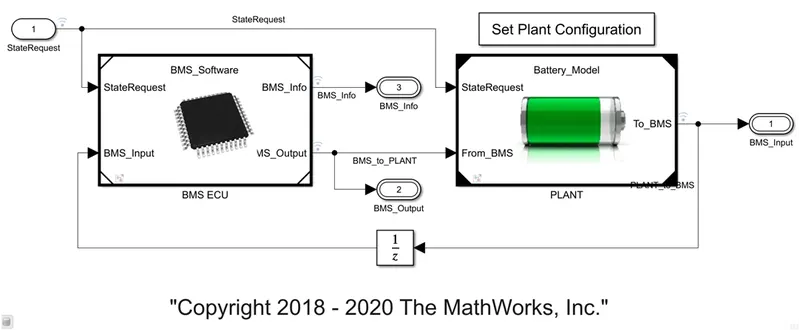
Select the BMS ECU to explore the blocks inside the Battery Management System. In the battery management system, there are three major blocks available.
- State machine
- SOC estimation
- Balancing logic
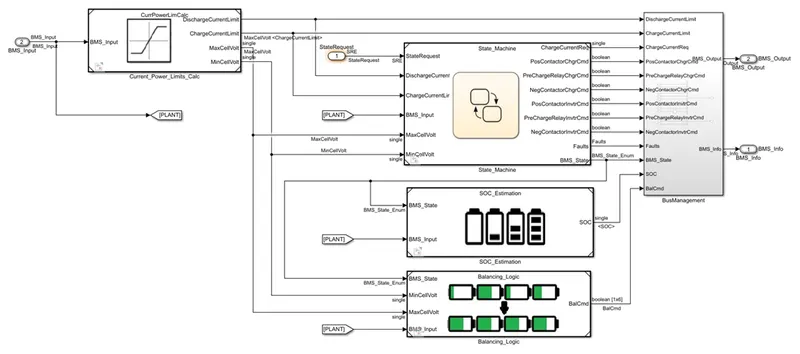
As our goal is focused on the SOC estimation by coulomb counting, double click on the SOC estimation block.
Inside the SOC estimation block, the following circuit is formulated which contains various methods to calculate the SOC of the battery. The highlighted block is the coulomb counting methodology of SOC estimation.
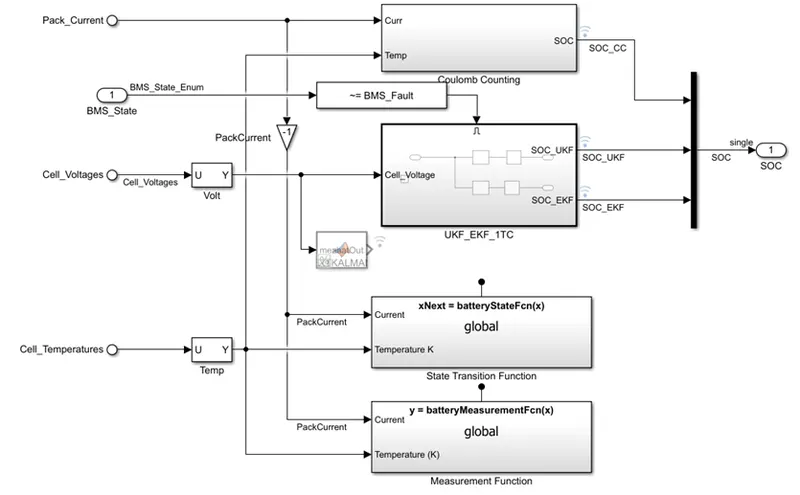
For the coulomb counting block, the input signals required are pack current A and cell temperature. Inside the coulomb counting block, the circuit is present is shown below.
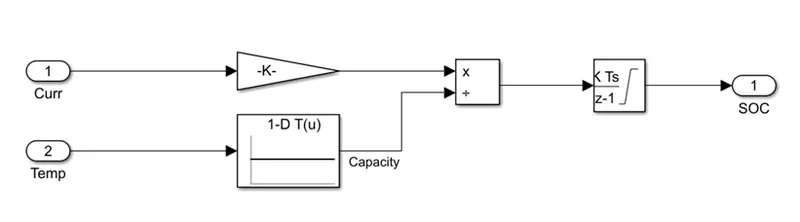
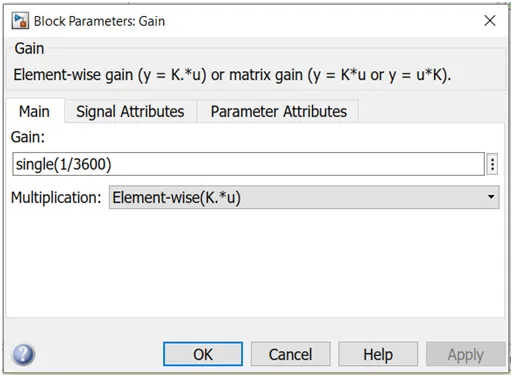
Current signal is connected to a gain block. The gain is single function of 1/3600. The 1/3600 is formulated to convert seconds into hours. Therefore the output from the Gain block will be Ampere-Hour.
The temperature signal is given as input to capacity look up table. Based on the input temperature signal, the output will be selected from the capacity look up table. Therefore the output of the look up table block is Capacity (Ah).
The processed current and temperature signal are given into multiply and divide block and the signal is integrated to calculate the charge and estimate the SOC
The integration block uses the Forward Euler integration method.

In this case, the gain K=1. Hence at sampling the current discharged is converted into capacity and added the previous value. During discharge the current measured will be negative, therefore while adding to the previous state SOC, the SOC decreases during discharging and vice versa.
By this way SOC is estimated by coulomb counting.