Week 7 State of charge estimation
AIM:
- Simulate the 3 tests cases from harness dashboard and write a detailed report on the results.
- What is coulomb counting? Refer to the above model and explain how BMS implements coulomb counting for SOC estimation?
Hint: (Download the file from the link and go to SOC estimation model –ECU block)
https://in.mathworks.com/matlabcentral/fileexchange/72865-design-and-test-lithium-ion-battery-management-algorithms
- Simulate the 3 tests cases from harness dashboard and write a detailed report on the results.
The harness dashboard is shown below where 3 test cases are simulated to find out the fault conditions in BMS like over voltage, under voltage, high temperature, over current and inverter elated faults. If the indicators in the dashboard indicate red color it shows fault condition and if it shows green it shows that there are no faults and the system is safe.
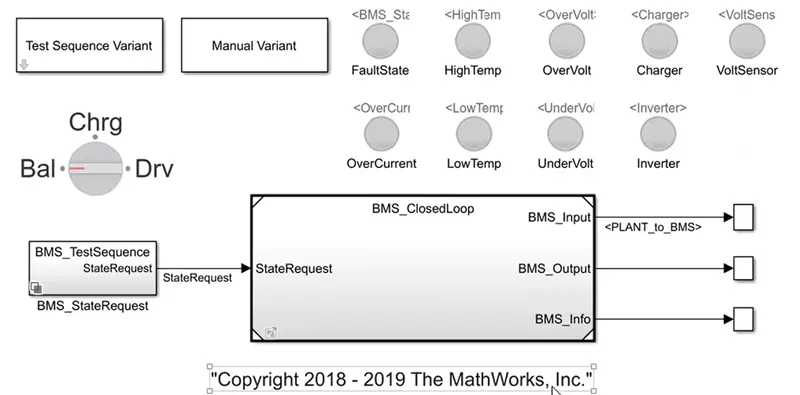
At any instant we get the information of the battery pack as discharging mode, charging mode and discharging mode.
TEST CASE -1 (Discharging, charging and balancing / At BMS level test condition for both driving and charging )
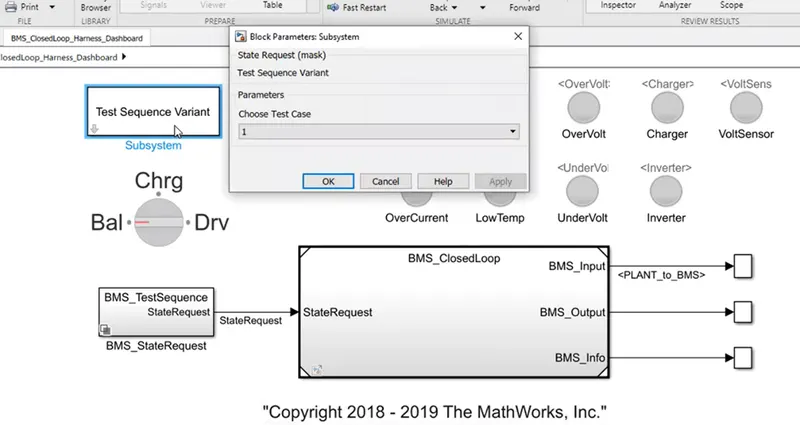
When we click on the BMS _ State request the following system opens up and have to now select the BMS_ test sequence
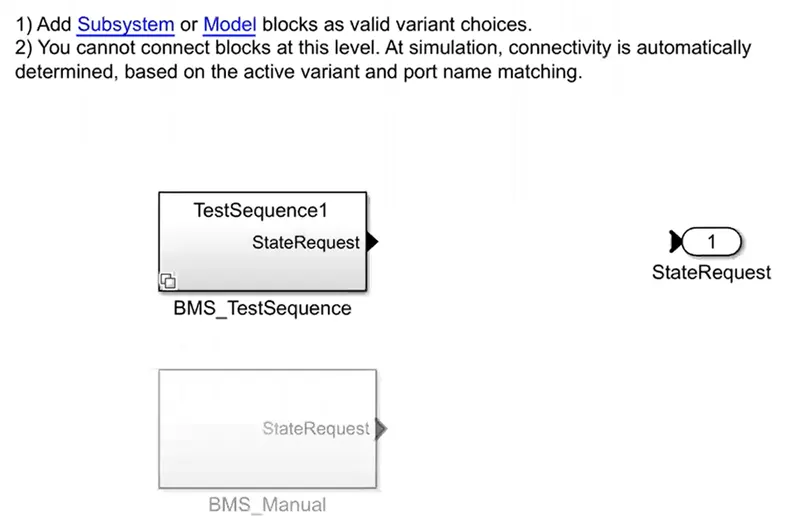
Selecting the first test sequence we can check the conditions for this particular test
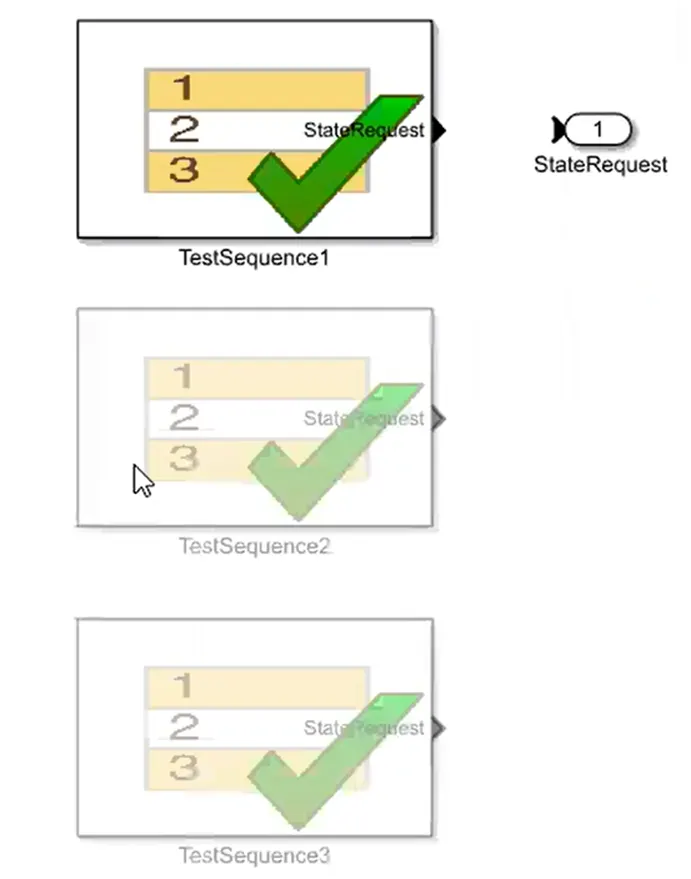
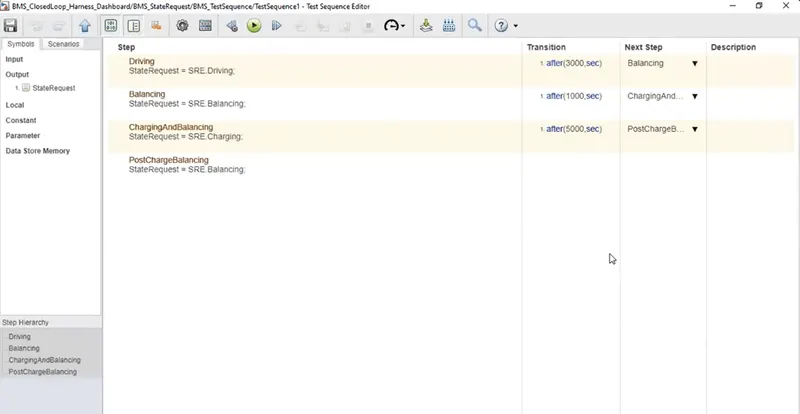
This test cases comprises of three stages:
- Discharging
- Balancing
- Charging
The algorithm implemented for the first test case is driving for 3000 seconds then balancing for 1000 seconds and then charging and balancing for 5000 seconds. Post – charge balancing is carried out till the simulation is completed.
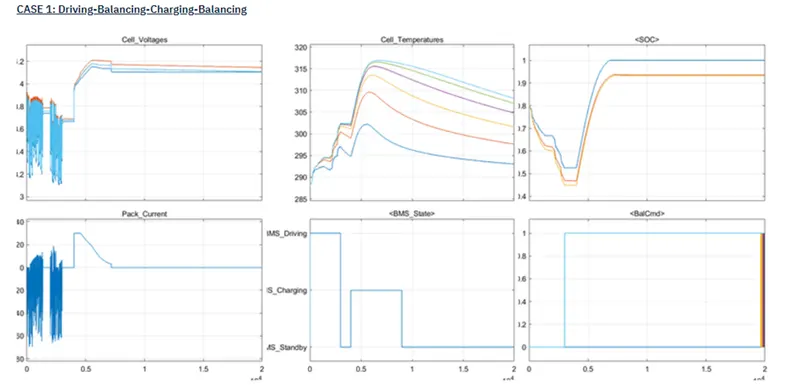
- Cell voltage - It was observed that the cell voltage of all the cells of the battery fluctuate at the beginning of the simulation this is because we initialize the model with a slight imbalance as voltages were fluctuating from 3.1 to 3.9 V for a period of 3000 seconds. The voltage of all the respective cells were balanced and then there was a sudden increase in voltage till they reached 4.2 volts. Towards the end of the simulation there was a small difference in voltage between 4 to 4.2 volt as the system went on standby mode.
- Pack current - Initially the current is deflecting from the range of 19A to -70 A for 3000 seconds. During charging the battery pack voltage was increased to 4.2V.
- Cell temperature - The cell temperature increases gradually during driving and charging and falls during standby mode. The temperature difference at cell number 6 is at its higher temperature and will be subjected to much faster degradation as compared to cell number 1 which leads to unevenness in cell condition. So there is a need for an active thermal management system to keep thermal differences within a few degree Celsius.
- 0.C - The graph shows the S.O.C of three different battery cells each performed with different matter. Yellow indicates column counting blue corresponds to ukf and orange to ekf. Initially the S.O.C was 75% but drops to less than 50% after the driving cycle and is put for charging until the S.O.C reaches 100%.
- BMS STATE - It is observed from the graph that the driving time is from 0 to 3000 seconds, the charging time is from 4000 to 9000 seconds and the standby time is from 9000 to 20000 seconds.
- Balancing command – The balancing command of all the six cells are shown here. All cells have a magnitude of 1 whereas the first cell has a magnitude of zero. The cell balancing occurs during charging.
TEST CASE 2 : DISCHARGING AND NO BALANCING / AT BMS LEVEL TEST CONDITION FOR DRIVING
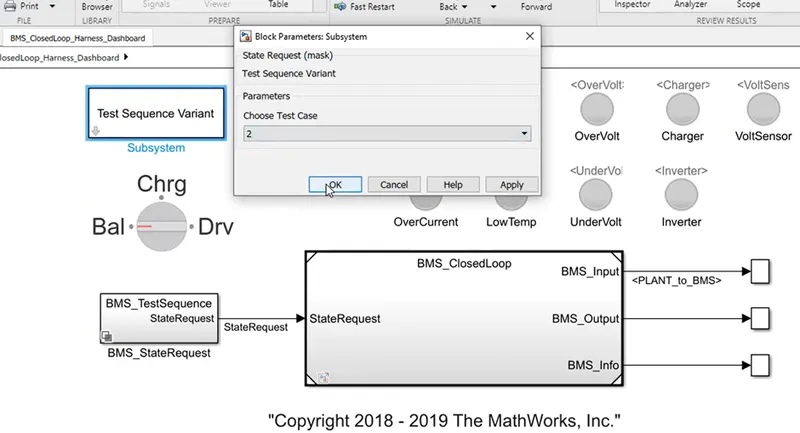
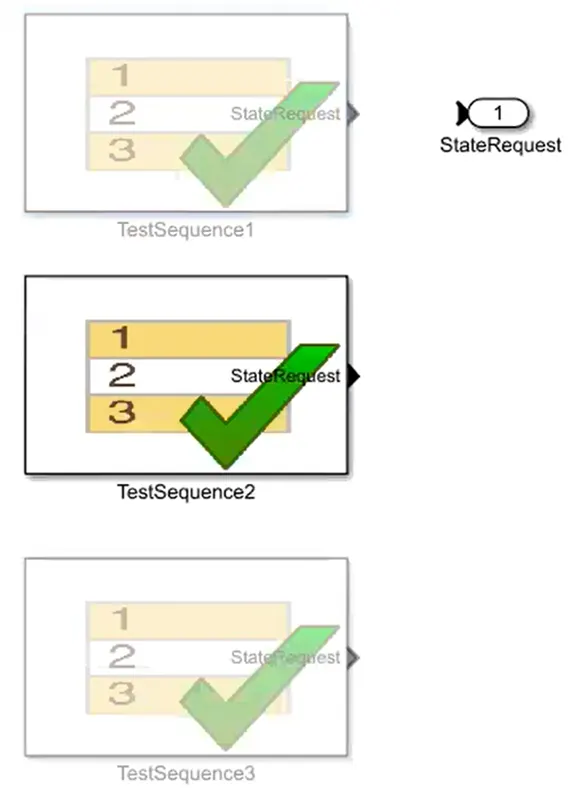
When we click on the BMS _ State request the following system opens up and have to now select the BMS_ test sequence
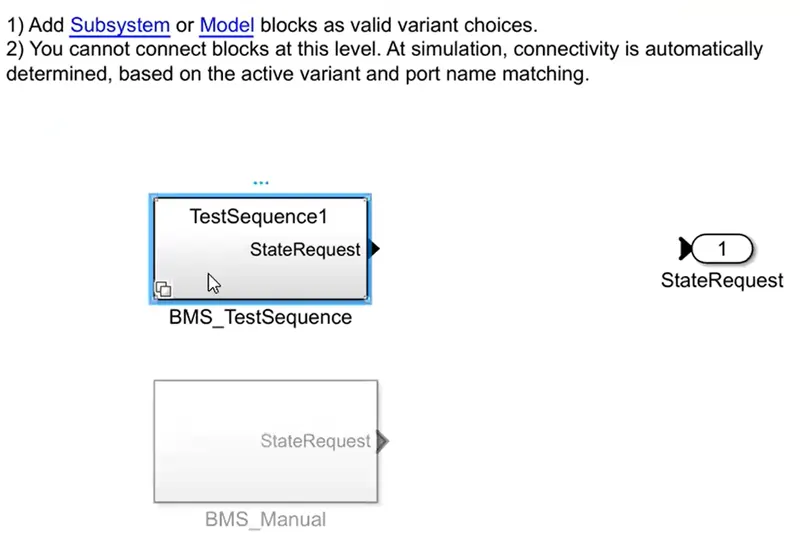
Selecting the second test sequence we can check the conditions for this particular test
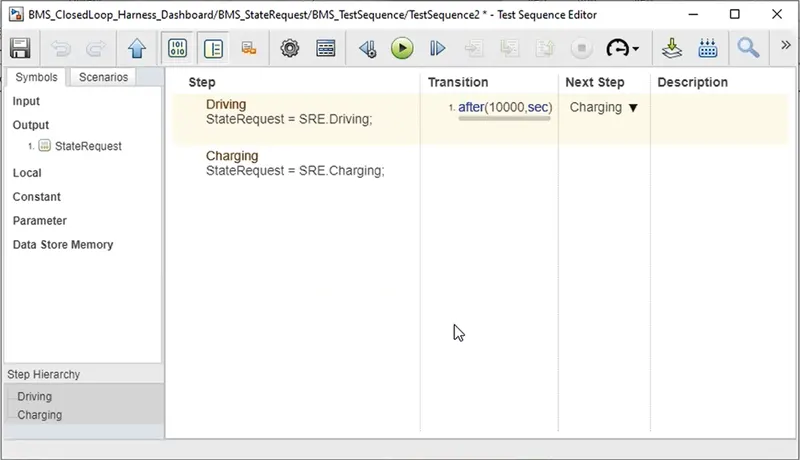
This test case comprises of two stages:
- Driving
- Charging
The algorithm implemented for the second test case is that it is driving for 1000 seconds and after 1000 seconds it is left for charging.
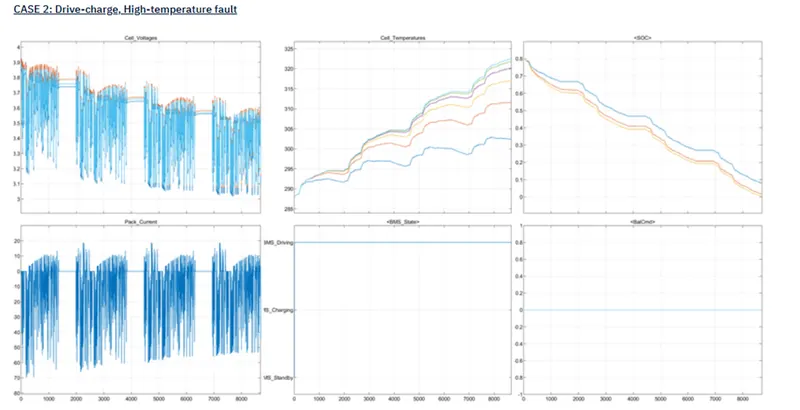
- Cell voltage: the cells of the battery fluctuate from 3.0 to 3.9. The cut off voltage of the individual cells is 3V.
- Pack current – battery pack discharges current for 8692 seconds. It can be inferred from the graph that the battery pack lasts for 8692 seconds on a single charge. Hence there is no charging or standby mode. The electric vehicle continues to run until the battery pack is entirely depleted.
- Cell temperature – The temperature of cells continue to rise as there is constant discharge of current.
- BMS STATE - BMS enters driving mode until the battery pack SOC is depleted.
- O.C – S.O.C continues to fall until it reaches 0% as the battery pack has not been charged or in standby mode.
- Balancing command – Cell balancing is not performed while charging as these cells have been discharged evenly till they are shut off. Hence there is no cell balancing signal.
TEST CASE 3 : CHARGING AND BALANCING / AT BMS LEVEL TEST CONDITION FOR CHARGING
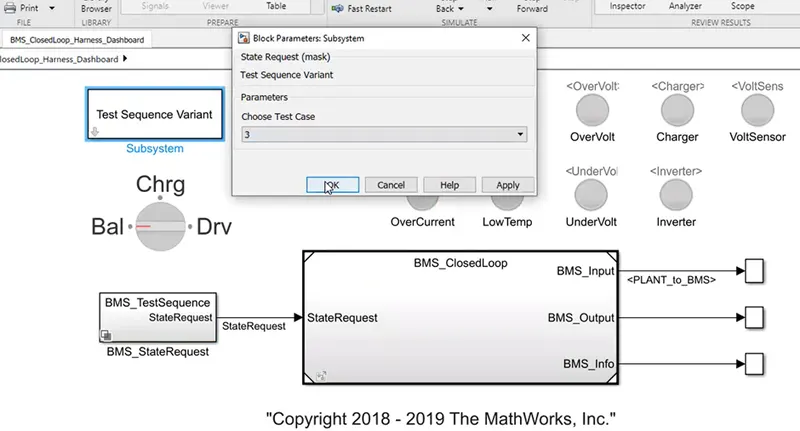
When we click on the BMS _ State request the following system opens up and have to now select the BMS_ test sequence
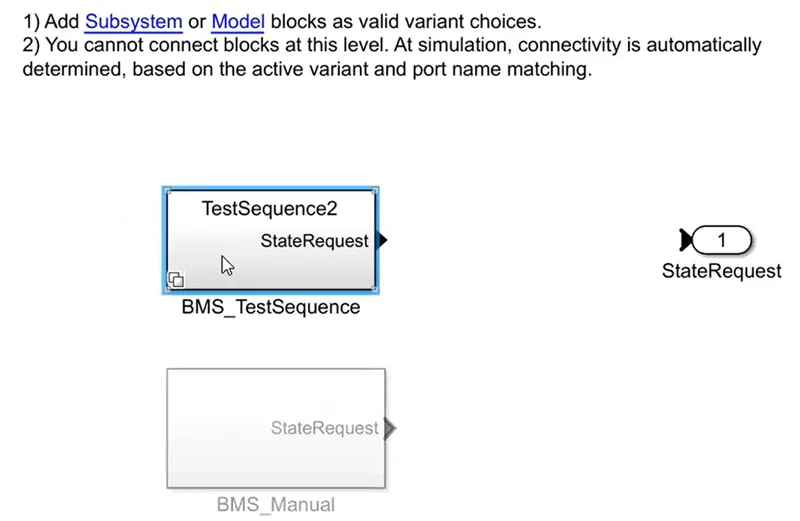
Selecting the third test sequence we can check the conditions for this particular test
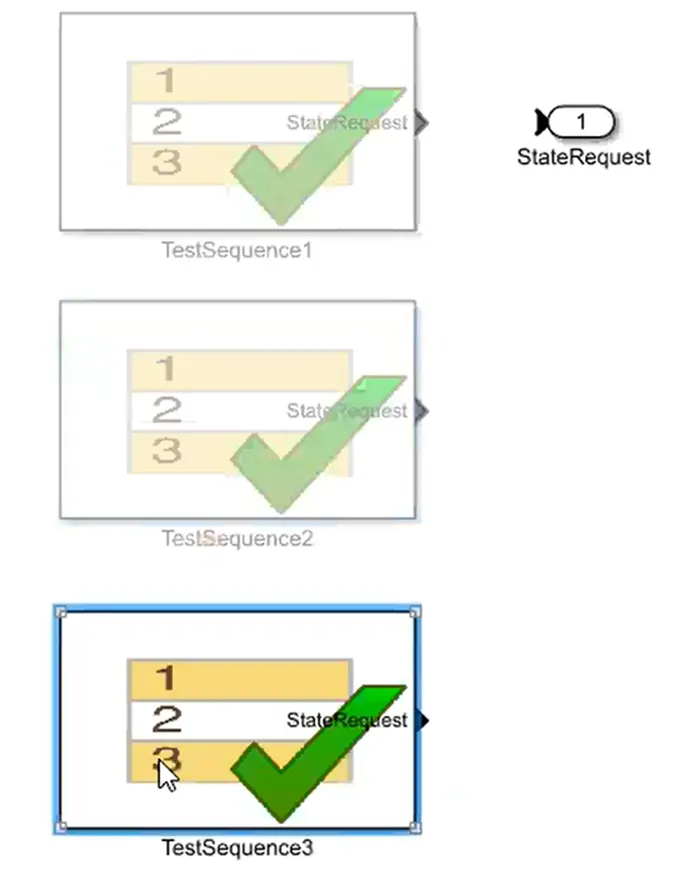
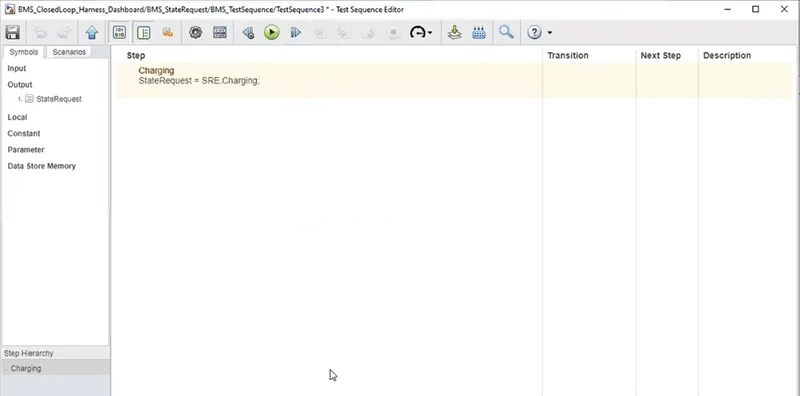
This test cases comprises of one stages:
- Charging
The algorithm implemented for the third test case is charging.
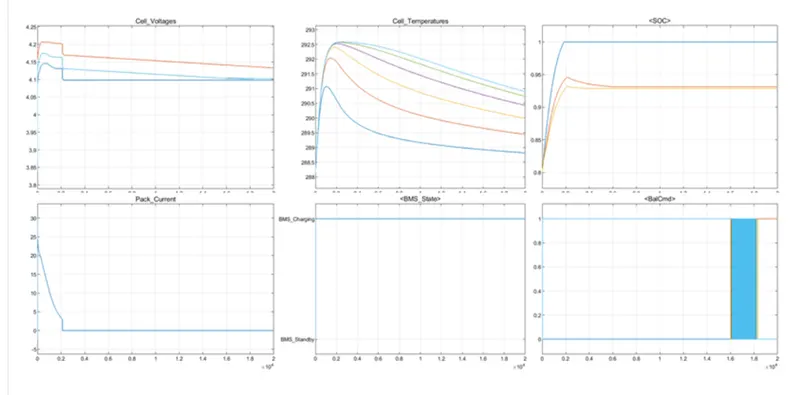
- Cell voltage - The fully charged voltage for the cells ranges between 4.1 to 4.2V.
- Pack current- The pack current which is at 30A decreases to 0. The current is limited by the contactors. After being fully charged the battery can no longer take current.
- BMS state – The charging condition is maintained throughout the simulation and there is no standby or driving state.
- Cell temperature – Initially the temperature of the cells were very high due to initial charging current but they quickly stabilized due to the contactors.
- O.C – The SOC is initially at 80% and then the pack was fully charged.
- Balancing command – The active balancing command was done whereby the highest energy cell transferred energy to the lowest cell. In this case from sixth to the first cell which is evident from the cell temperature graph.
2. What is coulomb counting? Refer to the above model and explain how BMS implements coulomb counting for SOC estimation?
In today’s world lithium ion batteries have proved to be a battery of interest among electric vehicle manufactures because of high charge density and low weight. It must be kept in mind that these batteries should never be over charged or under discharged at any circumstance which accounts for the voltage and current to be monitored. This process gets tougher as there are many number of cells that are put together to form a battery pack in an electric vehicle where each and every cell is monitored for its safety and efficient operation requires a system known as battery management system. To obtain maximum efficiency from the battery pack the cells must be charged and discharged at the same time which is again monitored by the battery management system.
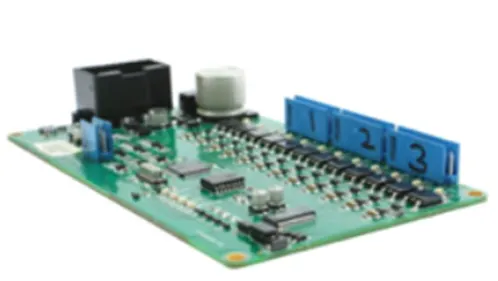
Battery management system is designed in such a way so as to monitor the parameters associated with battery pack and its individual cells, apply collected data to reduce the risk and increase the battery performance.
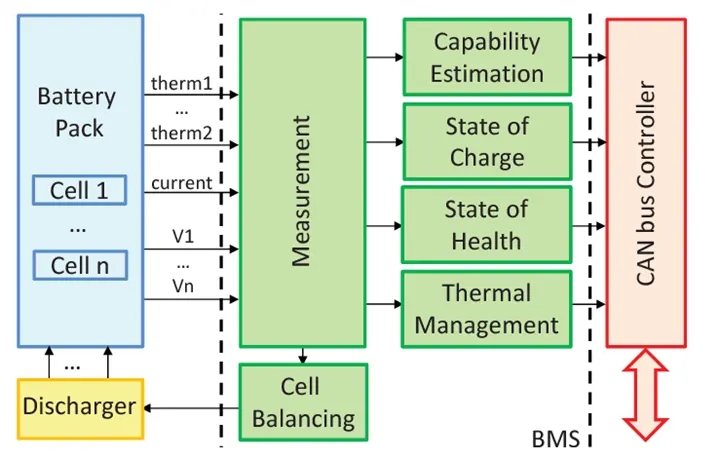
The above flow chart gives information of the battery management system working in synchronous with the battery pack. The inputs which are given to BMS from the battery pack are current, voltage and temperature. Based on the inputs which are fed to the battery pack the battery management system will give outputs such as SOC, SOH, Thermal management and capability of total battery pack. The outputs of the BMS are given to the CAN bus controller to communicate with the dashboard of the vehicle. Cell balancing is done to make sure that the maximum battery pack is fully utilized while charging and discharging.
COLOUMB COUNTING
Coulomb counting method measures the discharging current of the battery and the discharge current is integrated over time in order to estimate the SOC. Coulomb counting method is done to estimate SOC (t), which is estimated from the discharging current I(t) and previously estimated SOC values, SOC(t-1).
SOC is calculated by the following formula:
SOC (t) = SOC (t-1) + I (t) △ t
Qn
There may be several factor that effect the accuracy of coulomb counting method which includes temperature, discharge current and life cycle.
MODIFIED COULOUMB COUNTING
This a new a counting technique which uses corrected current to improve the accuracy of estimation. The corrected current is a function of the discharging current there is a quadratic relationship between corrected current and discharging current of battery.
Corrected current is calculated by the following formula:
Ic = K2 I(t)2 + K1 I(t) + Ko
Where K2 , K1 and Ko are constant values obtained from practice experimental data . In modified coloumb counting method SOC is calculated by the following equation
SOC (t) = SOC (t-1) + Ic △ t
Qn
The experimental results show the accuracy of modified coloumb method is better as compared conventional coloumb counting method.
FLOW CHART FOR COLOUMB COUNTING
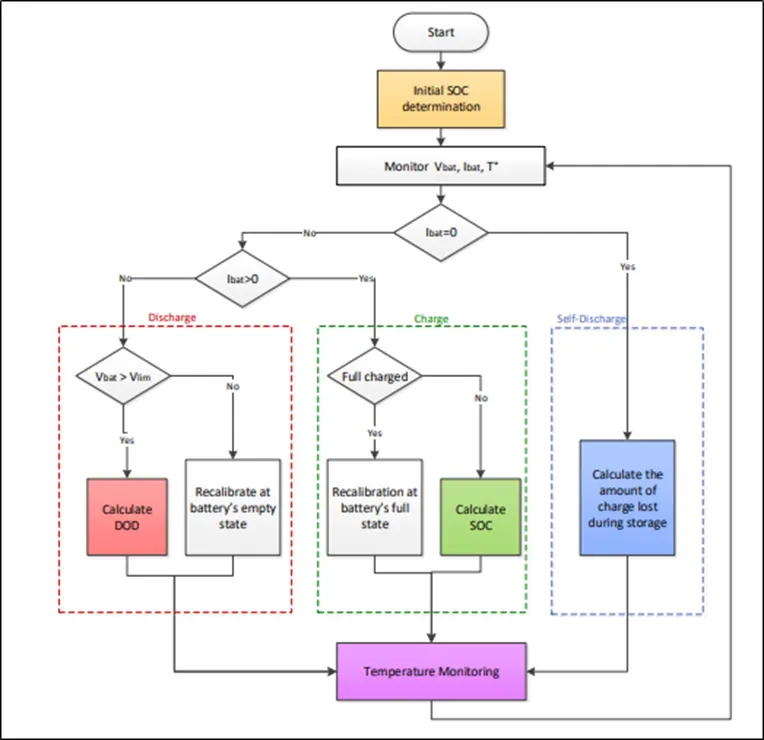
BMS IMPLEMENTS COLOUMB COUNTING FOR SOC ESTIMATIONS
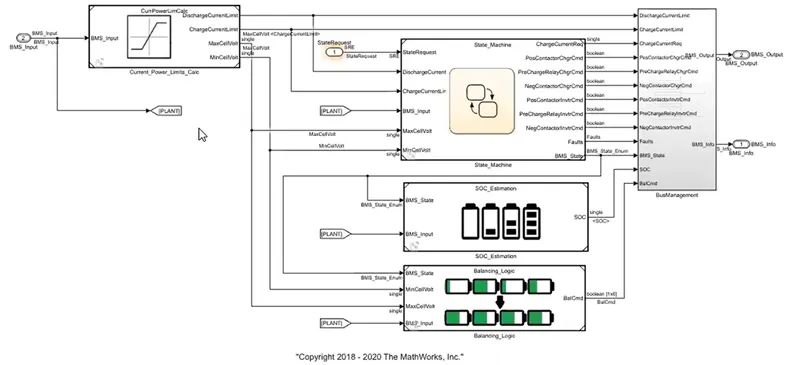
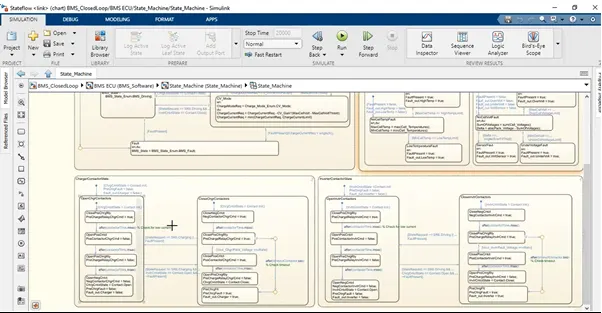
The BMS model consists of BMS electrical control unit and a plant. The control unit has various monitoring and control algorithms which is connected to a block with a representation of the battery pack and associated peripherals. BMS represents the software and controls the part of the model that shows how cell balancing is done, SOC estimated and response to different states by state flow.
The output from the plant is given as input to the BMS ECU. The BMS output commands are given as input to plant unit.
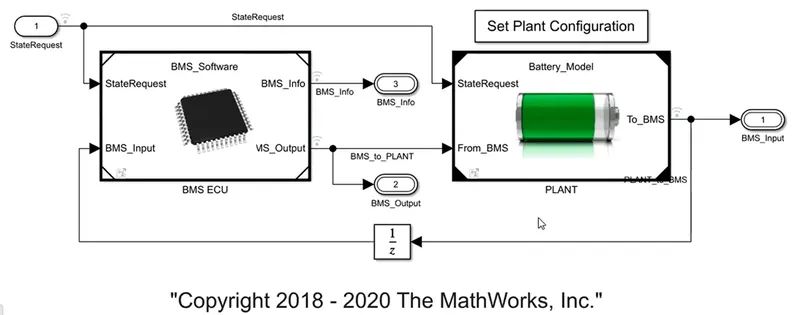
BMS is modelled inside from the subsystem of BMS ECU
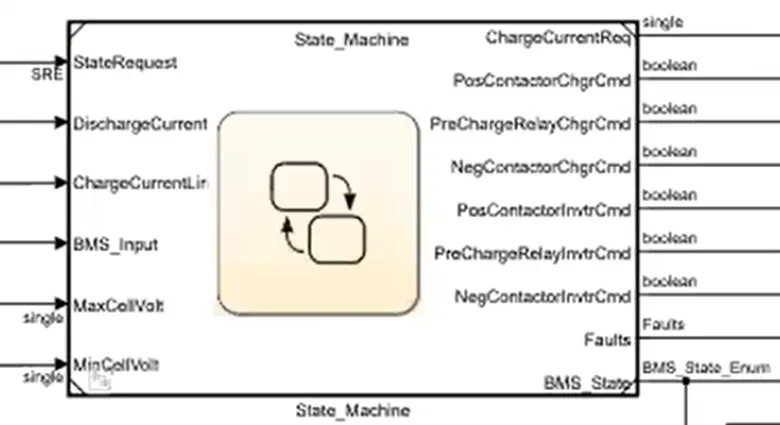
The chart below gives six control commands that control the six contactors for the charger and inverter. It also depicts two additional flags that indicate any fault detected during contactor control operation.
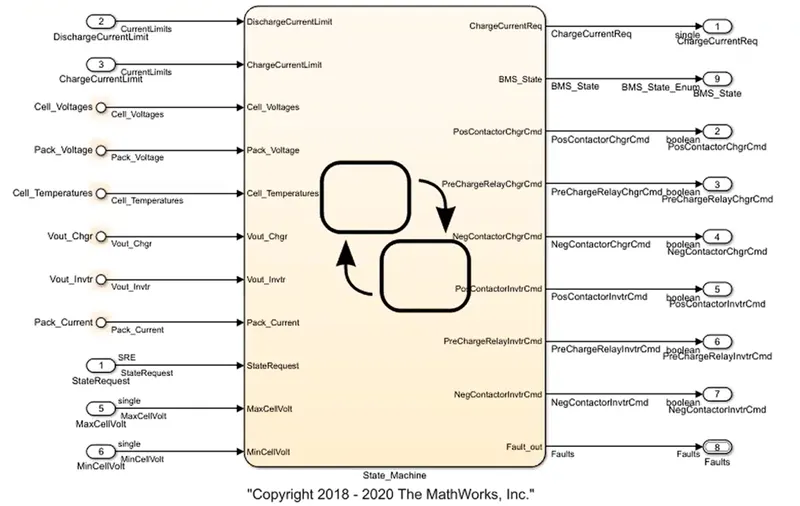
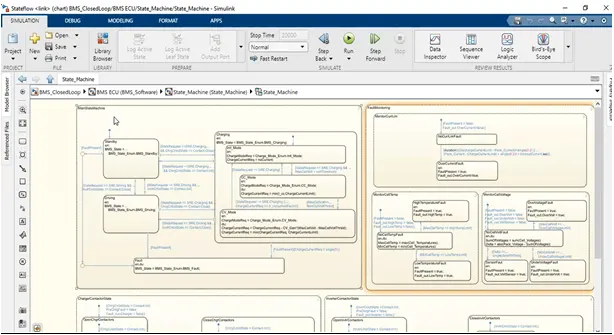
The state machines defines the main operating state of BMS. The state machine has four parallel states which means that all the state can be active at the same time.
- The first state defines the variable BMS state which indicates standby, driving, charging and fault. Charging includes constant current and constant voltage stage.
- In case the current, voltage or temperature value reaches an unsafe level the second state switches the fault state on.
- The third and fourth state defines the contactor ON and OFF switching sequence for charger and inverter. This is done so as to avoid large amount of current during charging.
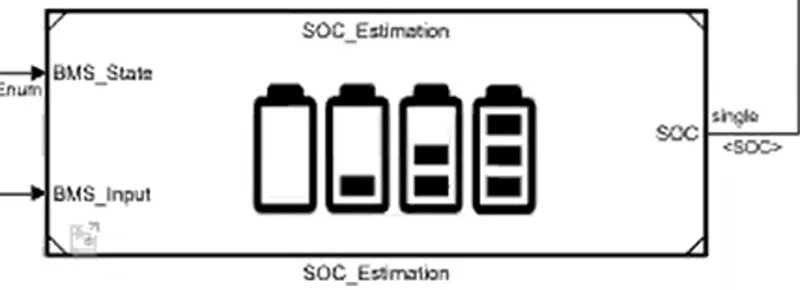
By clicking on the SOC estimation block we get, a subsystem as shown below:
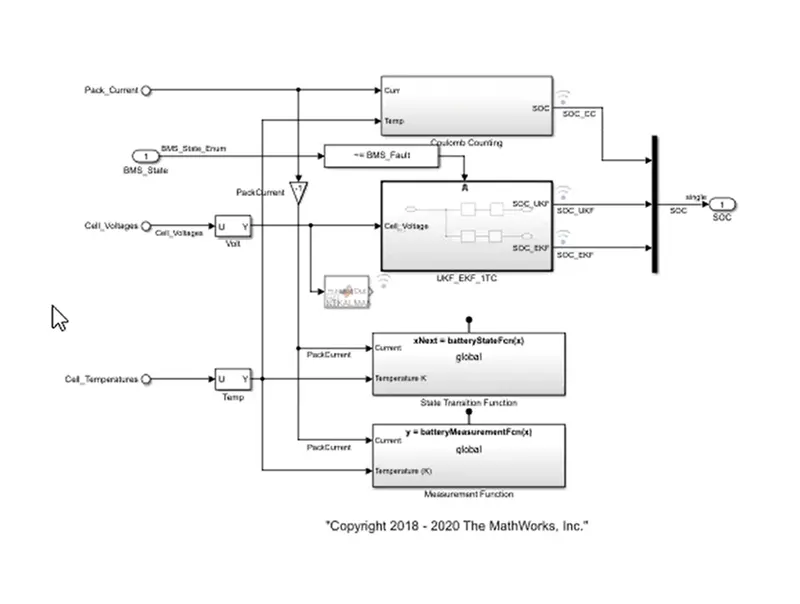
The estimation of coloumb counting is done by the equations mentioned above. Coloumb counting is simple and has low computational costs. Temperature and current are taken from the battery.
Current signal is given to the gain block and the temperature is given to the capacity as it varies according to the temperature. Current and temperature signals are given to integration where current will be integrated with respect to time. The output is divided by capacity and SOC is estimated.
There are three different states of charge estimation as shown in the SOC estimation block as shown below:
- Coulomb counting
- Unscented kalman filter (UKF)
- Extended kalman filter ( EKF)
Each charge estimation has its own benefits and drawbacks
Coloumb counting - Coulomb counting method measures the discharging current of the battery and the discharge current is integrated over time in order to estimate the SOC. Coulomb counting method is done to estimate SOC (t), which is estimated from the discharging current I(t) and previously estimated SOC values, SOC(t-1).
Unscented kalman filter (UKF) – the kalman filter method is known to provide verifiable SOC of the battery via the real time state estimation . UKF is superior to EKF the adaptive adjustment of the noise co variance in the SOC estimations process implemented by an idea of co variance matching the UKF context.
Extended kalman filter – The extended kalman filter estimates the concentration of chemical species that are averaged on thickness of the active material in order to obtain the SOC of the battery by using terminal current and voltage measurements.
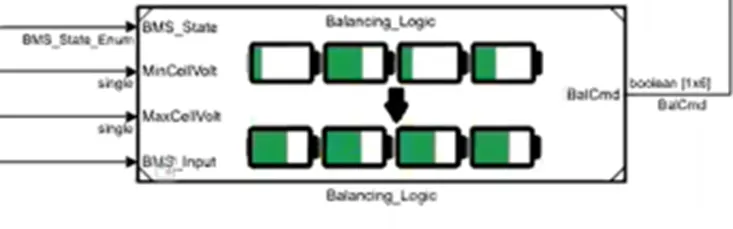
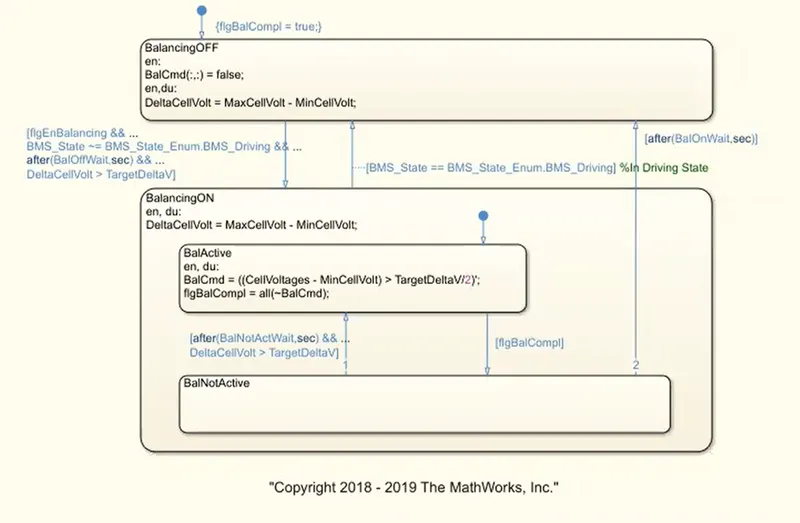
Inside the balancing logic we observe the balancing block where active or passive cell balancing takes place
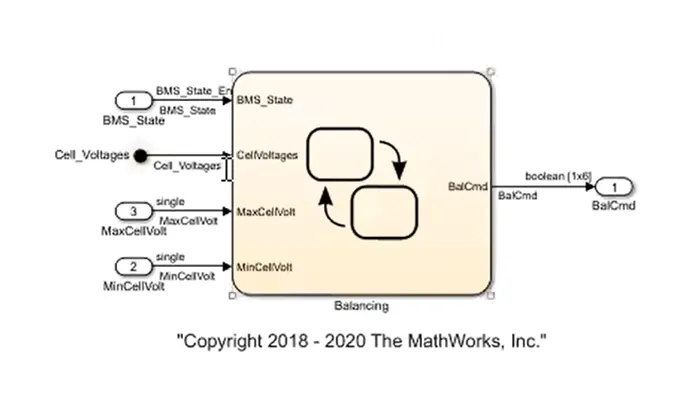
CELL BALANCING SYSTEM
Cell balancing system continuously monitors and measures the voltage difference between battery cells and when the vehicle is not in driving state the difference between the cell voltages increases beyond a certain value balancing takes place.
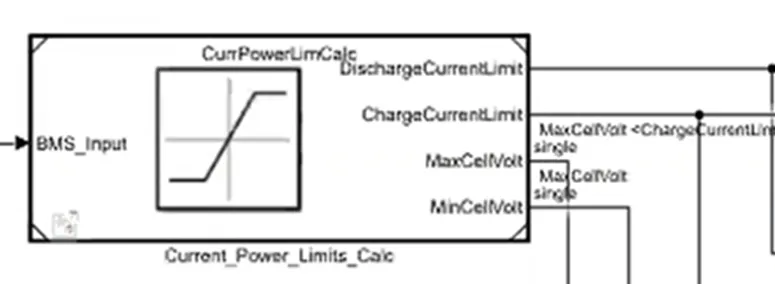
By clicking on the current power limit calculation block we get the below block diagram:
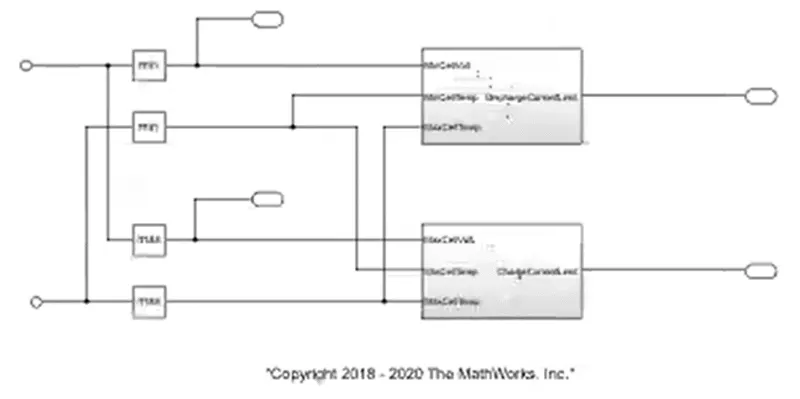
CHARGE AND DISCHARGE CURRENT LIMIT CALACULATION
- The charge and discharge calculation is a part of the fault management and protection function performed by the BMS to restrict the operation within safe working limits.
- The voltage level of cells is given as input from which the minimum voltage is used to find the maximum discharge current of the battery. Also the maximum voltage of the cell is used to find the maximum charging current of the battery.
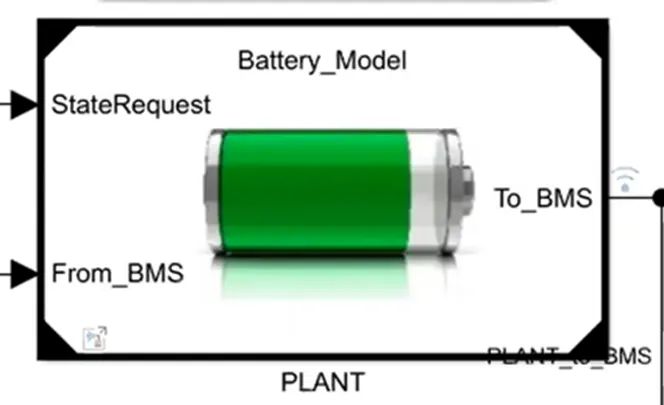
Below is the subsystem of the plant
PLANT: depicts the hardware of the model with battery pack, precharge circuit and charger.
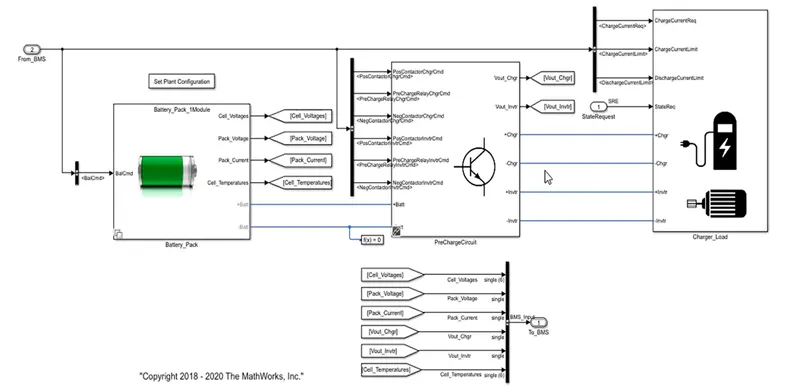
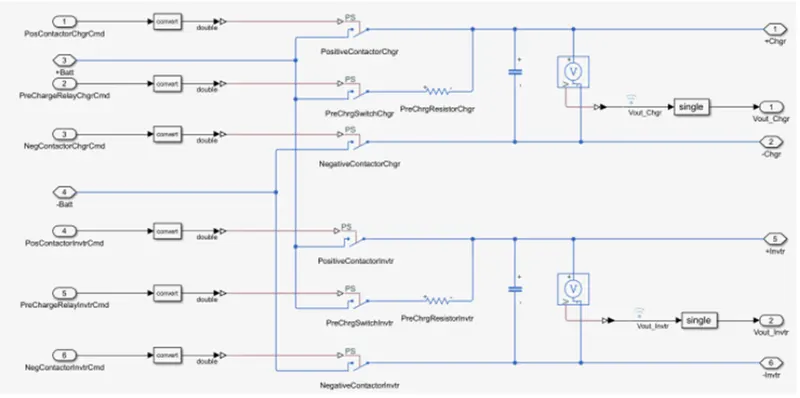
PRECHARGE CIRCUIT
Precharge circuit is used in order to prevent high amount of current while charging and discharging the battery and also to prevent generation of spark, wiring and components from sudden flow of current.
A resistor is connected in series so as to limit the flow of current and a capacitor is connected to prevent voltage fluctuation. The negative of the battery is connected and then the capacitor is charged via resistor and at the end positive terminal is connected.
CONCLUSIONS:
State of charge estimation was explained from the given mat lab model and 3 test cases were simulated in the harness dashboard.