Week 7 State of charge estimation
Study 1:Simulate the 3 test cases from harness dashboard and write a detailed report on the results
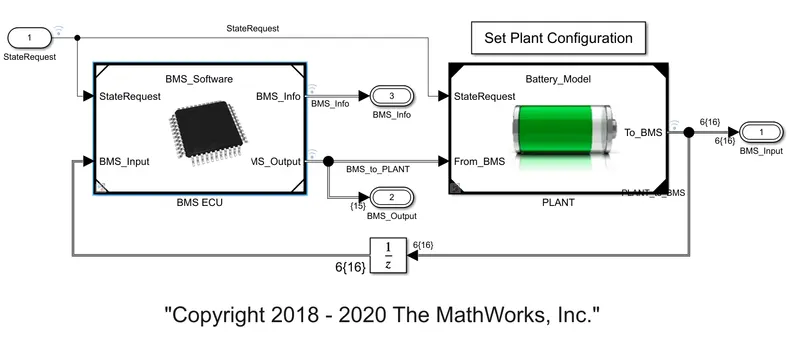
The below model shows the BMS ECU(Electronic control unit) and battery pack with other charging plans
The BMS helps to monitor the fault conditions of the battery.The input to the BMS from the battery pack will be mainly the cuurent , voltage and temperatures.And based on the inputs obtained from the battery pack the BMS will be giving the output as SOC,SOH(State of Helath) ,thermal management and capability of total battery pack.All the BMS outputs are given to bus controller to communicate with the Dashboard of the vehicle or to the user also with the charger and others
Cell balancing is also implemented to make sure the maximum battery pack is fully utilised to its full charging and discharging capacity
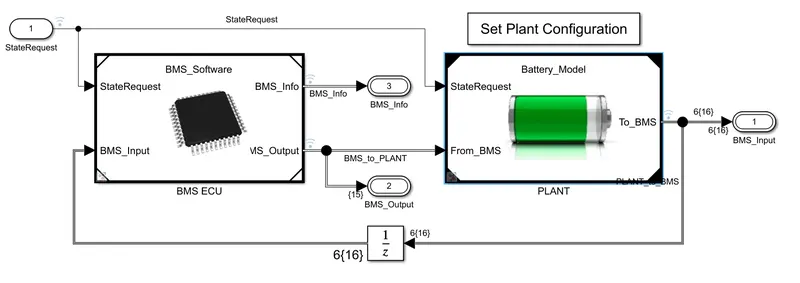
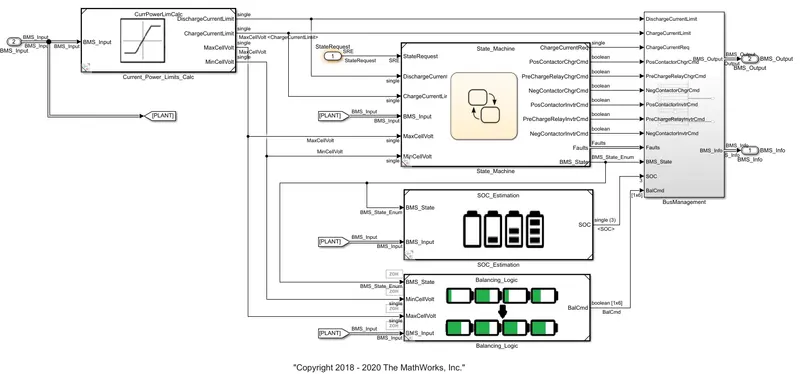
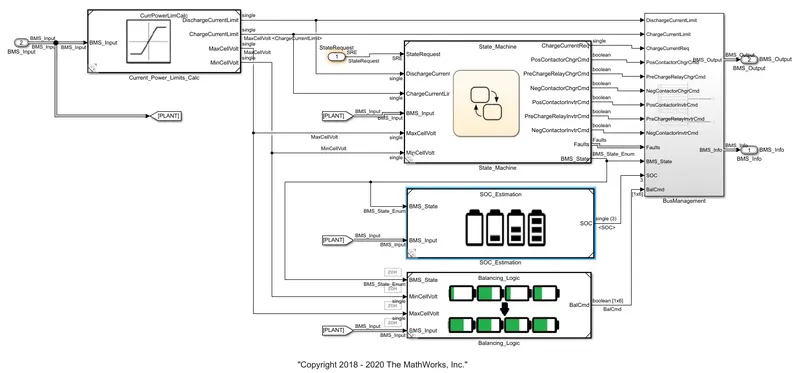
This is how the BMS is modelled inside from the subsystem of the BMS ECU.Inside the BMS ECU it contains state machine ,SOC and cell balancing
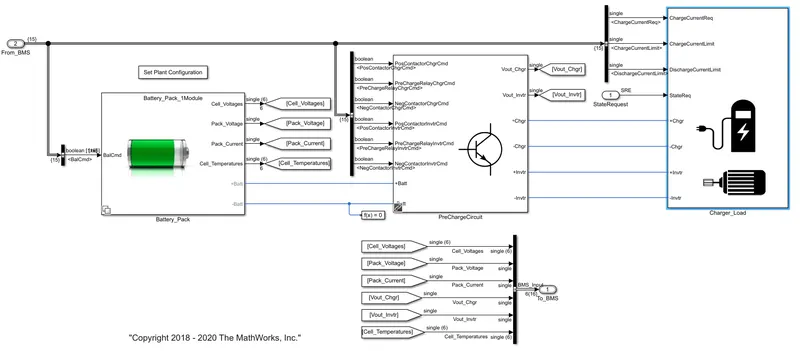
The below model is inside the Plant subsystem
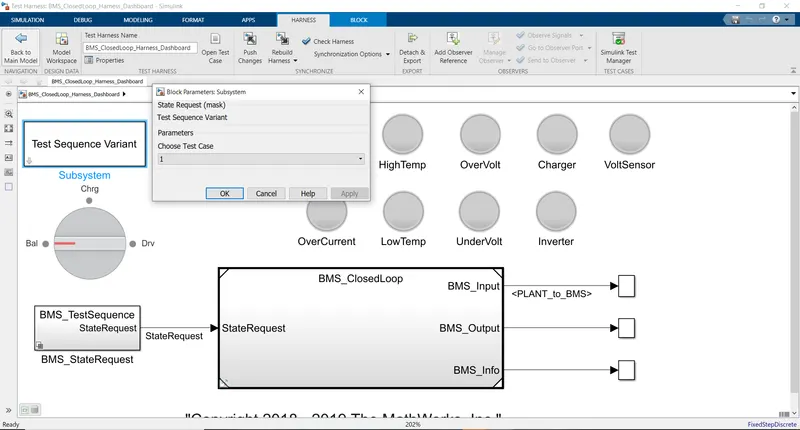
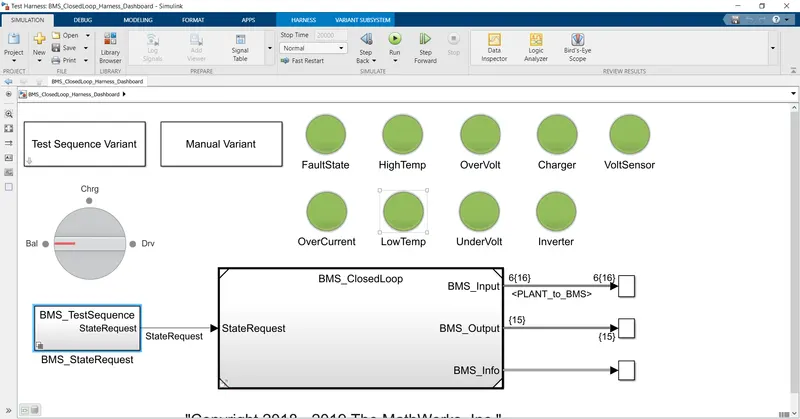
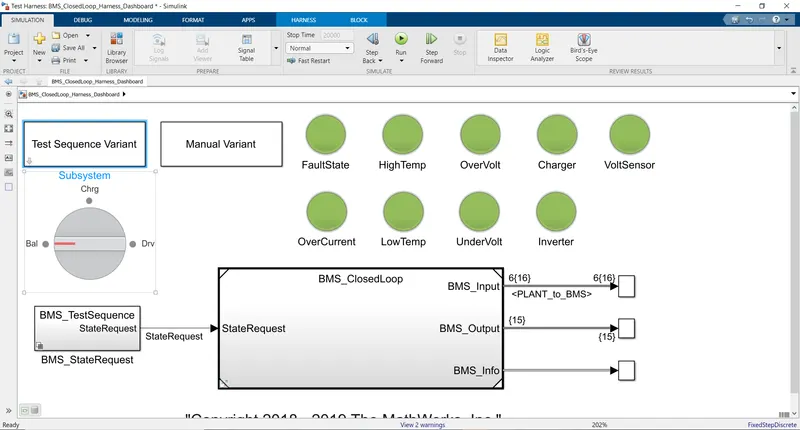
Now to simulate 3 test cases we need to open harness dashboard to find out the fault conditions in BMS. The below model shows the dashboard where we can get the information related to fault conditions like over current, over voltage ,high temperature and other related faults.
If there are any fault condition the Lamp block indicates red color otherwise it show the green indication which means there is no fault and the system is safe.
We can even get the battery pack present condition i.e balancing mode, charging mode and discharging mode.
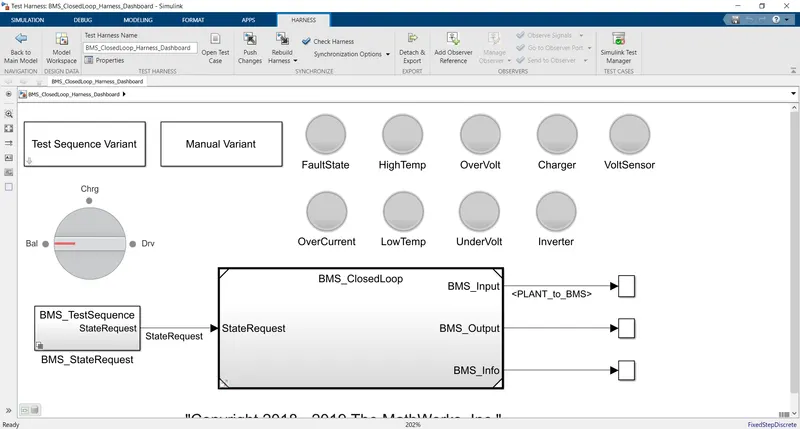
We can simulate 3 test cases by test sequence variant.By clicking on the test sequence variant we can choose the test case as shown below.
Test -1
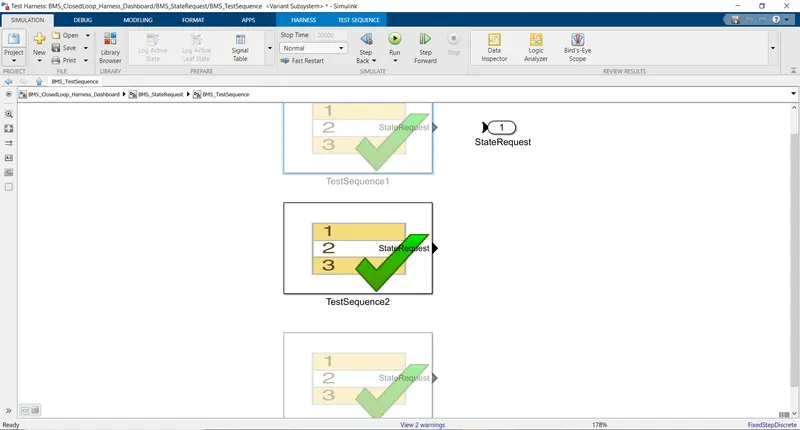
Indise the BMS_State request , the test sequence is provided as shown below
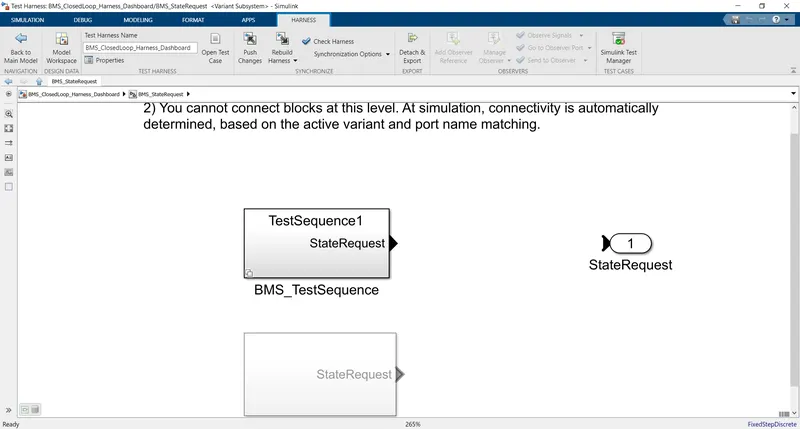
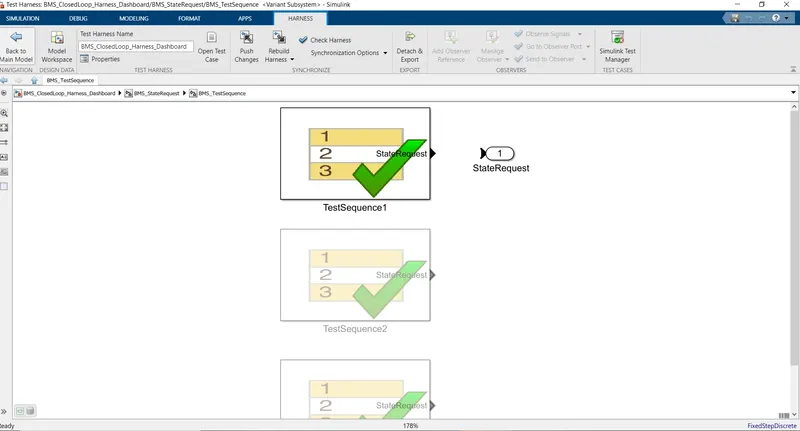
Now test sequence1 is hightlighted as shown
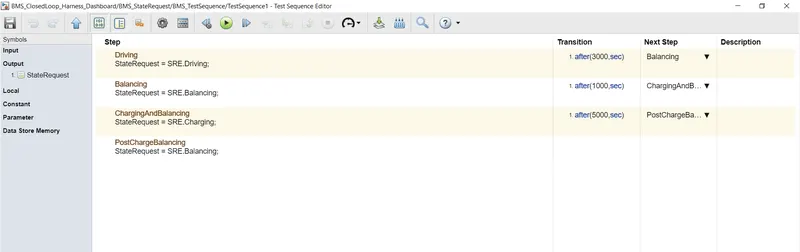
The below image shows the test conditions
For test 1 ,
the below 4 step condition is followed i.e
- Driving the vehicle after3000sec
- Next balanicing is done after 1000sec
- charging and balancing is done after 5000sec
- the last step is post charge balancing
Test -1 Results
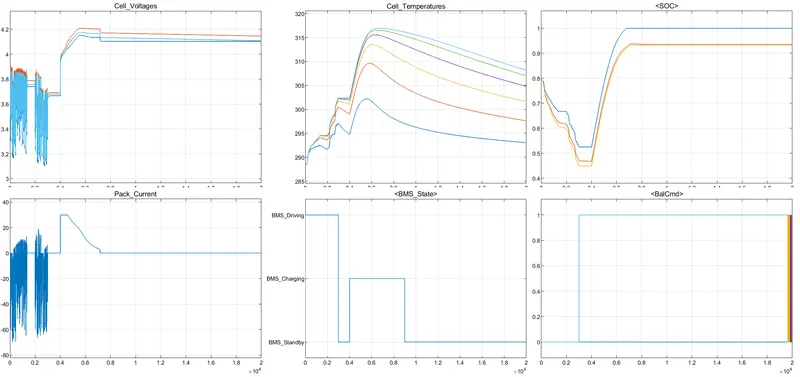
After Simulating the model for 20000sec ,all the characteristics indicated in green color
Cell voltage:
- The first plot shows the individual cell voltage for 6cells.The fluctuation in voltage is between 3.1 and 3.8V and between 0 and 3000 seconds , indicating that the nominal voltage was 3.8 and it decreased to 3.1 per cell.
- During the charging phase it rises to 4.2V i.e between 4000 to 9000sec.The fully charged voltage of the battery is 4.2 its because the BMS was in standby mode it did not diminish
Pack Current :
- The second plot shows the pack current.Because of the battery losses current when driving, it is displayed in the negative direction upto -60A..
- During charging phase it rises to 30A
- And drops to zero during stand by.
Cell Temperatures:
- The thrid Plot shows the battery pack cell temperatures, which ranges from 288.15K to 317K .
- The temperature of the cells rises during battery deplition and gradually drops during charging and stand by.
- From the plot we can observe that the 6th cell has the highest temperature, which shows that the the 6th cell is discharged the most.
BMS State:
- The forth plot shows the BMS states.
- The 4 steps are implemented in the BMS state
- The driving time is from 0 to 3000se ,charging time is 4000 to 9000 sec and te standby is 9000 to 20000sec.
SOC:
- The fifth plot shows the SOC in 3 separate graphs.
- The SOC is rapidly dcreasing to 0.4 during driving and and again it reaches to 100% during charging and during stand by mode it will not change.
Cell Blancing :
- The sixth plot shows the cell balancing.
- From the 6th cell to 1st cell,the balancing of cell is presented in descending sequence.
Test Case 2:
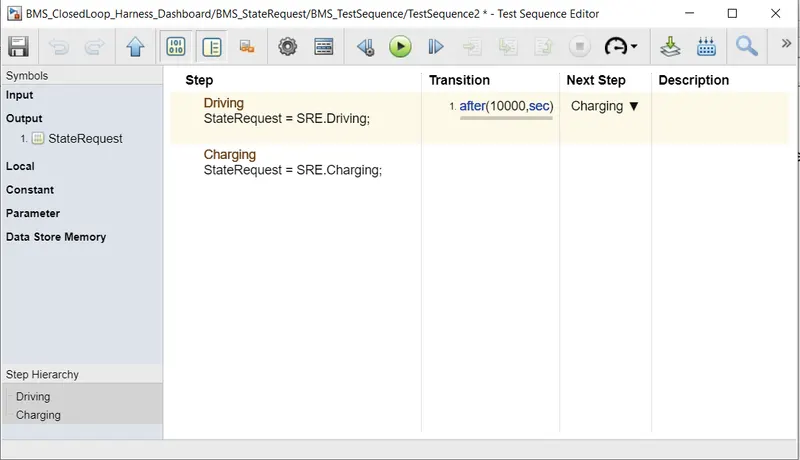
The driving state is maintained to 10000sec and later charging begins.
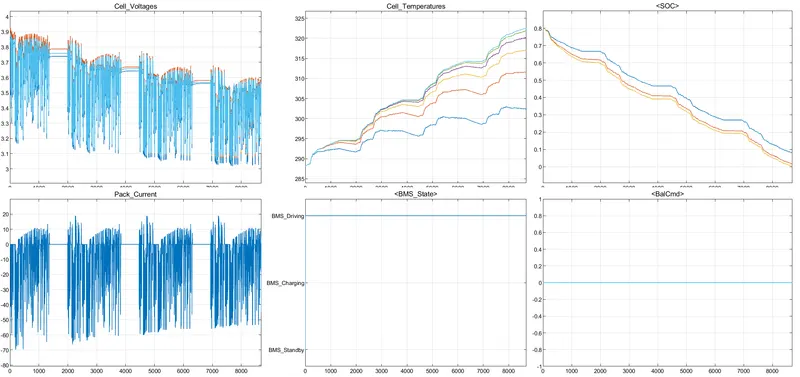
In this situation the BMS enters driving mode untill the battery pack SOC decreased.
Cell voltage:
- The voltage ranges from 3.8 to 3 volts .
- The 3v is the individula cells cut off voltage.The battery pack can discharge upto 60A of electricity. which is its maximum capacity
Pack Current:
- The battery pack discharges current for 8692seconds as shown in the plot on a single charge.
- There are no charging and stand by mode.
Cell Temperatures:
- The temperature of the cells continues to rise as a result of the constant discharge of the current.
SOC:
- The SOC continues to fall untill it reaches 0%.
Cell balancing:
- Because the battery pack has not charged or stood by , cell balancing is not performed while charging.
- The cells have been discharged evenly untill they are shut off, hence there is no cell balancing
Test -3
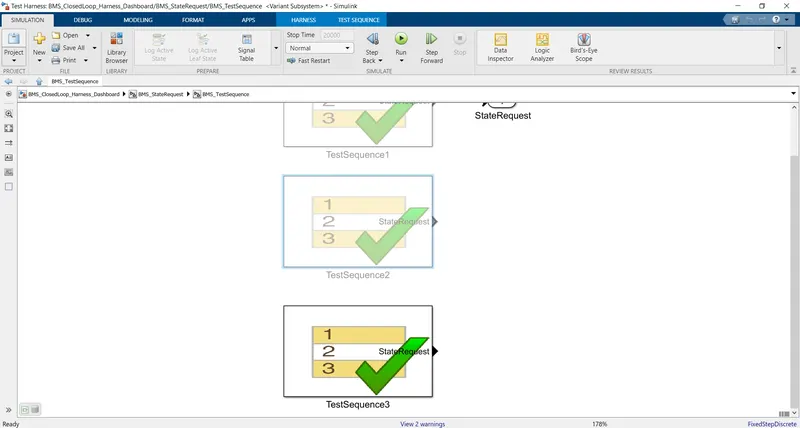
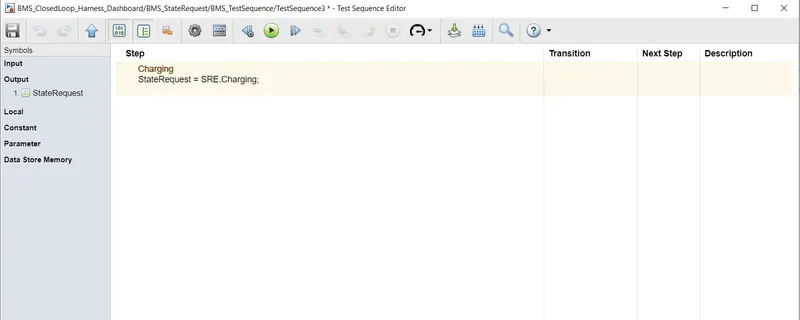
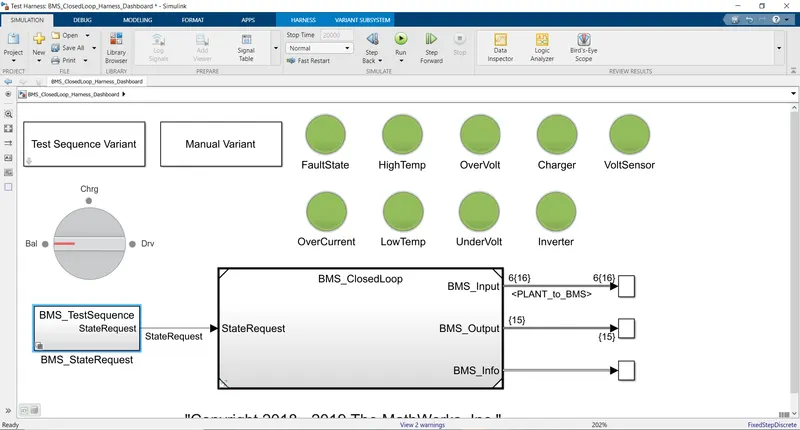
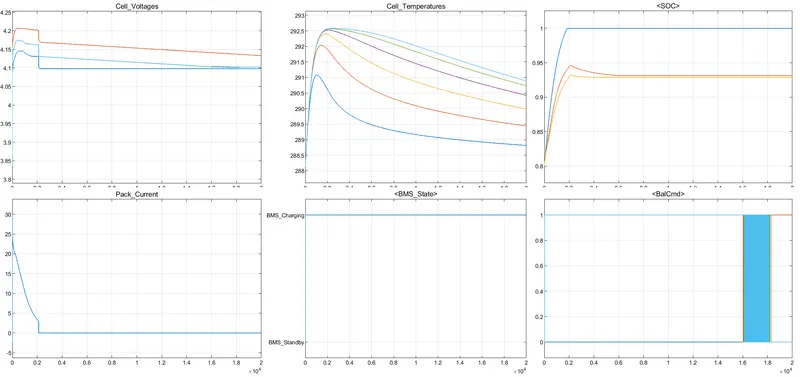
- The test case 3 shows only fully charging condition.There are no driving and stand by states.
- Cell voltage:The fully charged voltage ranges between 4 to 4.2V
- Pack current:After being charged the pack current increased to 30A and then decreased to zero. The in-rush current is limited by the contactor circuit.After being charged , the battery can no longer take current.
- Cell temperatures:The temperature increases at initial stage annd then it stablises
- Cell Balancing: From the plot, the cell balancing is in the order of 6th cell to the 1st cell.
study 2:What is coulomb counting? Refer to the above model and explain how BMS implements coulomb counting for SOC estimation
Coulomb counting is a technique used to track the State of charge(SOC) of a battery pack. It works by integrating the active flowing current (measured in amps) over time to derive the total sum of energy entering or leaving the battery pack. This produces a capacity that is typically measured in Amp-Hours
To determine available capacity, coulomb counting relies on the integration of the current drawn from and supplied to a battery over time, 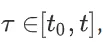 as given by
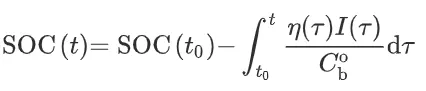
where I is the current and η is the efficiency during charge and discharge operations [4]. Coulomb counting is advantageous in terms of a simple structure and its ease of implementation. However, some problems make it difficult to accurately estimate battery SOC by coulomb counting. Because battery capacity and efficiency are significantly influenced by operating temperature and current direction, these factors should be considered to correct for battery SOC. Sensor accuracy is also important because accumulated errors can lead to a drift in the estimated battery SOC. Furthermore, one of the main problems in coulomb counting is that it is necessary to calibrate the initial battery SOC.
Coloumb counting for SOC estimation:
The below model shows the BMS ECU(Electronic control unit) and battery pack
Inside the BMS ECU subsytem , we can see state machine , SOC estimation and cell balancing
The below image shows inside the SOC Estimation Subsystem
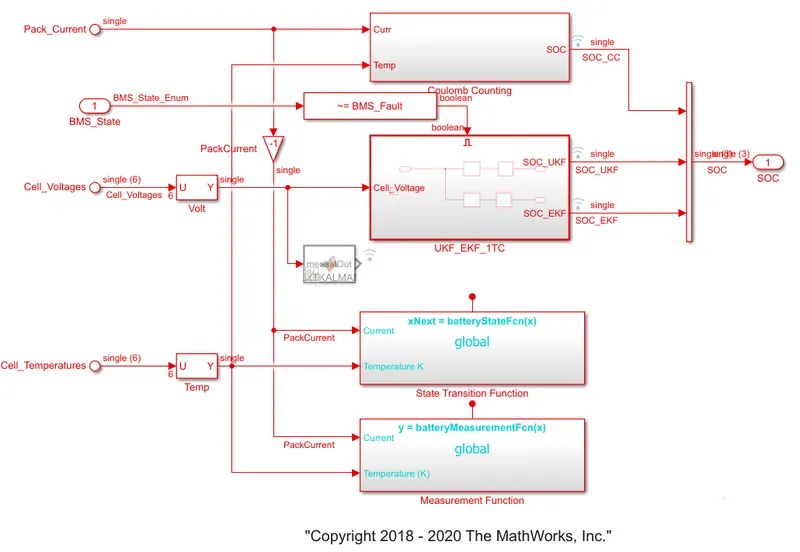
In the SOC estimation subsytem we can see Coloumb counting , UKF_EKF,State transition function,measurement
In SOC there are 3 different State of charge estimation strategies
- Coloumb counting
- Unscented kalman filter(UKF)
- Extended kalman filter (EKF)
All the three has its own benefits and drawbacks
The below imgae is coloum counting subsytem
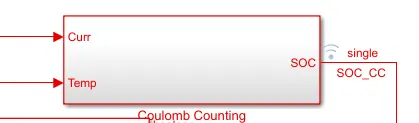
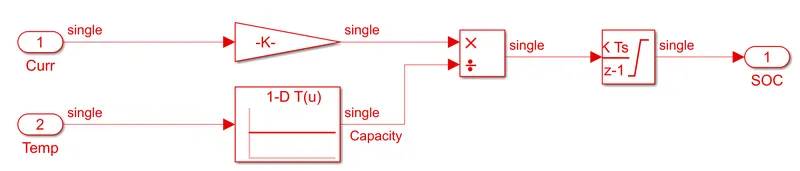
- This system does the estimation by coulomb countng equation as mentioned above.
- Temperature and current from the battery are given as inputs.
- Now the current signal is given to a gain block and temperature is given to capacity (look up table) as it varies according to temperature.
- These inputs are given for integration where current is integrated w.r.t to time.
- The output is given to another block where it is divided by capacity.
- Hence the SOC is estimated.
As already mentioned
- The positive of this estimation are its simplicity and cheap capital cosy , while disadvantages include a build up of current sensor error
- One of the most difficult aspects of coloumb counting is calibrating the initial battery SOC. In various applications,rest is required for startup and the initial SOC is calculated using the voltgae