Week - 4
Study1
Objective: Implementing a Control logic of a Washing Machine using stateflow.
- Stateflow is a control logic tool used to model reactive systems via state machines and flow charts within a Simulink model.
- The following is the sequence operations of a washing machine
- Power supply : After adding the clothes we provide a supply. So in this process the input we provide is power supply('ON' condition);we given the value as 1.If power supply is 'OFF' so ite returns to value '0'. And in the scope block we given the output statement as 'P=1' which provides the output after simulating.
- Water supply : After power supply is provided , water is filled which is a input for the further operations so given the input as 1.If water is not supplied it returns to value '0'. And in the scope block we given the output statement as 'w=1' which provides the output after simulating.
- Soaking time : Now soaking time is considered as 200s.Input provided as 200s and output statement as 's=1' to generate output.
- Washing Time :Washing time is considered as 100s.Input provided as 100s and output statement as 'wt=1' to generate output.
- Rinsing:Rinsing time is considered as 20s.Input provided as 20s and output statement as 'rt=1' to generate output.
- Drying:After completing all the washing operations , the clothes are dried for 50s. Input provided as 50s and output statement as 'd=1' to generate output.
- Start & end scopes are given to the sequence.
After completing the control logic of the washing machine we need to provide the input and output variables in the symbols pane which is provided beside the library browser.Based on the operations we need to provide the INPUT & OUTPUT data .
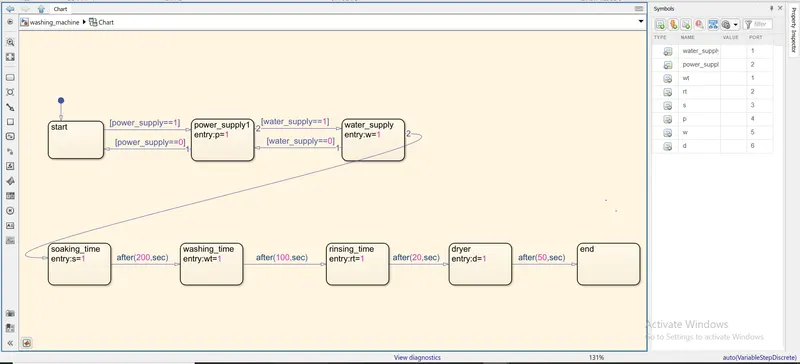
After creating the chart we have to assign the input and output in the simulink
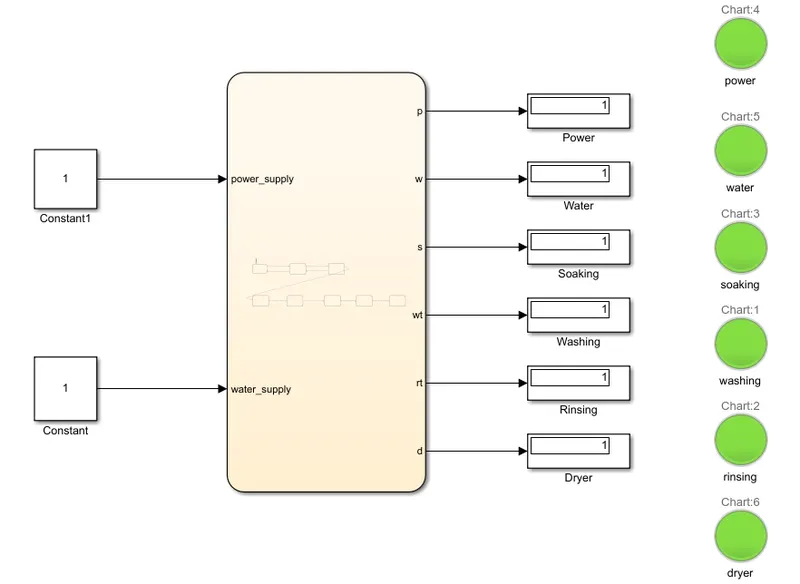
- As power and water are input for the process we taken them as input using 'Constant' block and given values as 1 for both inputs.
- In the below fig , all the right side mentioned 'display' blocks are output of the process i.e performance of the machine.
- To check the performance of the machine we created a indicator.
- The 'Lamp' block is used as the indicator which provides the 'ON' & 'OFF' condition.
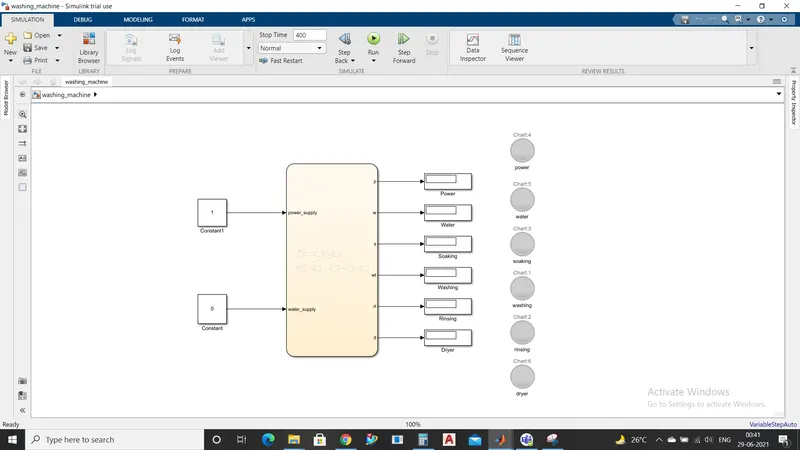
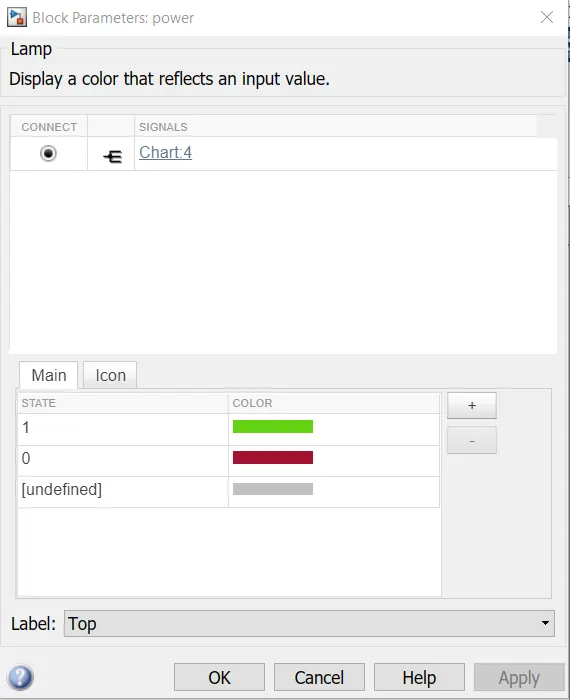
- In the same 'lamp' block we have given 2 colors i.e one is green color which indicates 'ON' condition & red color indicates 'OFF' condition.
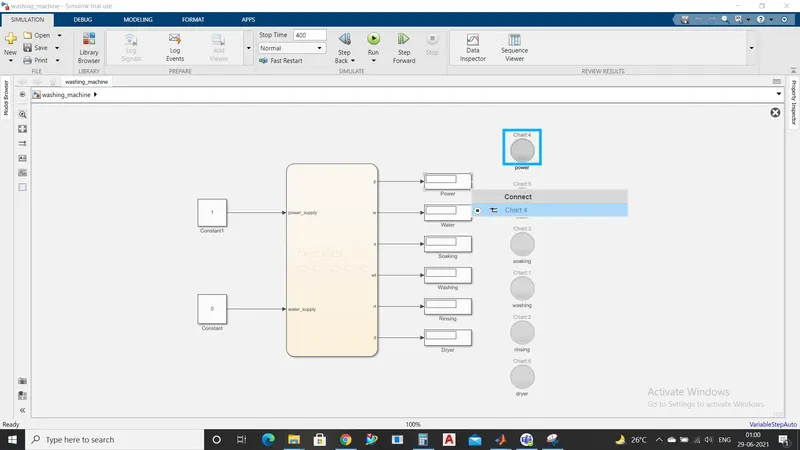
- Following the same procedure for all the outputs and then connecting these 'Lamp' block to output 'display block as shown below.
- To run the simulation we provide the stop as '400s' as soaking,washing,rinsing,drying requires 370s.
- After running the program all the 'Lamp' blocks are indicated to green because we given the water and power supply.
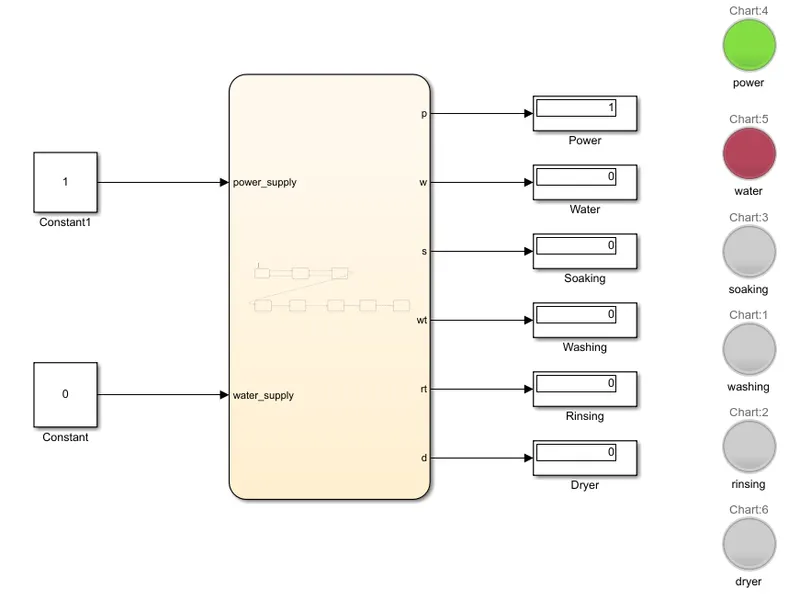
- In the below fig , we have not provided the water supply i.e we provided the 2nd 'constant' Block as '0' . From this we can understand that power is activated and water supply is indicated red color ('OFF' condition) and we dont have further process without water supply.
Study 2:
Objective: Creating the Simulink chart for 'Gear Shift' logic.
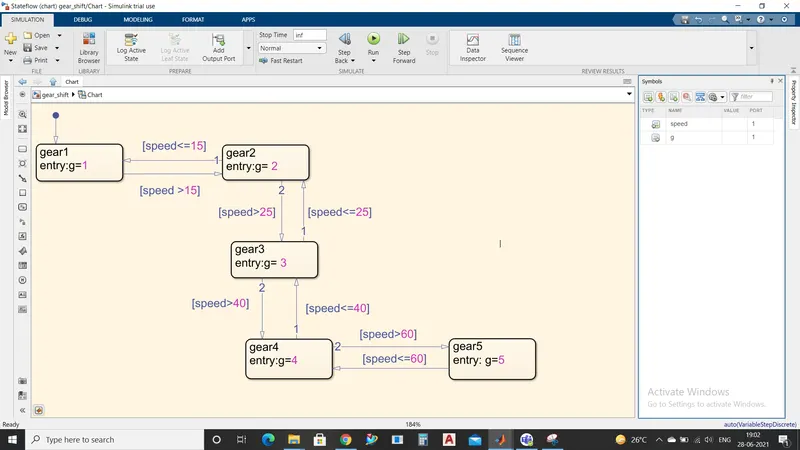
- As per the given input we have provided the control logic for the 'Gear shift'.
- For 'gear1' the speed limit provided is '0 to 15' as input .If the Speed range is more than 15kmph it shifts to gear 2 and or else it remians in gear1'.
- For 'gear2' the speed range provided is '16 to 25' as input .If the Speed range is more than 25kmph it shifts to gear 3 and or else it remians in gear2'.
- For 'gear3' the speed range provided is '26 to 40' as input .If the Speed range is more than 40kmph it shifts to gear 4 and or else it remians in gear3'.
- For 'gear4' the speed range provided is '41 to 60' as input .If the Speed range is more than 60kmph it shifts to gear 5 and or else it remians in gear4'
After creating the control logic , 'INPUT' & 'OUTPUT' variables to be assigned in the 'symbols pane'
- Speed is given as input and 'g' is a 'output' for the model so it is taken as 'output' data
After creating chart , we need to provide the input data i.e speed range to change the gear .
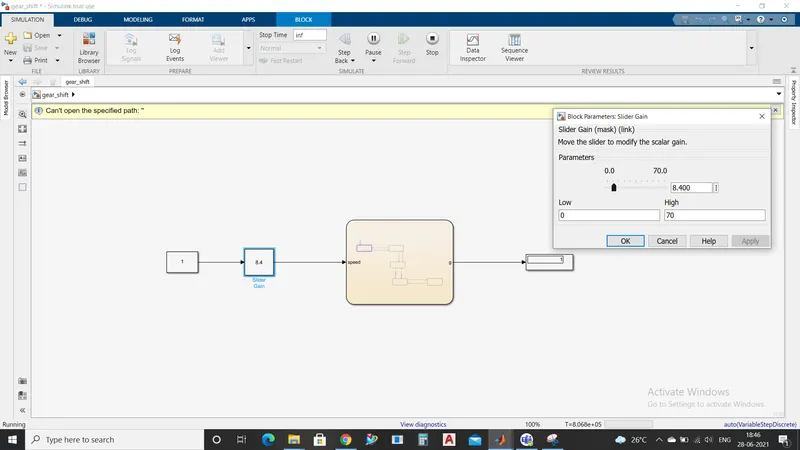
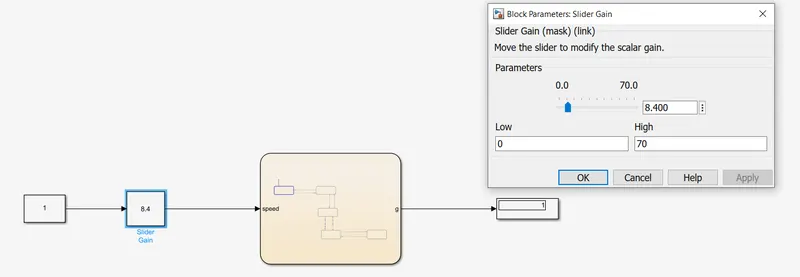
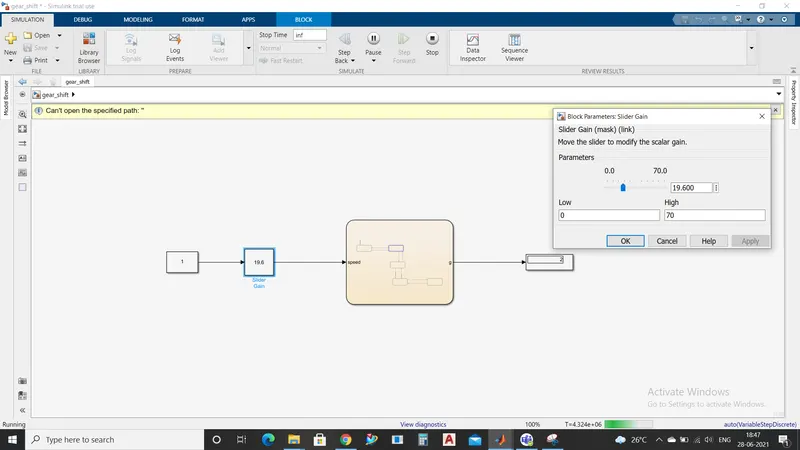
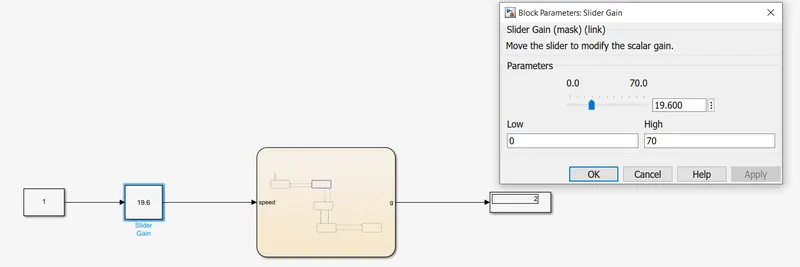
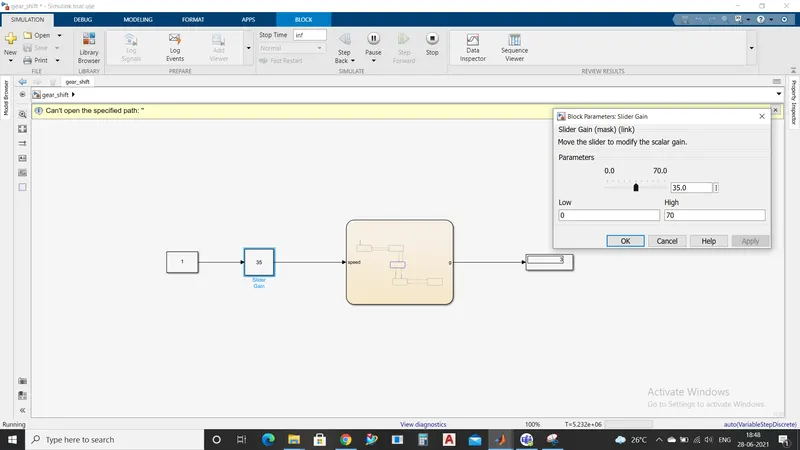
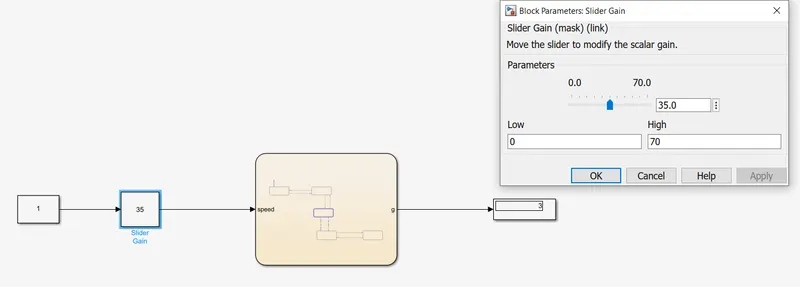
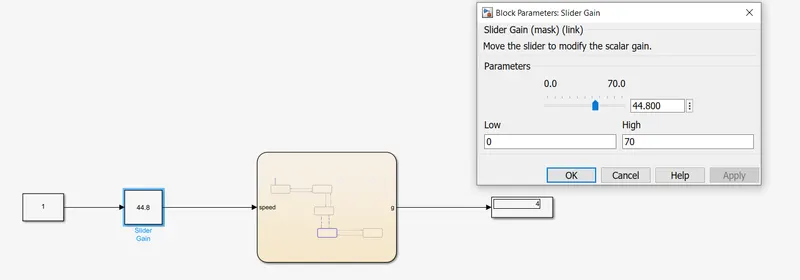
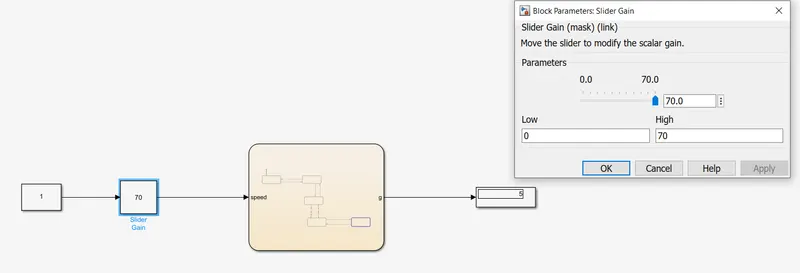
- A 'constant' block is used to provide the speed range in the 'slider gain' block.
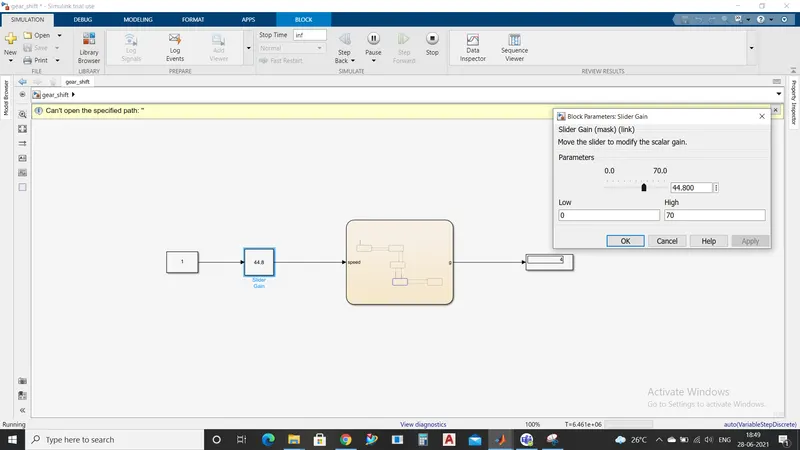
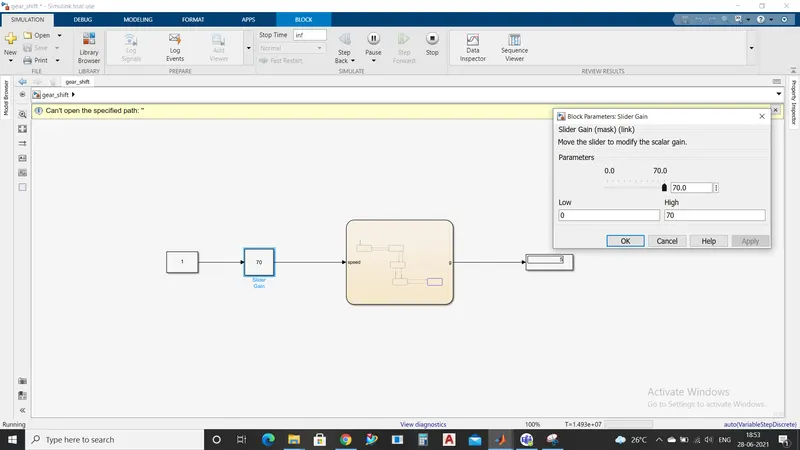
- We can the change the speed range during the simulation as shown below.
- And Gear shift value is displayed in the 'display' block.
- To run the program we have considered the stop time as 'inf' .
Below are the outputs for the speed range provided during the simulation process by changing the speed range.
The display value change when the speed is changed in the slider gain. We set the low and high limit in the slider gain as shown below.
.
1