Week 7 State of charge estimation
What is columb counting ?
Coulomb-counting based algorithms are often used as a core technology for battery SOC estimation in BMS. They
express the SOC as the ratio of available capacity to the nominal one. The remaining capacity in a battery can be
calculated by measuring the current flow rate (charging/discharging) and integrating it over the time interval .
The common equation to calculate the SOC is given by where the SOC0 represents the initial SOC, I Battery represents the current across the battery and, Qrated is the nominal capacity of the battery .
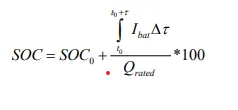 The book-keeping methods also known as Coulomb-counting, consist of a temporal integrating of the battery current during charge and discharge. The accuracy of these methods is strongly dependent on the precison of current sensors.These non-model-based methods may accumulate errors caused by measurements, possible embedded noise and an inaccurate initial SOC.
Drawbacks :
However, this book-keeping (columb counting) method suffers from cumulative errors problem and the inaccuracy of the initial SOC estimation.
To avoid these some implementation done :
A coefficent of Coulombic efficiency was added to the above quation. In the same vein, the accuracy of the initial SOC affects severely the estimated SOC since SOC0 is an additive term according to the definition in above equation. Subsequently, we need to estimate SOC0 with rigor and make the access to the initial SOC easier, for that the OCV-SOC model is generally used; because knowing the OCV value leads to having the instantaneous SOC owing to a well-known mapping between OCV and SOC. For this reason, the OCV-SOC model is widely utilized in a lot of works for battery characterization and monitoring .
Coulomb-counting is based on exploiting the Eq. (1) by quantifying the charge delivered by the battery through sensing its input and output current . Yet, there are some inefficiencies when using this method. First of all, the access to the initial SOC is not guaranteed. Secondly, self discharge may distort the real SOC value after a long storage period and finally the reference capacity Qrated must be updated in terms of battery ageing. Furthermore an SOC estimation is performed at varying ambient temperature which should be taken into account. The literature shows enhanced Coulomb-counting algorithms which allow the determination of the initial SOC using the SOC-OCV curve, takes into account self-discharge losses and performs a recalibration at fully and empty stages..
The estimation of the SOC of a Li-ion battery by the developed method is based on monitoring the voltage V bat the current I bat and the temperature T°. The operation mode of the battery is recognized by the direction of the current through the battery system. When the battery is in an open circuit mode, i battery=0 , a compensation of self-discharge losses will be considered . The information needed to perform the monitoring are the measurement of the battery voltage and the current flowing through it. Coulomb counter is used to track the SOC when battery is charging, discharging and selfdischarging. The amount of charges in an operating period is obtained by a temporal integration of a measured charging/discharging current I bat as expressed in Eq. (2).
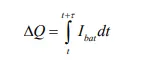 equation 2
Negative is discharge and positive is charge in equation 2.
Intial soc detemnination :
Several studies have been conducted to remedy to the problem of accurate estimation of the initial SOC . The most common technique is to use a bijective OCV-SOC function that relates the open circuit voltage to its corresponding SOC value as detailed in the in section 2. This curve is actually determined experimentally by the OCV test by applying a pulse load on the Li-ion battery, then the battery reach an equilibrium where the voltage is extracted in every 5% of Depth Of Discharge (DOD) .
In this proposed algorithm, we start by determining the SOC0 from measuring the initial OCV, for that we consider the inverse function noted SOC-OCV relationship of Li-ion battery which can be approximated to piecewise linear curve. As demonstrated in Fig., the curve is divided into eight segments [25], and each segment can be expressed as a linear relation as in Eq. (3).
 equation 3.
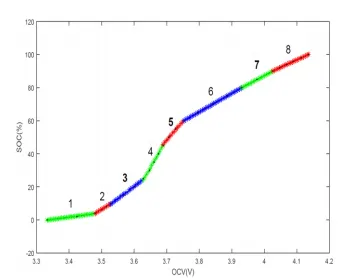 For each segment we are varying coefficients a and b
according to OCV intervals. The coefficients for each segment are given in , with their voltage range.
charge mode :
The typical charge procedure of a Li-ion battery consists of constant-current constant voltage (CC-CV) process . The Coulomb counter is presented by Qgained as expressed in Eq.(4), which represents the quantity of charge accumulated during an operating period equal to τ.
 equation 4
Thus, the variation of the state of charge gained in this same operating period is obtained by the Equation.
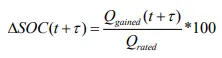
By accumulating the previous state of charge indication and the obtained one, we can have the instantaneous value of SOC as expressed in

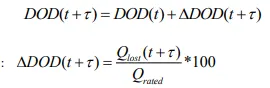
Knowing the relationship indicated in Eq the value of DOD is updated in every charging operation in order to
get it back in every switching to discharging mode.
 .
.
Discharge mode :
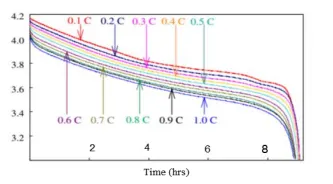 Typical discharge profiles of Li-ion battery under
different currents (C-rate)
When the current i bat is negative, then the battery is in the discharging mode. In this mode, the Coulomb counter is presented by Qlost , which represents the amount of charges losses in the operating period τ as expressed in Eq.

The value of DOD is calculated according to Eq
Self discharging :
At the battery storage periods, considering that Li-ion batteries reach 5% rate of self-discharge per month [2], the amount of charge losses per hour is calculated; this amount is designed by the constant, q per/hour . Then, the quantity of charge dissipated in this phase Qoc is calculated by Eq. , representing the cumulative losses during the storage hours.
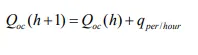
where h is the hour of storage.
This value will be added to the amount of charges lost Qlost during discharge mode and subtracted from the amount of charge accumulated Qgained in the charge mode as expressed in Eq.
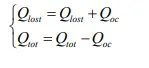
This compensation of self-discharging loss is made at each open circuit period and before switching to another
operating battery’s mode.
Temperature :
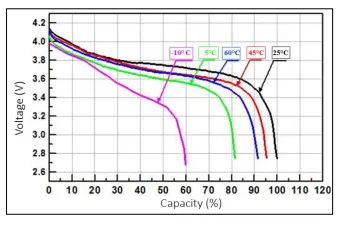
Different studies have highlighted that the temperature has an important effect on the battery behavior . In fact, at low values the released capacity from the battery decreases dramatically as illustrated in Fig. One can see that the capacity is about 80% when the temperature is about 5°C and reaches 60% when T°= -10°C.
In BMS connected to measurment :
The battery parameters detection is one of the most important issue in control and management of a BMS . It includes cell voltage measurement and current detection. Estimation of SOC and other battery states imposes high requirements on cell voltage precision . The diagram presented in Fig. shows the different modules connection to the data acquisition system.
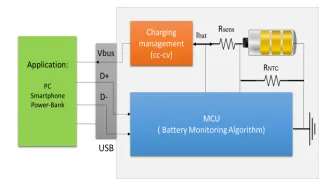
In order to measure the voltage and the current with which the battery is charged or discharged, a sensing resistor Rsens is placed in series with the battery. The battery voltage Vbat is obtained by measuring the voltage across it. The difference between the voltages at the two terminals of the resistor will derive the current value I bat through the sensing resistance. This resistance, which allows the current sensing in the battery gauge, should not be too high in order to avoid power dissipation during the charging at a constant current of 1C-rate, but it should still be enough so that the analog/digital converter in the micro controller can detect a voltage variation across it, which corresponds eventually to a 10 mA current, in order to detect the end of charging. In our case, a 10-bit converter is used to detect a voltage variation of 1mV. A 0.1 Ohms resistance can detect a current of 10 mA (for U = 1mV) and does not dissipate too much power while charging the maximum current value (P=100mW). The transmission of the battery electrical parameters is ensured by a USB connection between the multimedia application and the MCU PIC18F.
The ambient temperature is measured using a negative temperature coefficient resistor RNTC . This thermistor is biased by IO of the MCU and connected close to the batterie as depicted in above Fig .
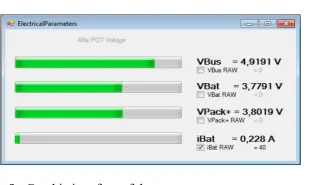
To show the measurements, a graphical interface is used to display the electrical parameters of the battery: battery voltage: Vbat , voltage across Rsens : Vpack , battery current : I bat , and charging voltage : Vbus.
 .
.
Applicaton :
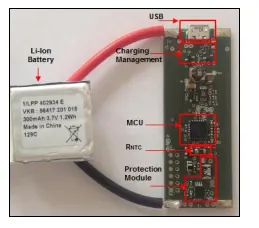
To validate the developed algorithm, some tests were achieved using a test card developed in the company IntelliBatteries. It consists of five main parts which are shown in fig .
The charging management ensuring cv-cc procedure.
The MCU that contains the programmable card PIC18F.
The NTC resistor that indicates the external ambient temperature
The protection module that protects the battery against overload, voltage drops and power surges.
The USB connection that ensures both the charging process and the data transmission from the multimedia
application to the MCU.