Week 7 State of charge estimation
1.Simulate the 3 test cases from harness dashboard and write a detailed report on the results
Ans:
BMS with Battery plant model:
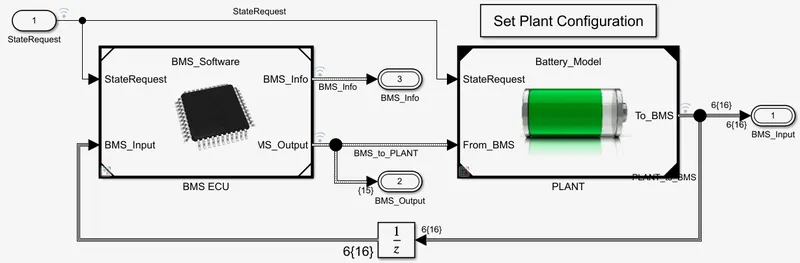
The BMS model consists of a BMS ECU (electrical control unit) and a plant. The control unit with its various monitoring and control algorithms is connected to a block with the representation of the battery pack and associated circuitry and peripherals. This model contains two versions of the battery pack: a small one with just 6 cell series, and a larger 16-module pack, each module containing a 6-cell series string. The architecture is 6s-1p and 96s-1p packs, respectively.
When you click on the BMS ECU, its subsystem opens. Now, click on the state machine.
TEST CASE 1:
Inside of the BMS ECU:
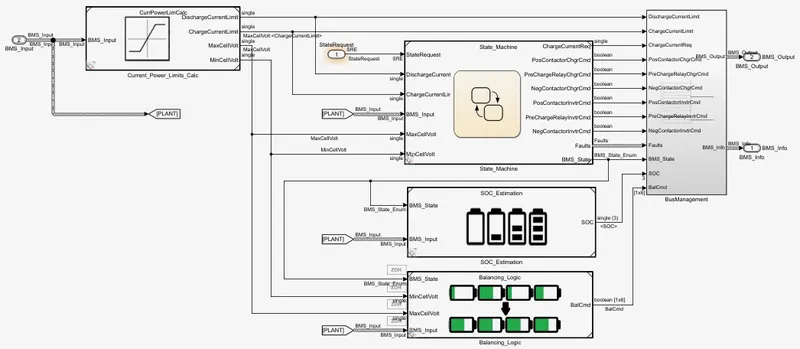
State Machine defines the main operating state of the BMS. The state machine has four parallel states (parallel meaning that they can be active at the same time):
- The first one defines the variable BMS_State which indicates standby, driving, charging, and fault. Charging comprises constant current and constant voltage stages.
- The second state switches the fault state ON in case a current, voltage, or temperature value reaches an unsafe level.
- The third and fourth states define the contactor ON and OFF switching sequence for the charger and inverter. This is needed to avoid an excessively large current inrush at the beginning of the charging stage.
After opening the BMS system we have to go for the harness dashboard. This dashboard can be selected from the MATLAB window following the procedure shown below.
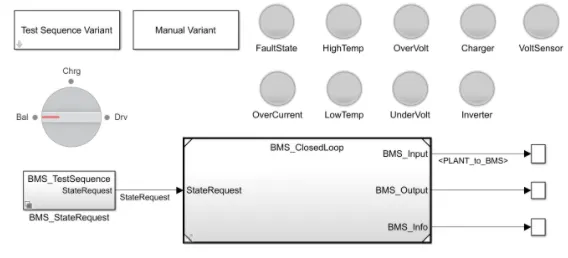
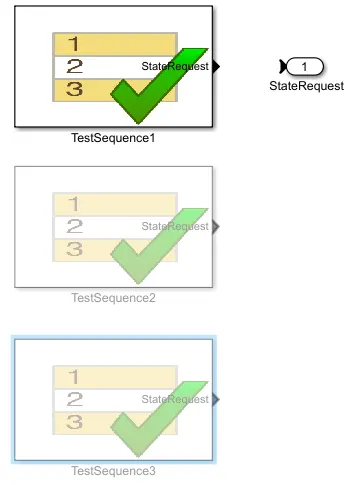
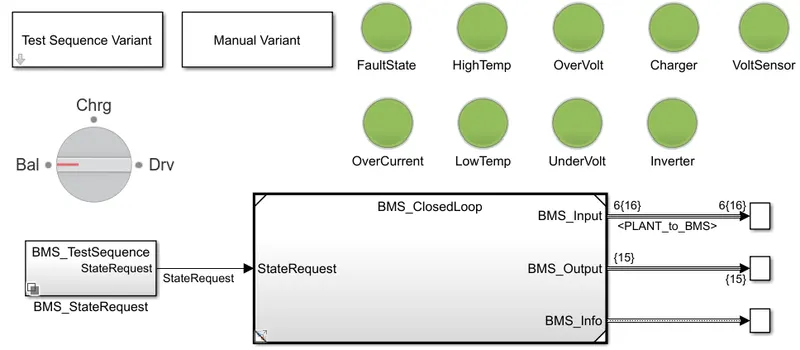
The harness dashboard is shown above. It consists of the test sequence variant subsystem which holda three different test cases. This dashboard also helps in determing the fault states and other parameters as shown in the diagram below. Green color indicates that the system is working without any errors while red signal will indicate that there is a fault in the system.
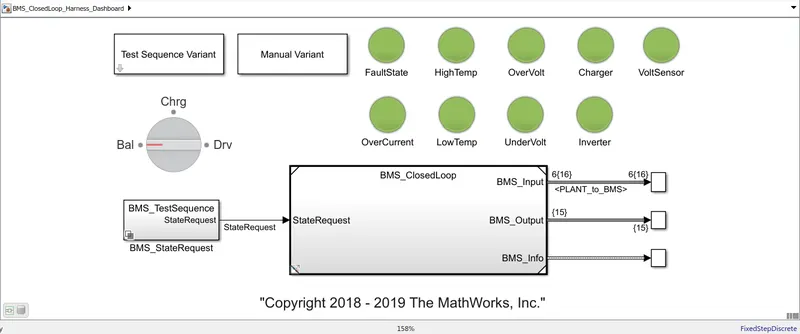
If we click on the "BMS_StateRequest" the following system opens up. Now we have to select "BMS_TestSequence"
There are three stages of driving condition, namely-
- Driving
- Charging
- Standby
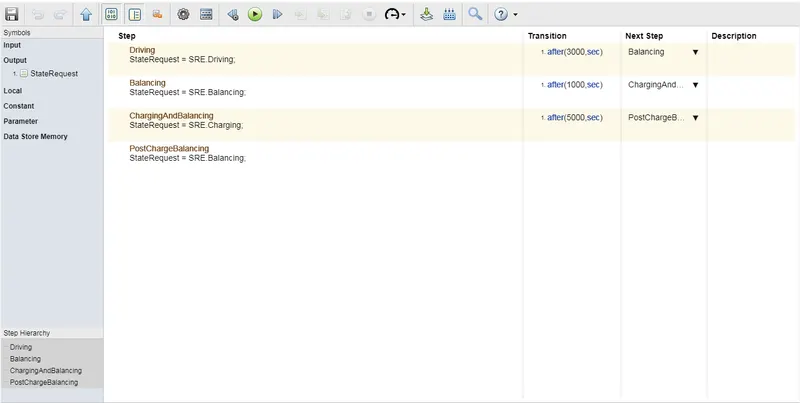
When the simulation begins, initially the vehicle is in driving state and the SOC will decrease for this time period. After a time period of 3000 seconds the next step is balancing mode and the vehicle is in standby condition. After, another 1000 seconds, the vehicle is in charging phase and the battery's SOC increases almost to 100%. The next phase is the postcharging phase in which the vehicle again goes for the standby mode.
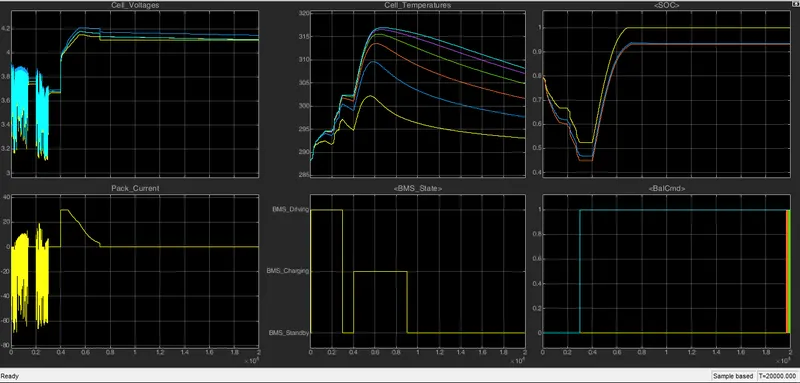
- The input cycle can be seen in the BMS_State plot in which the vehicle initially undergoes driving, then charging till SOC= 90% and then later in standby state.
- During Charging the Battery pack voltage is increased upto 4.2V.
- The cell temperature increases during the driving and charging cycle and starts falling off in standby mode.
- The SOC drops to less than 50% after the driving cycle and then later put into charging until SOC Reaches 100%.
- The Current supplied to the EV during driving phase can be seen in the current plot.
TEST CASE 2:
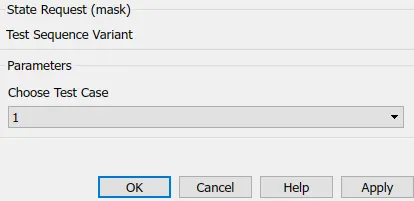
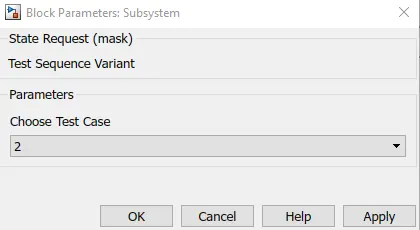
Now, we will go for the second test case. For this we have to go to test case variant subsystem and select test case 2 from there and click on "Ok". Then we have to run the system for the given simulation time. The result shows that there is a fault condition in the vehicle. The dashboard on the model depicts the same with a red colour indication.
If we click on the "BMS_StateRequest" the following system opens up. Now we have to select "BMS_TestSequence".
Selecting the second test sequence we can check the conditions for this particular condition.
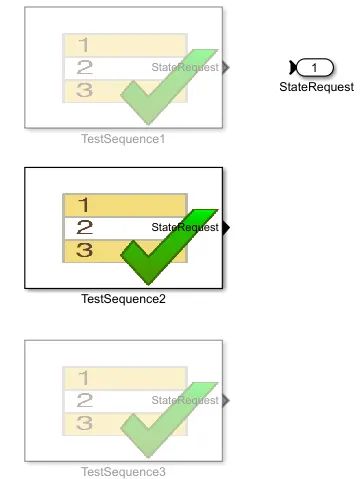
This test case has two Phases for the battery pack, i.e., Driving and Charging phases.

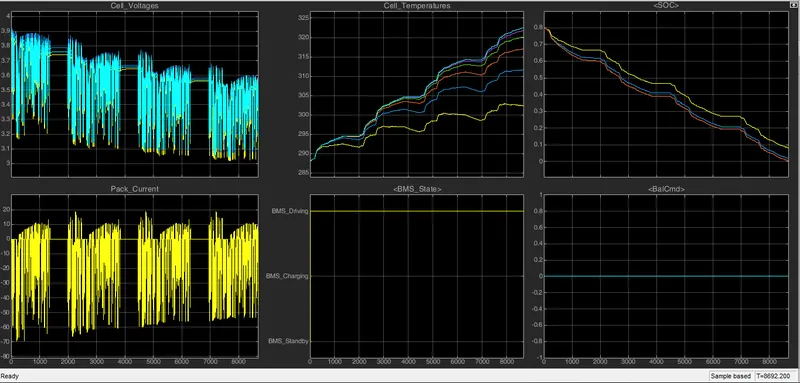
The scope shows the various parameters for the BMS model under second test case. After 10,000 sec when the driving cycle is over, the fault condition occurs and so the SOC does not increase even for the charging phase.
Hence we ran this simulation for 8692 seconds only hence we didn't got any fault indications.
- The BMS enters driving mode in this second situation until the battery pack's SOC is depleted. The battery pack discharges current for 8692 seconds, as seen in the graph. We may deduce from this that the battery pack lasts 8692 seconds on a single charge. Here, there is no charging or standby mode. The electric vehicle continues to run until the battery pack is entirely depleted.
- The voltages range from 3.7 to 3 volts. This 3V is the individual cell's cutoff voltage. The battery pack can discharge up to 60A of electricity, which is its maximum capacity. The temperature of the cells continues to rise as a result of the constant discharge of current. The SOC continues to fall until it hits 0%. Because the battery pack has not been charged or stood by, cell balancing is not performed while charging. The cells have been discharged evenly until they are shut off, hence there is no cell balancing signal.
TEST CASE 3:
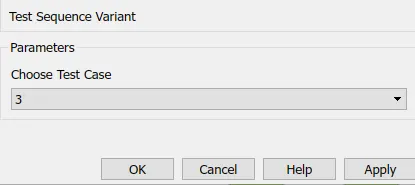
After applying the selected test case, we have to run the simulation. The dashboard shows there are no errors and faults.
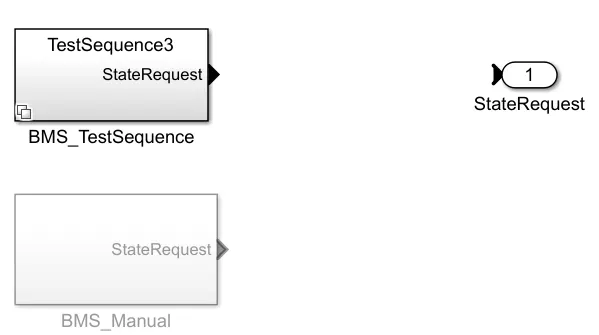
If we click on the "BMS_StateRequest" the following system opens up. Now we have to select "BMS_TestSequence".
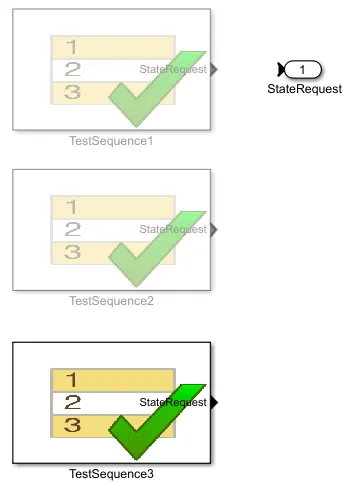
Selecting the third test sequence we can check the conditions for this particular condition.
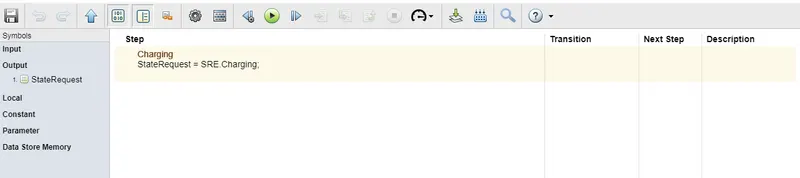
There is only a single phase here for the third test case, i.e. the charging phase.
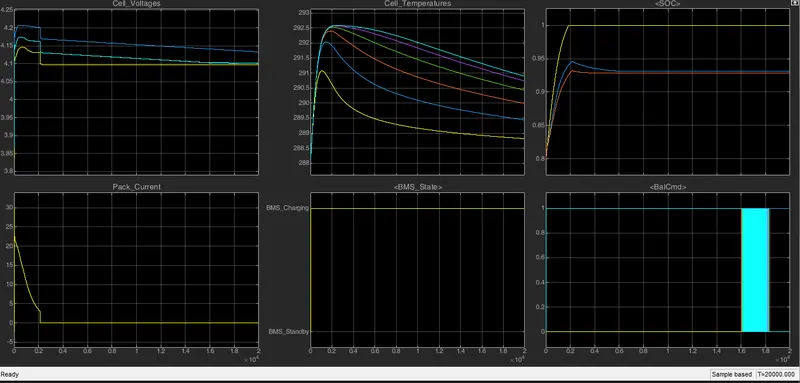
The scope shows the results for the third test case. Here the SOC increases from 80 to 100% and then remains in standby mode.
- The charging duration is fully in this third circumstance. There is no such thing as a driving or standby state. The SOC was set to 80 percent at first, and then the pack was fully charged. After being fully charged, the pack current increased to 30A and then decreased to zero. The in-rush current is limited by the contactor circuits. After being fully charged, the battery can no longer take current.
- The fully charged voltage range for the cell is between 4 and 4.2 volts. The cell temperatures were also somewhat higher at first due to the initial charging current, but they quickly stabilized thanks to the contactors. According to the plot, the balancing orders were followed from the sixth cell to the first cell.
- As a result, the BMS system was thoroughly examined, and the three separate test case situations were thoroughly discussed.
------------------------------------x------------------------------------------x----------------------------------
2.What is coulomb counting? Refer to the above model and explain how BMS implements coulomb counting for SOC estimation ?
Ans:
Coulomb Counting Method:
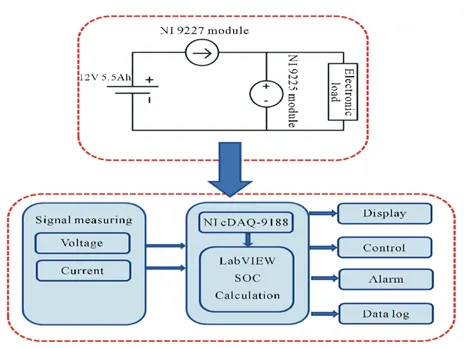
The Coulomb counting method estimates SOC by measuring the discharge current of a battery and integrating it over time. The SOC(t), which is determined using the discharging current, I(t), and previously estimated SOC values, SOC, is calculated using the Coulomb counting technique (t-1). The following equation is used to determine SOC:

Modified Coulomb Method:
To improve the Coulomb counting method, a new technique called modified Coulomb counting method is proposed. The modified Coulomb counting method uses the corrected current to improve the accuracy of estimation.
The corrected current is the function of discharging current. There is a quadratic relationship between the corrected current and discharging current of battery. By practice of experimental data, corrected current is calculated by the following form:

where k2, k1, and k0 are constant values obtained from the practice experimental data.
In modified Coulomb counting method, SOC is calculated by the following equation:

The experimental results show that the accuracy of the modified Coulomb counting method is superior to the conventional Coulomb counting method.
Referring to the above model BMS implements coulomb counting for SOC estimation:
To compute the estimated soc of the battery management system, we must insert the plant block into this model, which incorporates BMS ECU and PLANT.
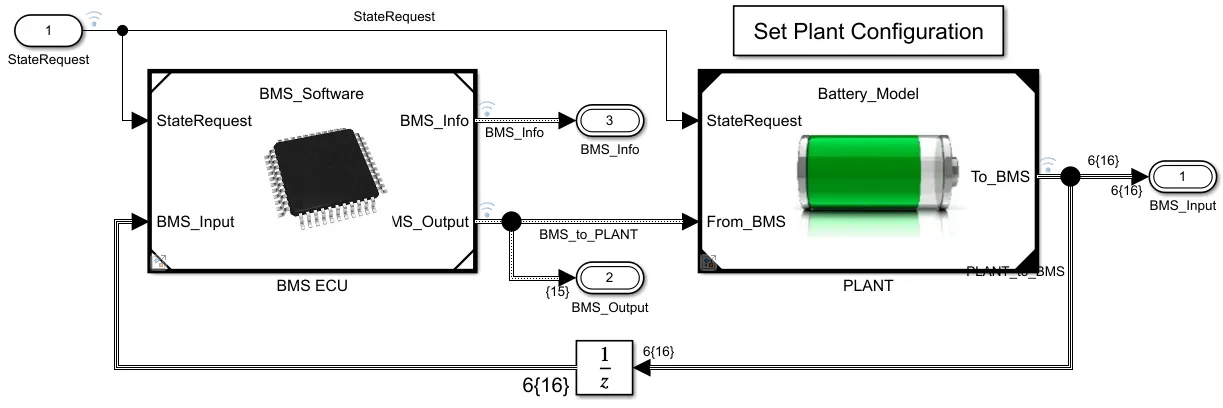
We require an accurate estimate of battery SOC before we charge our car. In the battery system, we don't assess the state of charge; instead, we measure things like battery pack current, cell voltage, and cell voltage using signals from the plant.
after entering the BMS ECU block, we can see the state machine, SOC estimation, and balancing logic block.
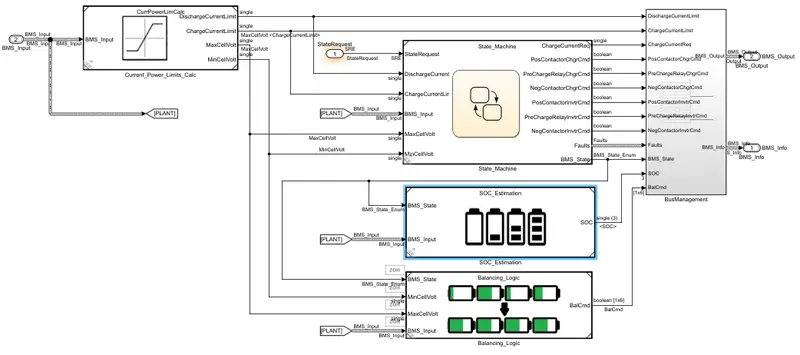
Three distinct state of charge estimating strategies are shown in this SOC estimate block. Each strategy has its own set of benefits and drawbacks. Columb counting is the first approach, while unscented(ukf) and extended Kalman filter are the other two (ekf). We're talking about the Columb counting approach here.
In this section, we'll look into SOC estimate.
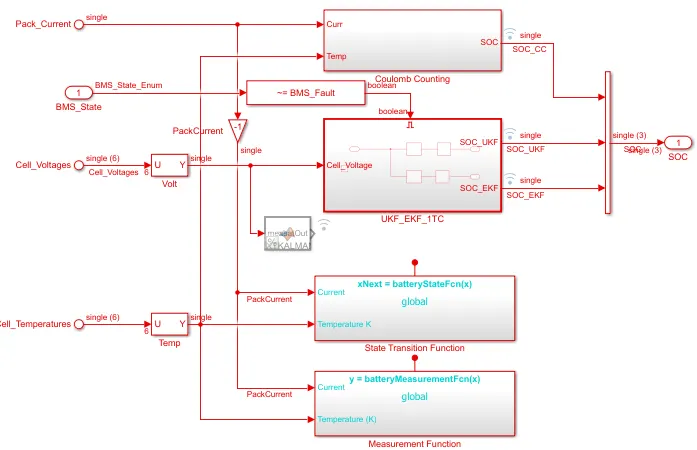
Coulomb counting block:
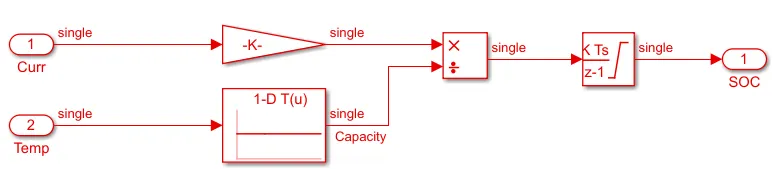
It accepts two input signals: current and temperature, with the current signal going to the gain block and the temperature signal going to the battery time and current lookup tables. Both blocks are linked to the split block, and these signals are sent to the discrete-time integrator to track the charge, which then aids in the calculation of the state of charge.
The positives of this are its simplicity and cheap capital cost, while the disadvantages include a buildup of current sensor error and its inability to recover from the erroneous start condition. due to a lack of voltage measurement feedback
----------------------------------x----------------------------------------x--------------------------------------