Week 7: Shock tube simulation project
SHOCK-TUBE PROBLEM :-
Objective:
- To setup a shock tube transient simulation.
- Plot the pressure and temperature history in the entire domain.
- Plot the cell count as a function of time.
- To show the mesh generation using PARAVIEW
- To create velocity, pressure and temprature animation.
What are shock tubes ?
Shock tubes are devices for studying the flow of high-temperature and high-velocity compressible gas.A high-temperature supersonic gas flow is initiated in a shock tube as a result of rupture of a diaphragm separating two gases in high-pressure and low-pressure chambers.
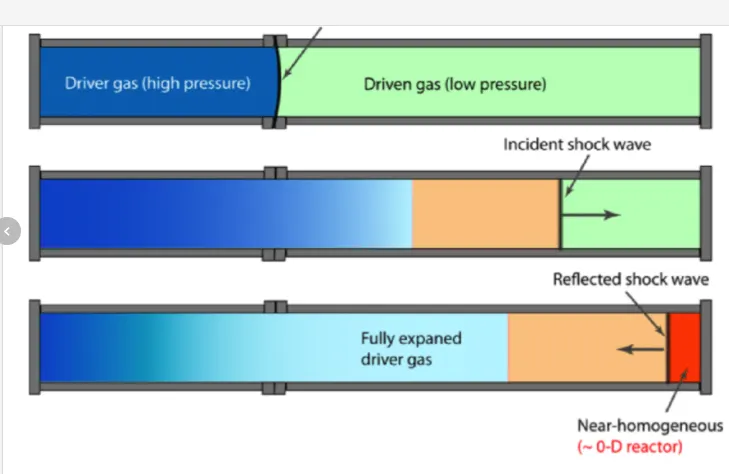
- (1) Shock tubes with an inert gas in the high-pressure chamber.
- (2) Shock tubes with an explosive in the high-pressure chamber.
- (3) Electrically driven shock tubes.
- (4) Shock tubes with shock wave enhancement.
Shock-tube figure
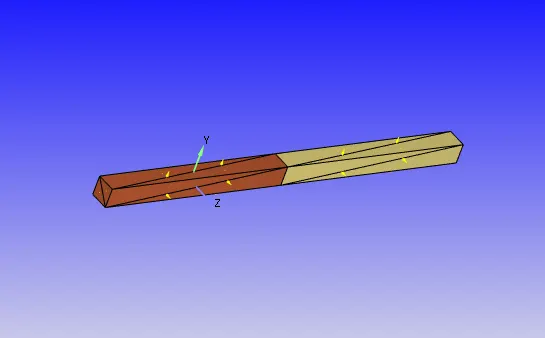
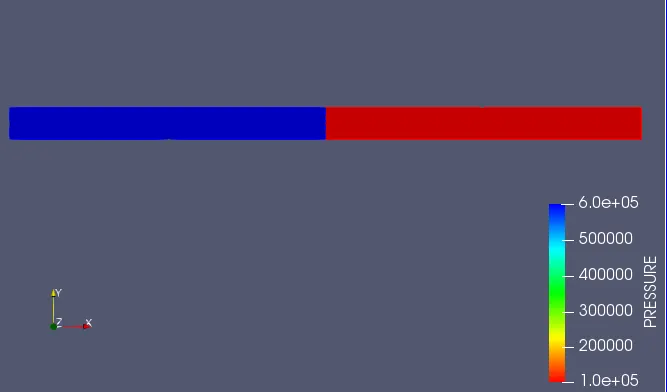
Half left of box is high-pressure region and half right of box is low-pressure region. Gases will flow from high to low pressure region, this creates a shock wave.
Run parameters
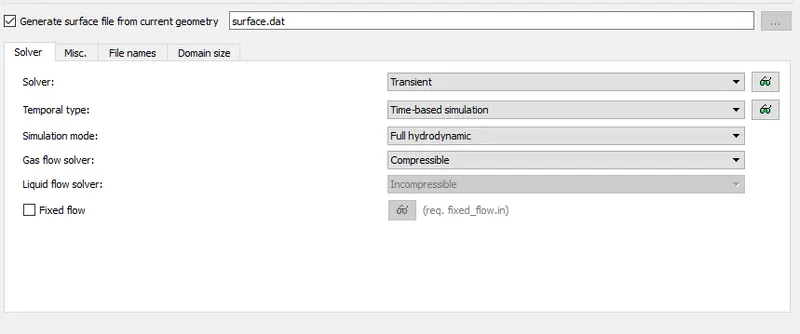
This is a transient simulation and a transient simulation is time-based simulation , since there are no moving parts simulation is going to be full hydrodynamic.
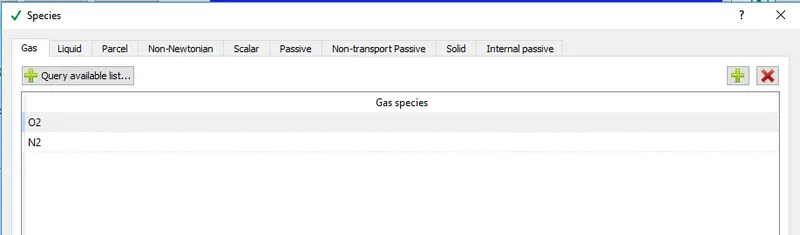
Species
Mixture in our simulation is air, and air contains oxygen and nitrogen, So our species here is O2 and N2.
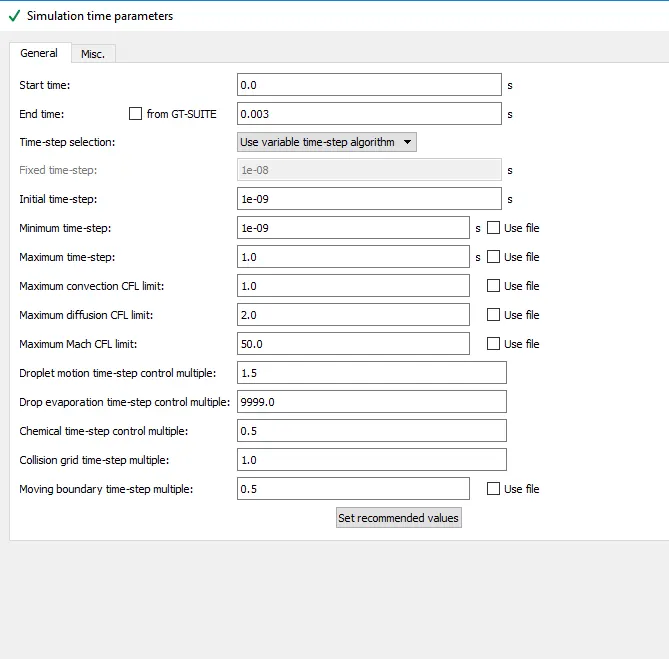
Simulation time parameters
Regions
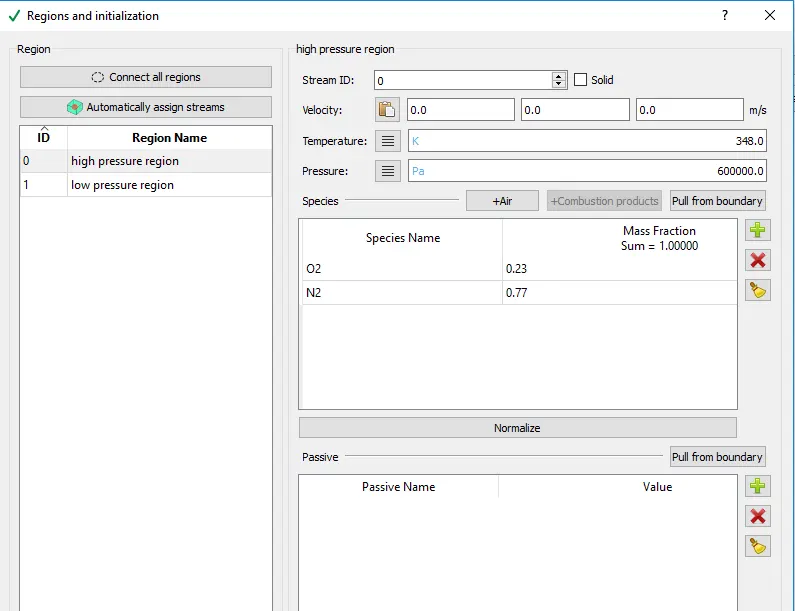
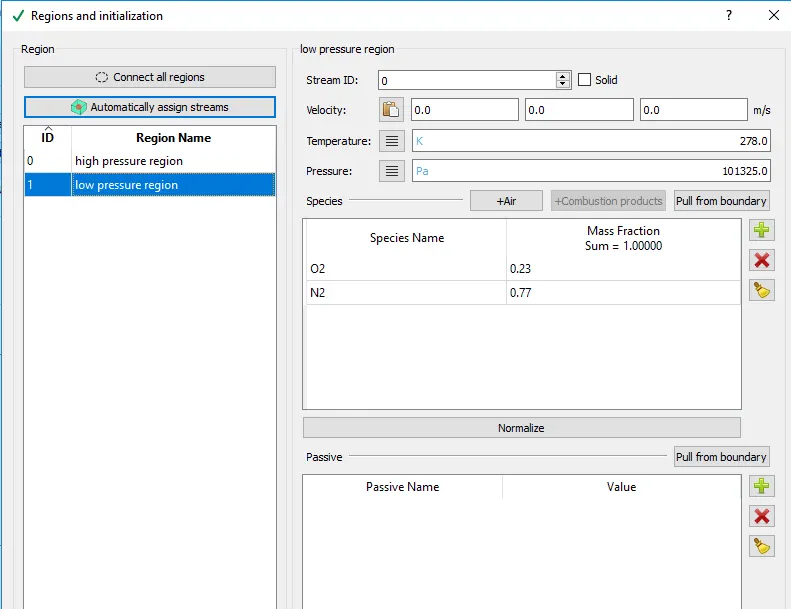
Figure contains two regions , half part is high pressure region and other half is low pressure region. so in regions and initialisation create two regions, pressure in high pressure region is higher than low presssure regions. Velocity is also higher in high pressure region than low pressure region.
Boundaries:
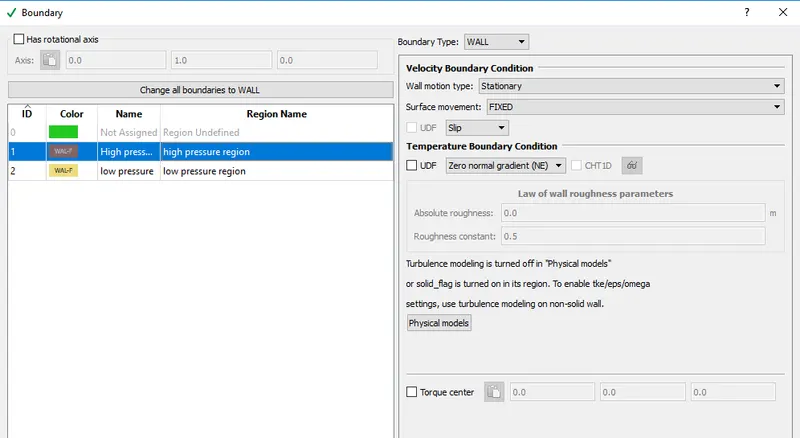
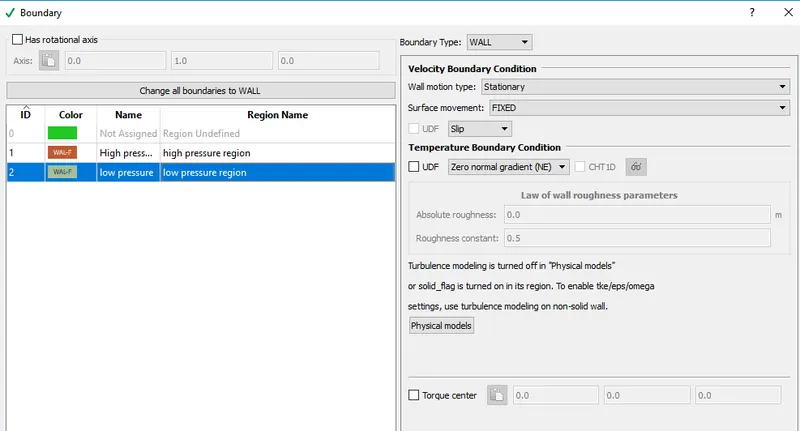
Boundraies are wall type and slip boundaries and neumann boundary condition is used since we dont know initial conditions.
Events:
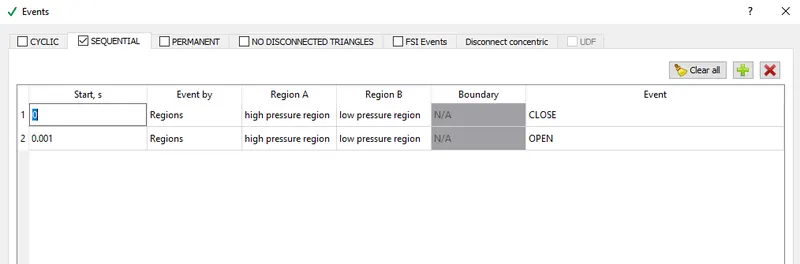
Events are used when we have to seperate two regions and have to decide at what time flow will starts to take place between any region.
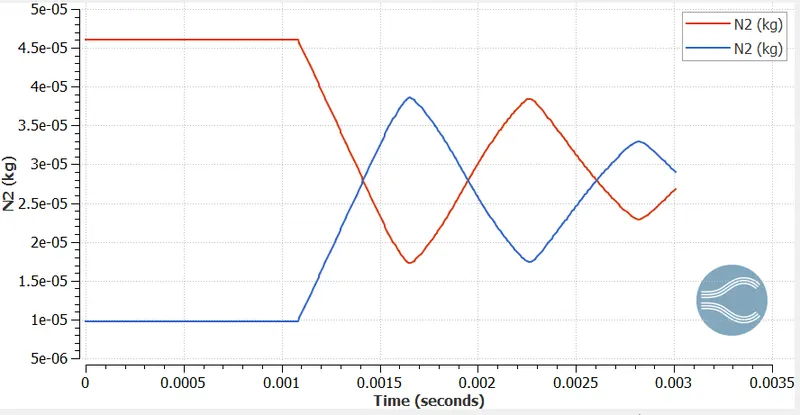
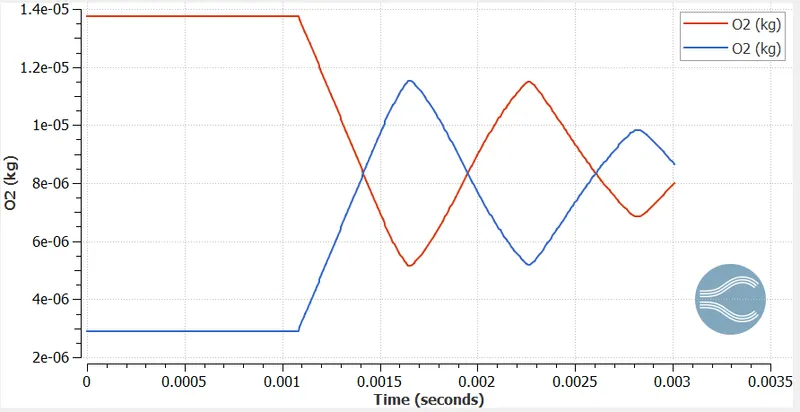
Here, at time step 0 both regions are closed and time step 0.001 seconds gate between regions opens and flow starts to take place.
Base grid
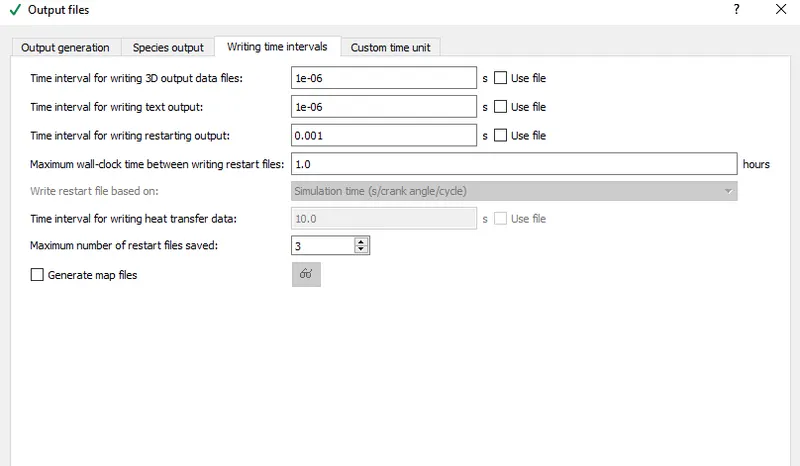
Output Files
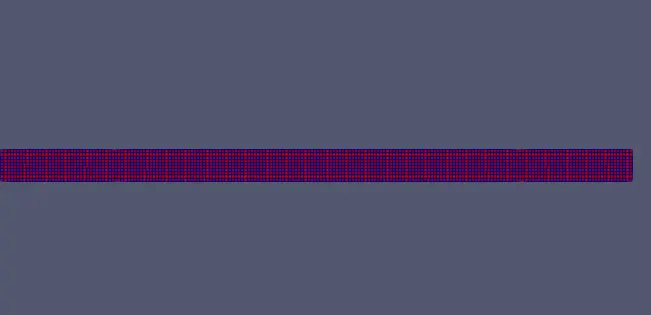
Grid
High and Low pressure regions
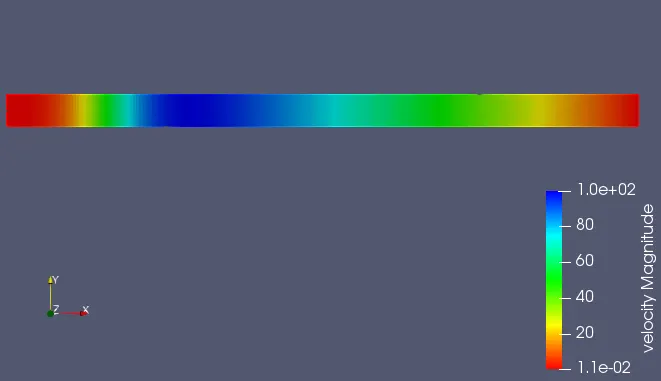
Velocity contour
As flow starts to takes place velocity varies continiously along the length of tube and shocks are created throughout its way in the tube.
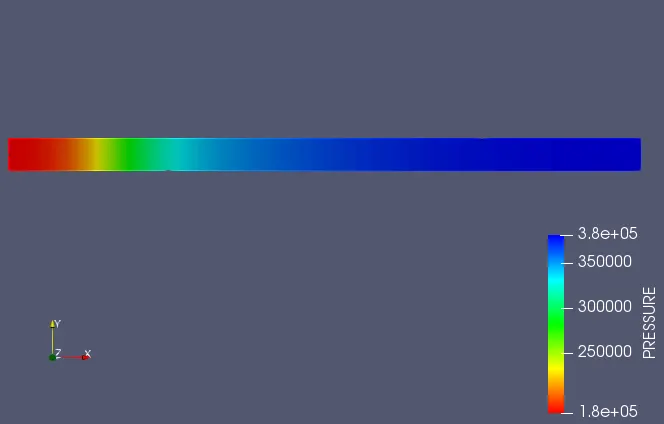
Pressure contour
PLOTS:
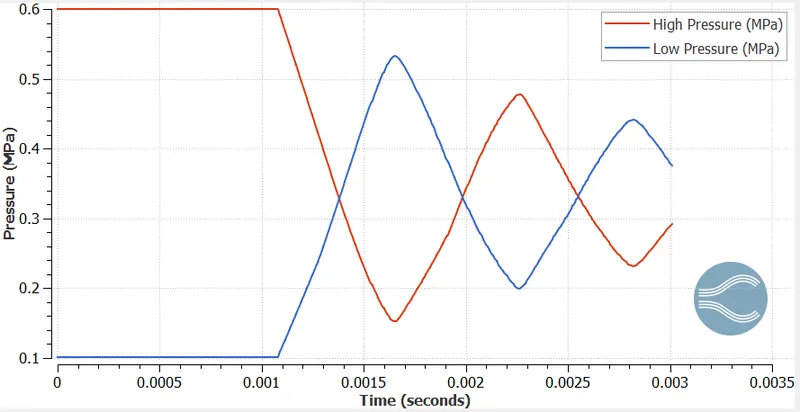
Pressure
Pressure of high pressure region decreases with increase in pressure of low pressure region and after flow returns back after colliding on the wall then again pressure changes takes place from low pressure region to high pressure region. pressure in high and low pressure region eventually comes to ideal condition when flow comes still after some time.
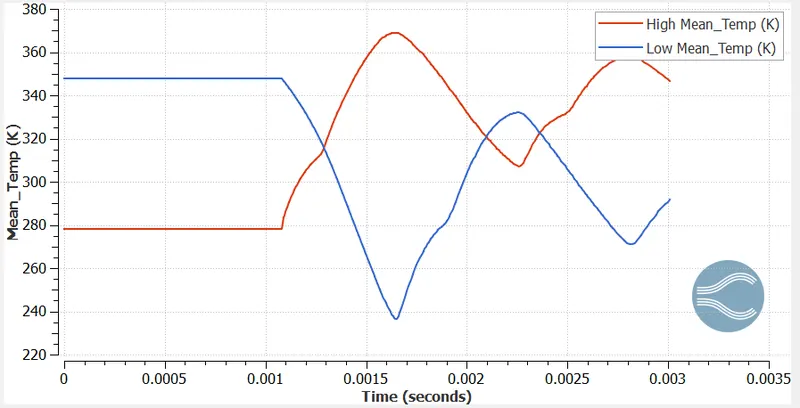
High Mean-Temp
Initially, temprature of high pressure region decreases with start of flow because of fall in pressure in high pressure region and colllision of flow takes place from wall of low pressure region and returns back to high pressure region increasing temprature and after some time temprature varitaion comes to a halt after flow stops to take place between regions due to loss of inertia in flow.
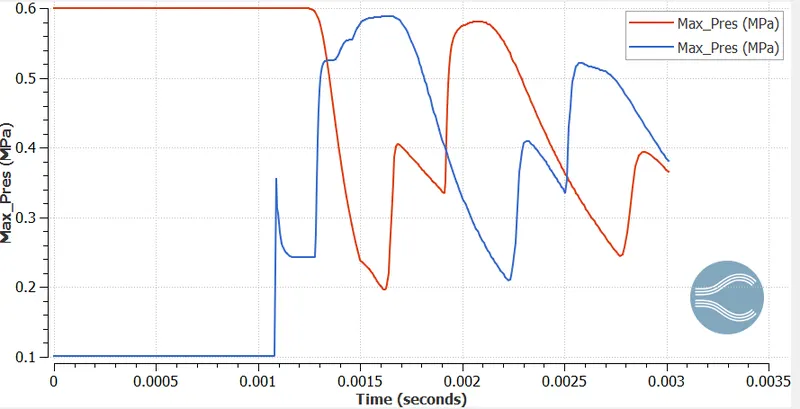
Max pressure
Species mass N2
Species mass O2
VELOCITY ANIMATION
https://drive.google.com/file/d/1mh4r_huMBJUtncgAfjfcjIJLsgS4Lium/view?usp=sharing
In the animation we can se how flow hits back back after collision and how velocity changes in tube and shocks are created on its way back after collison.
TEMPRATURE ANIMATION
https://drive.google.com/file/d/1lOg96WWBwNApqS8pm_4JJLBdDY_Ra5yO/view?usp=sharing
PRESSURE ANIMATION
https://drive.google.com/file/d/1b_CGz9fWywul0n73ZNzNLCcHb-nrDqZd/view?usp=sharing
CONCLUSION
- Shock waves are created after collision on walls.
- Decrease in pressure leads to increasse in velocity.
- Flow starts to take place only after burst of diagram.