Project 1 - Parsing NASA thermodynamic data
What is file parsing?
- file parsing is used to extract useful data from data file by reading data file line by line, and then extracting value information when required from any line.
FILE PARSING CODE TO EXTRACT COEFFICENT VALUE OF EACH SPECIES FROM NASA DATA FILE.

Above is the formula we will use to calculate value of cp, H & S for each species given in nasa data file.
NOTE: There are 14 coefficient for each species in nasa data file, from which first 7 are high temp coefficient and second 7 are low temp coefficient.
close all
clear all
clc

f1 = fopen('THERMO.dat','r')
%read first line
fgetl(f1);
%read second line which contains tempratures
A = fgetl(f1);
A1= strsplit(A,' '); %split temprature line string using strsplit command

% converting string values into numbers using str2num command
global_low_temp = str2num(A1{2});
global_mid_temp = str2num(A1{3});
global_high_temp= str2num(A1{4});

%skipping the next three header lines
for i = 1:3
   L = fgetl(f1);


end

%reading the species block
%species block containts 53 species so we could run 1:53 for loop to read
%all species
for j = 1:53
    species = fgetl(f1);
    l = strsplit(species,' ');
     b = l(1);
    a = length(l);
    local_Mid_temp = str2num(l{a-1});
    local_High_temp = str2num(l{a-2});
    local_low_temp = str2num(l{a-3});

    %reading 1st coefficient line
    l1 = fgetl(f1);
    p = strfind(l1,'E'); % we get 5 positions of E which is 12,27,42,57,72

    a1 = l1(1:p(1)+3);  % p(1) represents 1st position of E, simliar goes goes p(2)..p(5)
    a2 = l1(p(1)+4:p(2)+3);
    a3 = l1(p(2)+4:p(3)+3);
    a4 = l1(p(3)+4:p(4)+3);
    a5 = l1(p(4)+4:p(5)+3);

    a1 = str2num(a1); % to convert string coefficient to number coeff
    a2 = str2num(a2);
    a3 = str2num(a3);
    a4 = str2num(a4);
    a5 = str2num(a5);

    %reading second  coefficient line

    l2 = fgetl(f1);
    p1 = strfind(l2,'E');

    a6 = l2(1:p1(1)+3);
    a7 = l2(p1(1)+4:p1(2)+3);
    a8 = l2(p1(2)+4:p1(3)+3);
    a9 = l2(p1(3)+4:p1(4)+3);
    a10 = l2(p1(4)+4:p1(5)+3);

    a6 = str2num(a6);
    a7 = str2num(a7);
    a8 = str2num(a8);
    a9 = str2num(a9);
    a10 = str2num(a10);

    % reading third coefficient line

    l3 = fgetl(f1);
    p2 = strfind(l3,'E');

     a11 = l3(1:p2(1)+3);
    a12 = l3(p2(1)+4:p2(2)+3);
    a13 = l3(p2(2)+4:p2(3)+3);
    a14 = l3(p2(3)+4:p2(4)+3);

   a11 = str2num(a11);
    a12 = str2num(a12);
    a13 = str2num(a13);
    a14 = str2num(a14);

    %first seven coefficient ( a1 to a7) are high temp coefficient
    % next seven coefficient (a8 to a14) are low temp coefficient


    % find enthalpy(H) entropy(S) and specific heat(cp)
   species_name = char(b);


    R = 8.314;
    temprature_range = linspace(local_low_temp,local_High_temp,500);
    T = temprature_range;
    k = 1:length(T);

    for k = 1:length(T)
        if T(k)>1000
            cp(k) = R*(a1 + a2*T(k) + a3*T(k).^2 + a4*T(k).^3 + a5*T(k).^4);
            H(k) = (R*T(k))*(a1 + a2*T(k)./2 + a3*(T(k).^2)./3 + a4*(T(k).^3)./4 +a5*(T(k).^4)./5 +a6./T(k));
            S(k) = R*(a1.*log(T(k)) + a2.*T(k) +a3.*(T(k).^2)/2 +a4.*(T(k).^3)/3 +a5.*(T(k).^4)/4 + a7);
        else

            cp(k) = R*(a8 + a9.*T(k) + a10.*T(k).^2 + a11.*T(k).^3 + a12.*T(k).^4);
            H(k) = (R.*T(k)).*(a8 + a9.*(T(k))./2 + a10.*(T(k).^2)/3 + a11.*(T(k).^3)/4 +a12.*(T(k).^4)/5 +a13./T(k));
            S(k) = R*(a8.*log(T(k)) + a9.*T(k) +a10.*(T(k).^2)/2 +a11.*(T(k).^3)/3 +a12.*(T(k).^4)/4 + a14);

        end
    end


    figure(1)
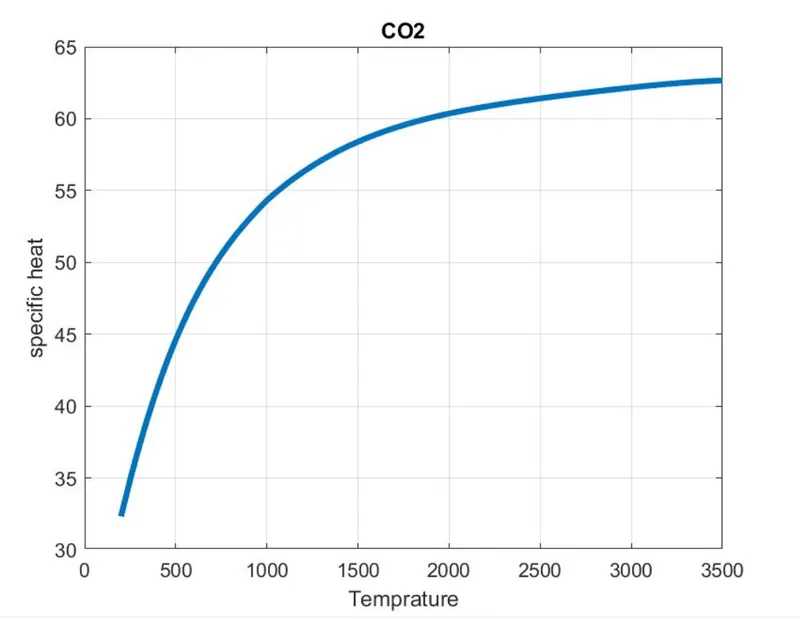
    plot(T,cp,'linewidth',3)
    xlabel('Temprature')
    ylabel('specific heat')
    title(species_name)
    grid on

    figure(2)
    plot(T,H,'linewidth',3)
    xlabel('Temprature')
    ylabel('Enthalpy')
    title(species_name)
    grid on

    figure(3)
    plot(T,S,'linewidth',3)
    xlabel('Temprature')
    ylabel('Entropy')
    title(species_name)
    grid on

    mkdir(['C:\Users\faisa\OneDrive\Desktop\file parsing\nasa data\plots\',species_name])
    cd(['C:\Users\faisa\OneDrive\Desktop\file parsing\nasa data\plots\',species_name])

    saveas (1,'specific heat.jpg')
    saveas (2,'enthalpy.jpg')
    saveas (3,'entropy.jpg')

fprintf('molecular weight of')
fprintf(species_name)
fprintf(':')

Atoms = [ 'H', 'C' , 'O' , 'N', 'A'];
Atomic_wt = [1,12,16,14,40];
mm = 0;
for i = 1:length(species_name);
    for j = 1:length(Atoms);

       if strcmp(species_name(i),Atoms(j));

        mm = mm+ Atomic_wt(j);
        p = j;
       end
    end
    a = str2num(species_name(i));
    if a>1
        mm = mm + Atomic_wt(p)*(a-1);
    end
end
fprintf('%d',mm)
disp(' ')


end
Explaination of code-
- use fopen command to open file THERMO.dat and save it in variable f1
- use fgetl command to read first line of data. you can use fgetl command again to read next line of data
- First three tempratures in data file are global tempratures, use fgetl command 2nd time to read that line.
- global tempratures are string values and we have to split them and then convert them into numeric values, use strsplit command to split it.
- after splitting use str2num command to convert them to numeric values. 2,3 and 4 are positions of all three global tempratures in data file, so that why str2num(A{2}) gives first global tempratre and 3&4 gives next 2 global tempratures.
- Next three lines after global tempratures are header lines which we dont require so we will use for loop to skip those three lines.
- use for loop to read all 53 species given data file and write your code inside this loop
- use fgetl command command to read local temprature line, use split command to split string values.
- b =l(1) means first position of line l which is species name, we will this b later in this code.
- use a = length(l) to read length of local temp line which is 9, and then (9-1) gives last local mid temp, (9-2) gives local high temp and (9-3) gives local low temp
- use str2num command to convert those string values into numeric values.
- use l1 = fgetl(f1) command to read next line which is first coefficient line
- use strfind(l1,'E') command to find position of E in first line l1
- l1 = p(1) gives first position of E in line l1 which is first coefficient line. similarly p(2)...p(5) gives all position of E in line l1
- a1 = l1(1:p(1)+3) , this command means reading line l1 from first position till 12th position and then +3 means adding next three values in it...this gives value for first coefficient . use similar logic to extract values for all 5 coefficient. and tehn use str2num command to convert them to numeric values
- l2 = fgetl(f1) to read 2nd coefficient line, l2 = fgetl(f1) to read next coefficient line. Apply same logic as we have used for line l1 and extract coefficent of l2 and l3.
- total 14 values of coeffiecient are extracted, a1, a2,a3............a13,a14. In this a1 to a7 are high temp coefficient and a8 to a14 are low temp coefficient.
- Now, we have already three values of local tempratures, use linspace command to get 500 values between local low temp and local high temp, name it temprature_range.
- T = temprature_range, save temprature range is variable T
- k = 1:lenth(T) to read all 500 values of T
- now run a if loop, if loop are used to give conditions, like in this case if k>1000 (temprature above 1000) use high temp coefficients (a1 to a7) to calculate values of cp,H & S. otherwise use low temp coefficent (a8 to a14) to claculate values of cp, H & S.
- T(k) means we are assingning a single value from 500 values of T at a time and this will go for 500 times so that values of cp,H &S are calculated for all 500 values of T.
- plot the values of cp, H & S against T
- after plotting use mkdir command to save all of them in seperate folder, create a folder first and then give that folder location in mkdir command , inside this folder all plots are going to be saved. Also provide folder name in mkdir command so that each folder can be saved with specific name.
- here folder name is species_name, but we have previously wriiten species_name = char(b), char b is command which represent chracter and here char(b) is use to save all the characters from data table...by characters means name of species.
- cd command is used to change directory.... like after saving plot for species O we need to create new folder to save plot for next species , so cd command is used to change directory and create new directory for all 53 species
- use saveas command to save plots of cp, enthalpy and entropy.
- Next line from here till last line in code is for calculating the molecular weight of compounds.
- fprintf command is used when you want a wriiten text line as an output. so, we have used fprintf command to write print our text line.
- Atoms = [ 'H', 'C' , 'O' , 'N', 'A']= mention the atoms which are there in our data file
- Atomic_wt = [1,12,16,14,40]= mention the atomic weight of above atoms, A is for argon.
- give initial molecular weight mm=0
- we will run two for loops, one for Atoms and another for Atomic_weight.Upto this point you already know why we use for loop.
- strcmp command is used to compare string values for equality, here we are comparing Atoms and Atommic_wt of each element.
- if loop is used so that molecular mass of more than one atoms of an elent can calculated. eg in H2O we have 2 atoms of H2, if we will execute the code without using if loop, we get molecular mass H2O as 17 because our code had cconsidered only 1 atom of H and has given result by adding 1 atom of H and 1 atom of O. so if loop states that if n>1 (n = no of atoms), then it will consider those atoms too while gving molecular mass.
- fprintf('%d',mm) = this command is to print integer value which is molecular wiight of atoms.
PLOTS of O2, N2 & CO2 for cp, H ,S are gievnn below:
O2
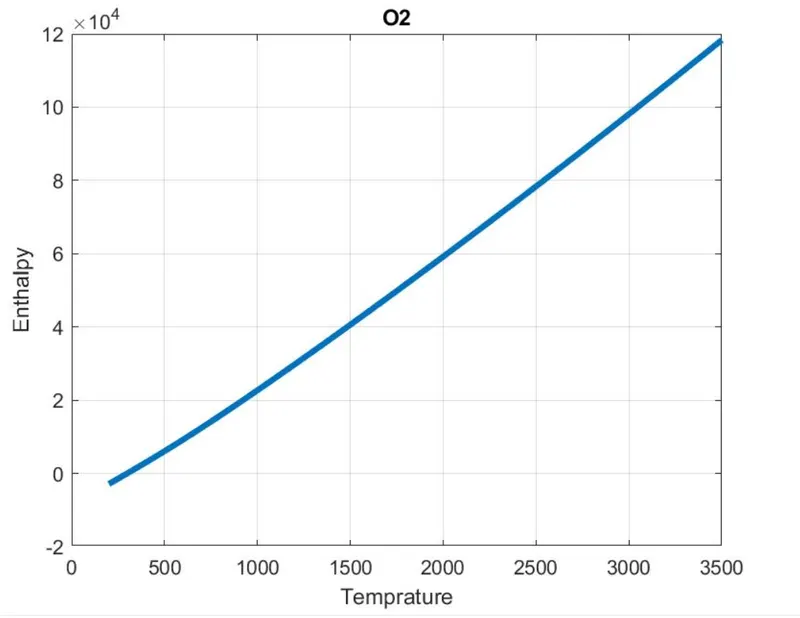
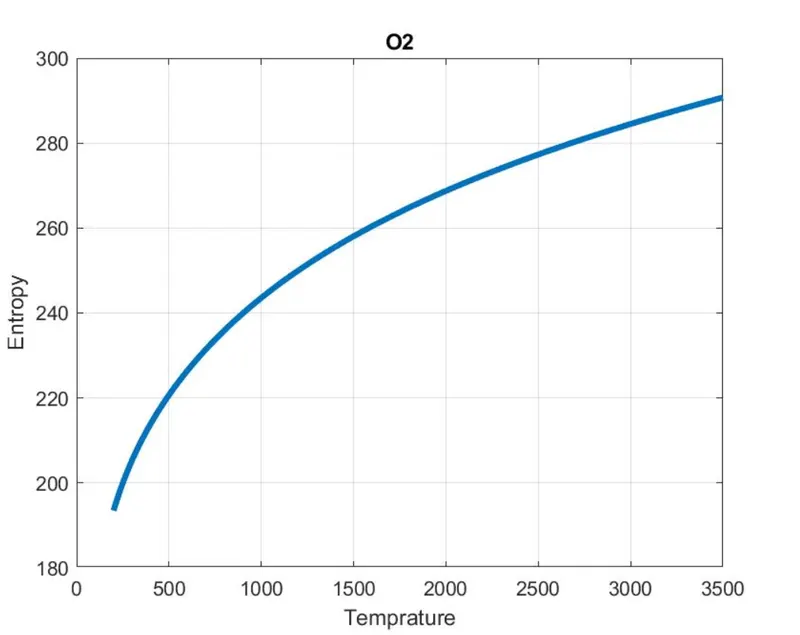
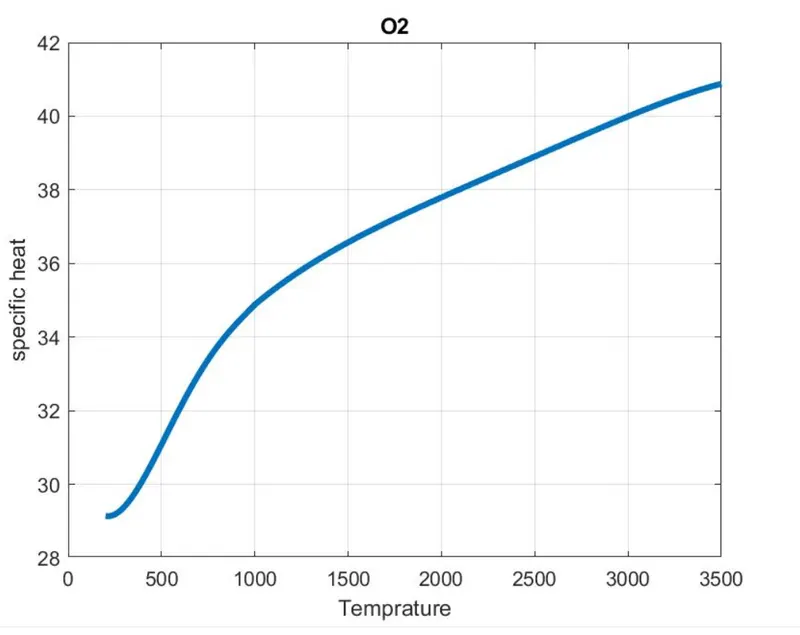
N2.
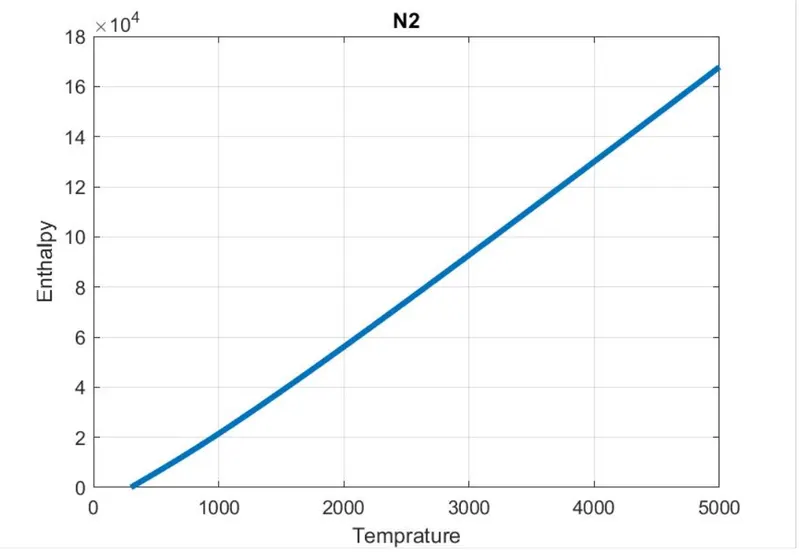
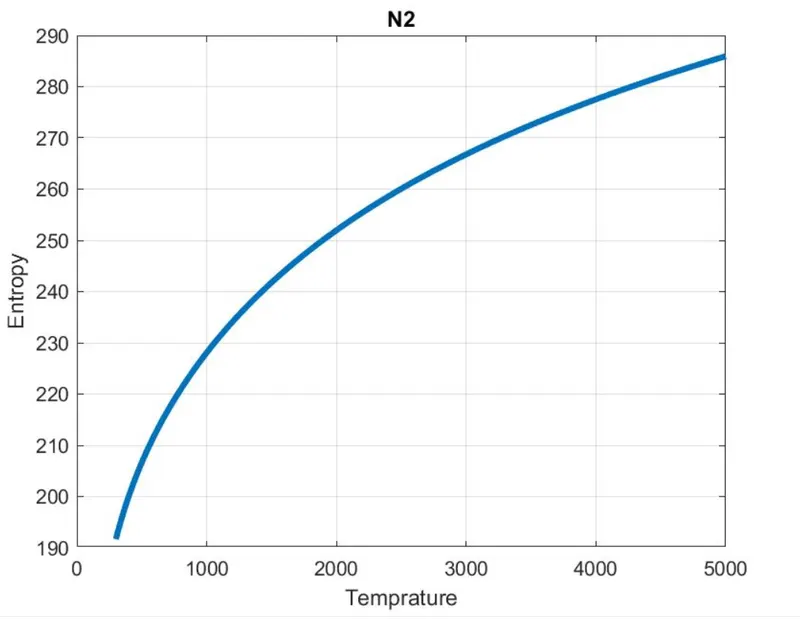
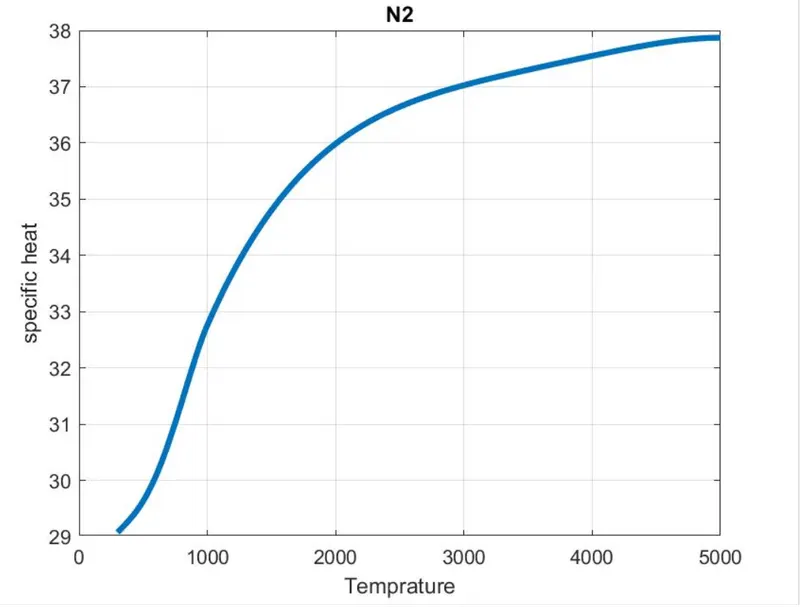
CO2.
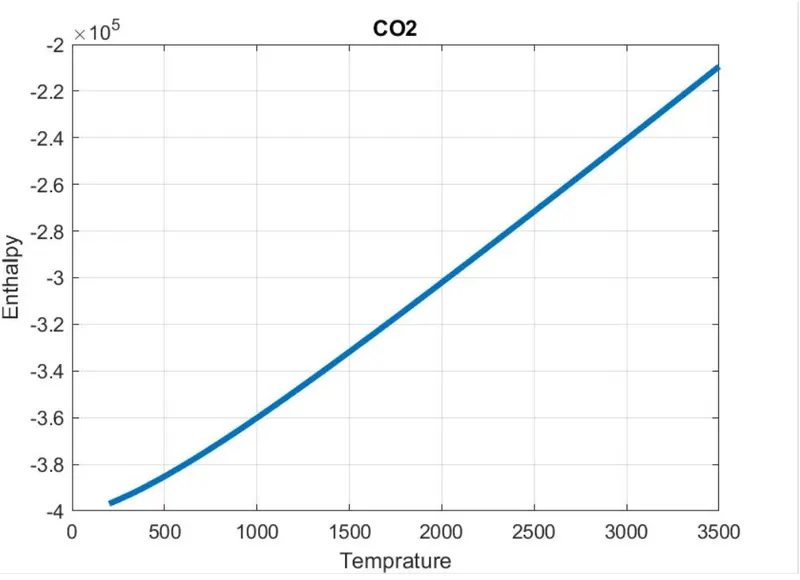
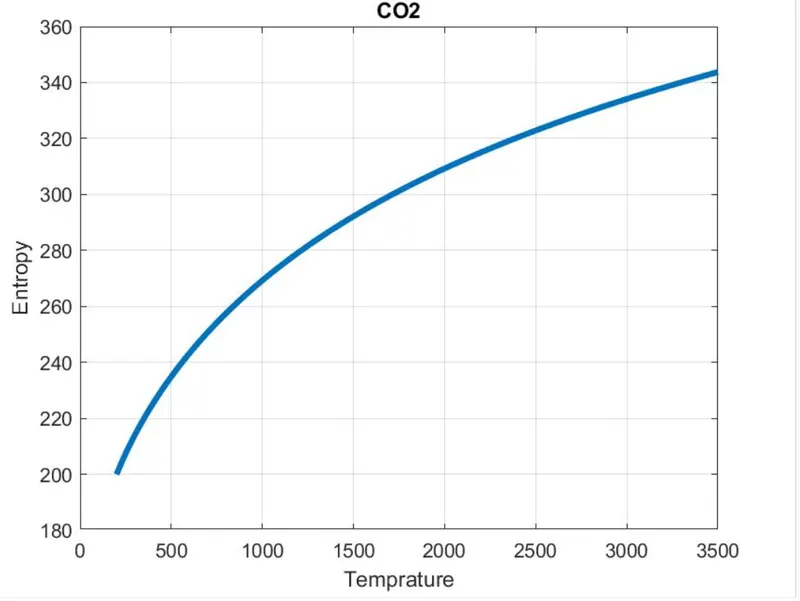
FOLDER WHERE ALL PLOTS ARE SAVED.

ERRORS FACED WHILE PROGRAMMING
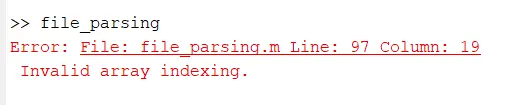
- used wronng variable for loop
- faced error with mkdir command, i was not clearly specifying the folder location, so didnt got seperate folder for each species.
- cd command- here also faced error because not giving proper inputs.