Week 3 - Solving second order ODEs
We are solving below equation which is a 2nd order differential equation, this equation represents movement of pendulum w.r.t time.
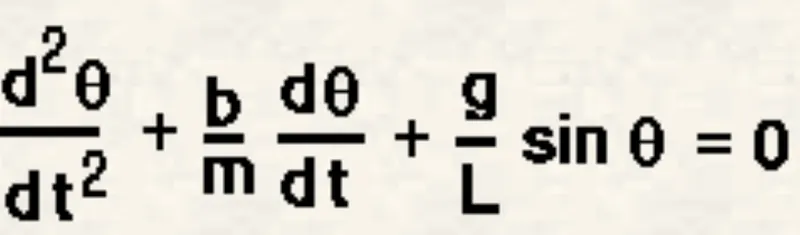
In MATLAB we will first write above equation in form of MATLAB code, below is the code for above equation.
function [dtheta_dt] = ode_fun(b,g,l,m,t,theta)
theta1 = theta(1);
theta2 = theta(2);

 dtheta1_dt = theta2;
 dtheta2_dt = (-b/m)*(theta2) - (g/l)*sin(theta1);

[dtheta_dt] = [dtheta1_dt;dtheta2_dt]
end
Explaination of code-
Any function code, contains a formulae & inputs for that function
Inputs here are- g (gravity),d (damping coefficient), L (length of pendulum strip), m (mass of pendulum), theta(displacement), t (time)
ode_fun is name given to function
while solving any higher order ode we break it into smaller ode, similarly we will break this 2nd order ode into two ,1st order ode.
now how to convert 2nd order ode into 1st order -
let, theta = theta1
dtheta/dt= dtheta1/dt .......(i)
dtheta1/dt = theta2 .........(ii)
putting above equations in main equation...we get
dtheta^2/dt^2 + (b/m)dtheta/dt + (g/l)sin(theta)
= d(theta2)/dt + (b/m)theta2 + (g/l)sin(theta1).......(iii)
arranging eqation (iii) in form of array...
d/dt[theta1;theta2] = [theta2;(-b/m)theta2 (-g/l)theta1]
NOW FOR CODE-
theta1 = theta(1)
theta2 = theta(2)..... we have provided values of theta in theta 1 & theta 2.....as theta for both theta 1 & theta 2 are same
now according to equation (ii) & (iii)
dtheta1_dt = theta2
dtheta2_dt = (-b/m)*theta2 - (g/l)*sin(theta1)
dtheta_dt = [ theta2; (-b/m)*theta2 - (g/l)*sin(theta1)]....arranged in form of array
Below is the code to simulate the pendulum motion and create an animation of its motion
close all
clear all
clc
b = 0.05;
l = 1;
m = 1;
g = 9.8;
theta_d = [0;3];

time_span = linspace(0,20,1000);

[t,result] = ode45(@(t,theta) ode_fun(b,g,l,m,t,theta),time_span,theta_d);

hold on
figure(1)
plot(t,result(:,1))
plot(t,result(:,2))
xlabel('time')
ylabel('displacement/velocity')
legend('displaceent','velocity')
hold off

x0 = 1;
y0 = 1;
% displacement of pedulum
ct = 1
d_pendulum = result(:,1);

for i = 1:length(d_pendulum)

    x1 = 1- l*sin(d_pendulum(i));
    y1 = 1- l*cos(d_pendulum(i));
    figure(2)

    plot([0 2],[1 1],'linewidth',3)
    hold on
    plot([x0 x1],[y0 y1],'linewidth',2)
    plot(x1, y1,'o','markerfacecolor','g')
    hold off

    axis([ -1 3 0 2])
    grid on
    M(ct) = getframe(gcf);
    ct = ct+1
end
    movie(M)
    videofile = VideoWriter('simple_pendulum.avi','uncompressed AVI')
    open(videofile)
    writeVideo(videofile,M)
    close(videofile)
Explaination of code-
we have assigned values to our inputs b,g,l,m
theta_d = [0;3], here 0 is displacement and 3 is velocity which is stored in dtheta_d
time_span = linspace(0,20,1000), this command is used to get 1000 values between 0 and 20secs
- for loop is used to assign the values of displacement in code to fnd all possible coordinates x1 an y1 will take in 20second time span
[t,results] = ode45(@(t,theta) ode_fun(b,g,l,m,t,theta),time_span,theta_d)
- ode45 is an inbuilt command.
- ode 45 takes t and theta as function handles.
- ode_fun is used to provide all inputs to ode45 solver , which solves for required intervals, here we have decided to solve it for 1000 intervals
- t_span is time interval between 0 and 20
- theta_d is initial condition at t = 0
- t = input of time from 0 to 20 having 1000 intervals
- results = this contains output which contains values of displacement and velocity for 1000 intervals of t.
%plot commands
plot(t,result(:,1)) = it plots values of t against 1st column of result
plot(t,result(:,2)) = it plots values of t against 2nd column of result
NOW, moving to second part of our code which is animation part
x0 & y0 are coordinates from where we want to hang our pendulum.
x1 & y1 are are coordinates for length of pendulum
&plotting
plot([x0 x1],[y0 y1]) = this plot joins x0 x1 y0 y1 to create length of pendulum
plot([ 0 2],[1 1]) = this plot is used to make a hinge from where pendulum is going to be hanging
plot(x1 y1),'o','markerfacecolor','g') = this command is used to attach a bob to pendulum at point x1 y1
- use of hold on & hold off command is reqired here so that one plot does not overwrite other plot
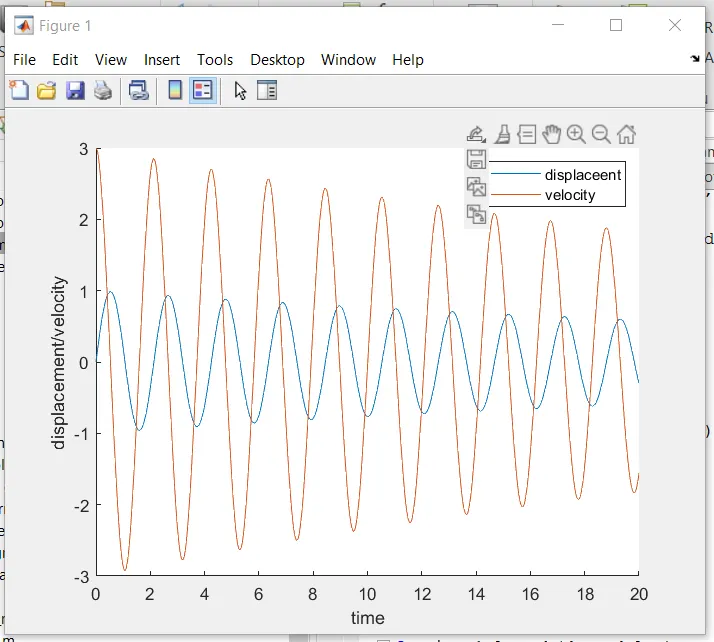
figure(1)
Explaintion-
- displacement & velocity are plotted aginst time
- we can observe that as the time increases displacemnt and velocity decreases
- increase in value of damping coefficint result in decrease of unwanted vibrations
https://drive.google.com/file/d/1Zta815DN0iCkBPr2yamcX8fCFy_NKUwJ/view?usp=sharing
Error faced -
- plot([x1 y1],'o','markerfacecolor') = i was using x1 and y1 inside bracket which was giving me 2 bobs at seperate location of x1 and y1....so dont put x1 and y1 inside bracket for this plot command
- I had assigned wrong values of x0 and y0 which deteroriated my animation by showing only half movement of pendulum.....always choose other point keeping inn mind the values of x1 and y1. dont choose out of range points
- did some mistakes in plotting command by misssing syntax,semi colons etc...which is again a comman error while coding.