Week 7: Shock tube simulation project
SHOCK TUBE SIMULATION PROJECT
Aim:-
To set up a transient shock tube simulation and plot the pressure and temperature of the setup.
Theory:-
Shock Tube:-
The shock tube is an instrument used to replicate and direct blast waves at a sensor or a model in order to simulate an actual explosion and its effects, usually on a smaller scale. shock tubes can also be used to study aerodynamic flow under a wide range of temperatures and pressures that are difficult to obtain in other types of testing facilities. Shock tubes are also used to investigate the compressible flow phenomena and gas-phase combustion reactions. More recently, shock tubes have been used in biomedical research to study how biological specimens are affected by blast waves.
A Shock wave inside a shock tube may be generated by a small explosion or by the buildup of high pressure which causes the diaphragm to burst and a shock wave to propagate down the shock tube.
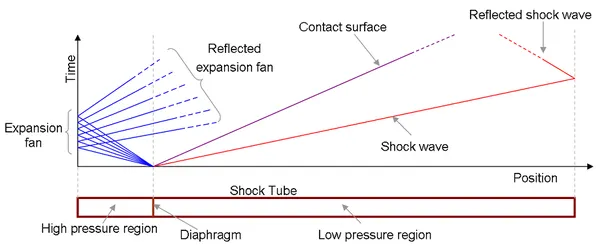
The test begins with the bursting of the diaphragm. Several methods are commonly used to burst the diaphragm.
- A mechanically-driven plunger is sometimes used to pierce it or an explosive charge may be used to burst it.
- Another method is to use diaphragms of plastic or metals to define specific bursting pressures. Plastics are used for the lowest burst pressures, aluminium and copper for somewhat higher levels and mild steel and stainless steel for the highest burst pressures. These diaphragms are frequently scored in a cross-shaped pattern to a calibrated depth to ensure that they rupture evenly, contouring the petals so that the full section of the tube remains open during the test time.
- Yet another method of rupturing the diaphragm utilize a mixture of combustible gases, with an initiator designed to produce a detonation within it, producing a sudden and sharp increase in what may or may not be the pressurized driver. This blast wave increases the temperature and pressure of the driven gas and induces a flow in the direction of the shock wave but at a lower velocity than the lead wave.
A 'Chemical Shock Tube' involves separating the driver and driven gases by a pair of diaphragms designed to fail after pre-determined delays with an end 'dump tank' of the greatly increased cross-section. This allows an extreme rapid reduction in the temperature of the heated gases.
Shock Waves:-
Shock waves are formed when a pressure front moves at supersonic speed and pushes on the surrounding air. Shock waves are not conventional sound waves; a shock wave takes the form of a very sharp change in the gas properties. Shock waves in the air are heard as a loud "crack" or "snap" noise.
SIMULATION PROCESS
A. Geometry Setup:-
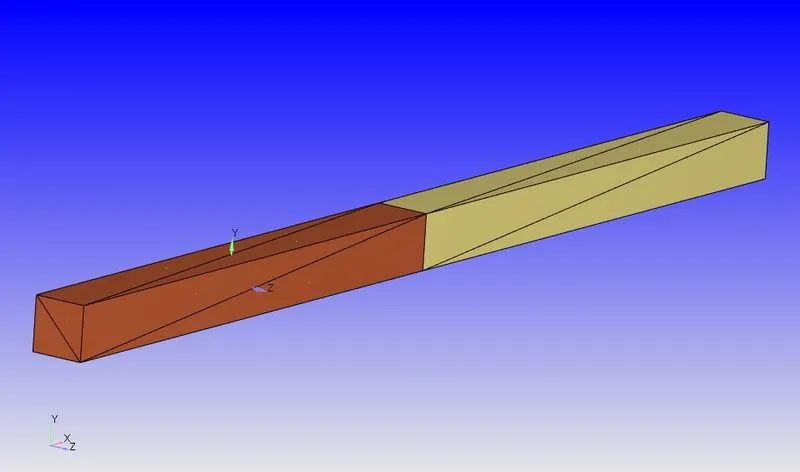
- Import the Shock tube STL.file in converge studio.
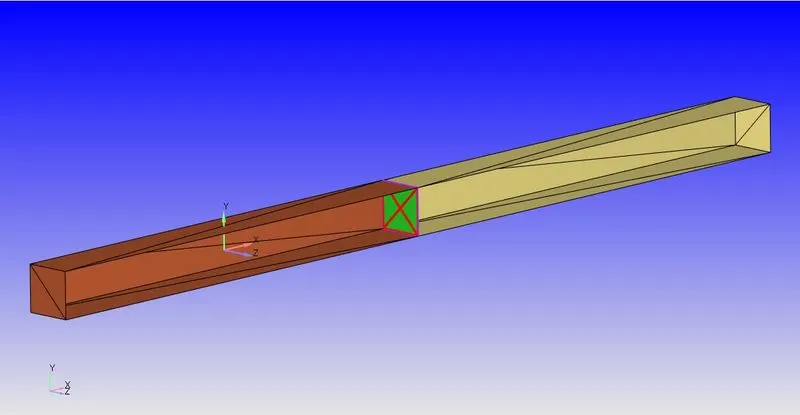
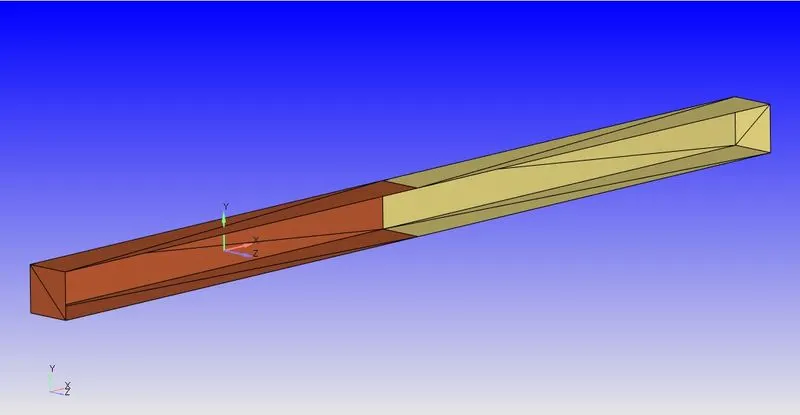
- Delete the Diaphragm in between the two regions.
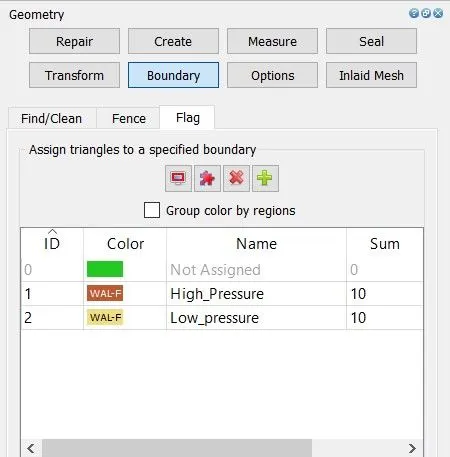
- Create the boundary flagging as high pressure and low-pressure region.
Geometry:-
Boundary Flagging:-
B. Case Setup:-
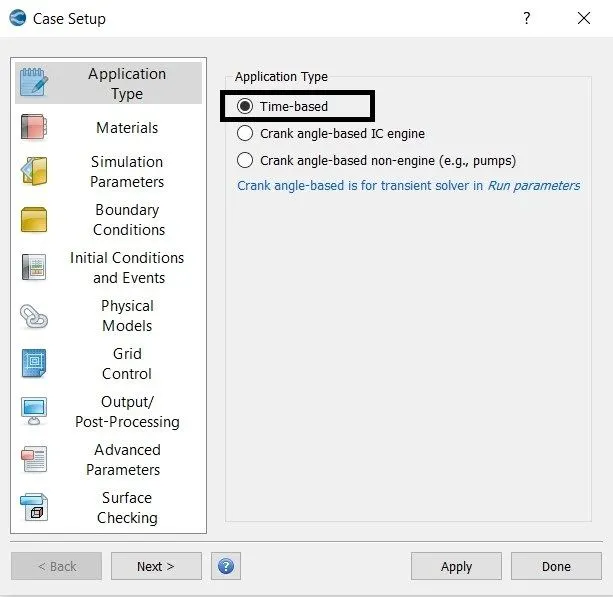
1. Application Type:-
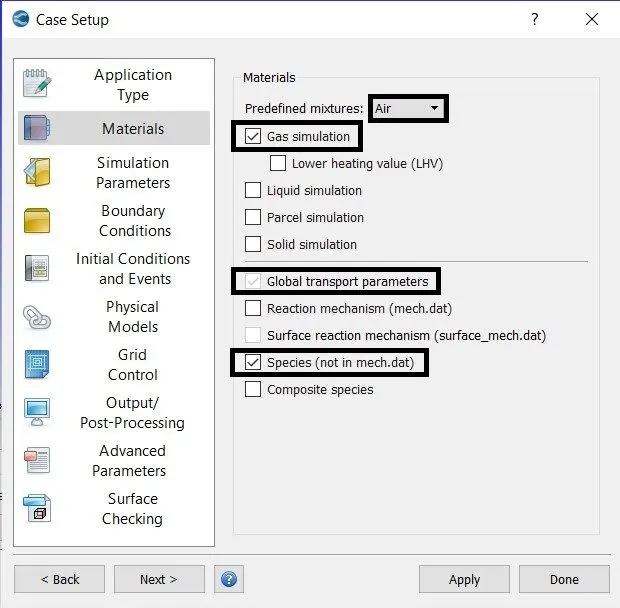
2. Material:-
- Gas Simulation
- Global Transport Parameters
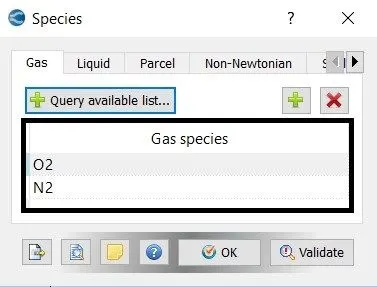
- Species - O2 & N2
3. Simulation Parameters:-
- Run Parameters
- Simulation Time Parameters
- Solver Parameters
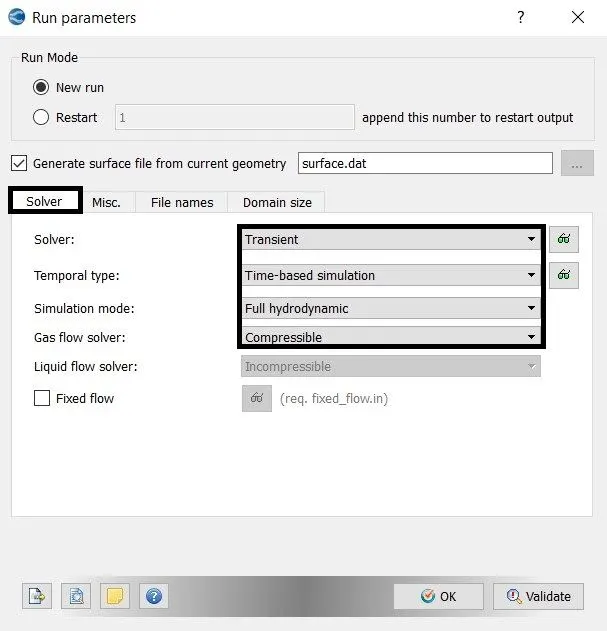
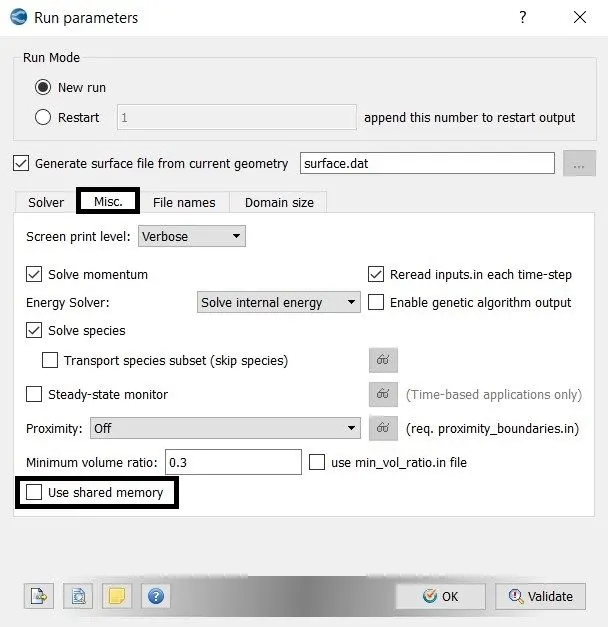
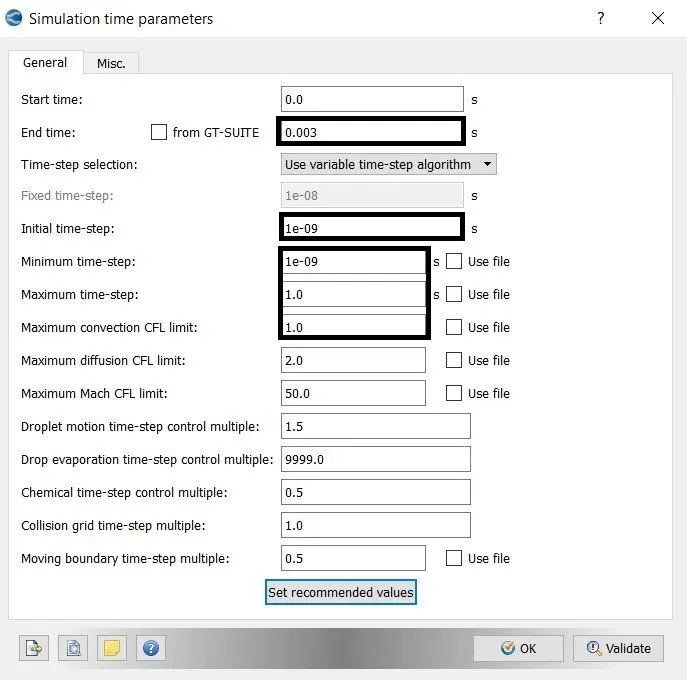
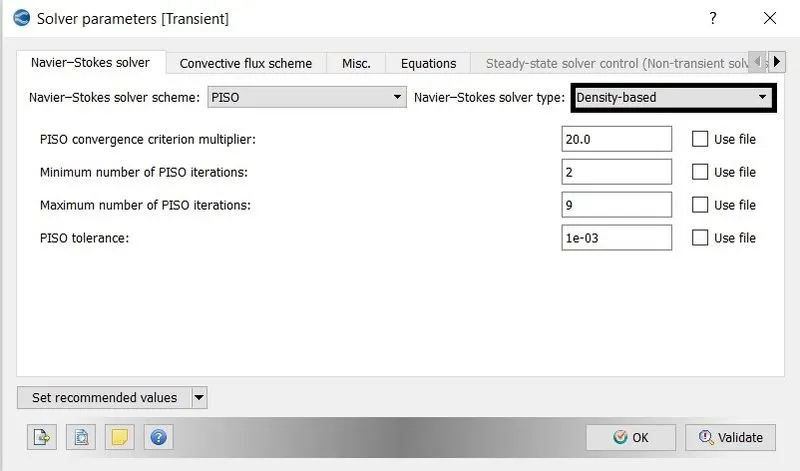
4. Initial Condition and Events:-
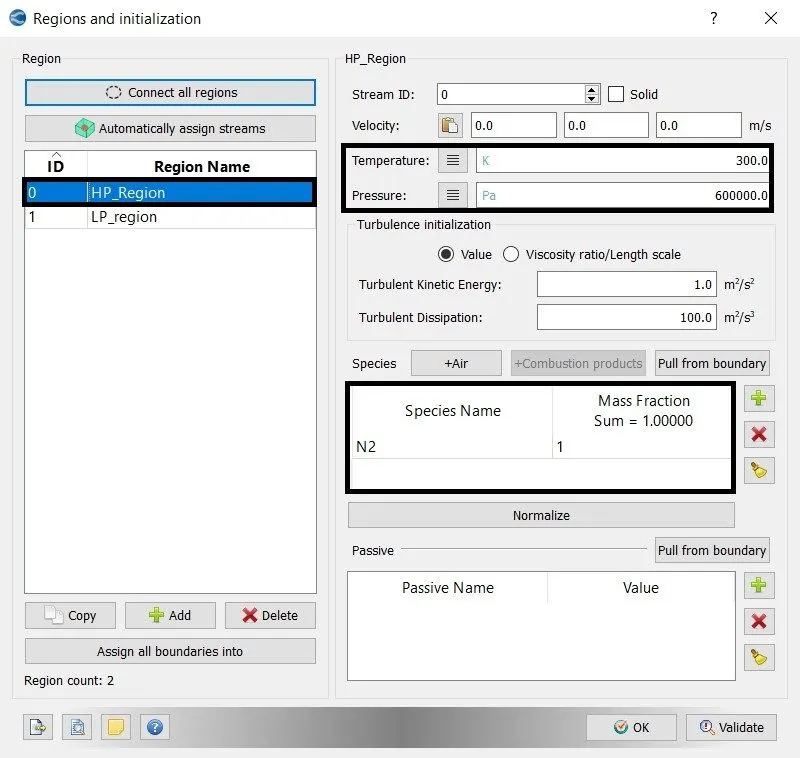
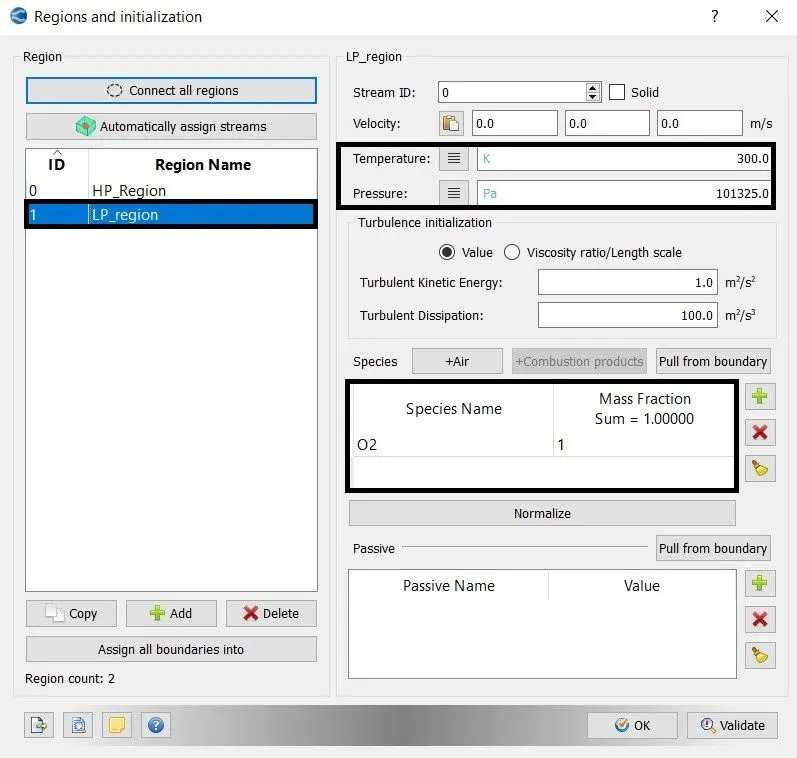
- Region & Initialization
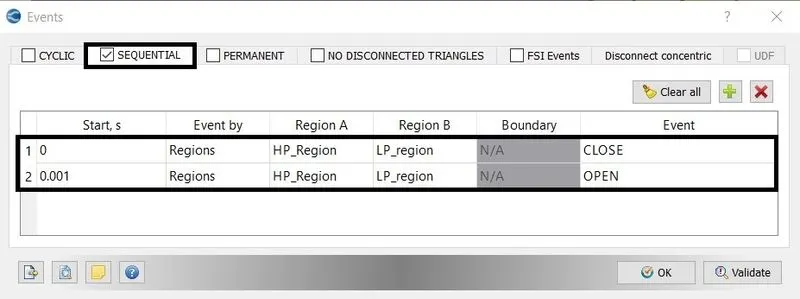
- Events
Region & Initialization:-
- High-Pressure Region - [Pressure - 600000 Pa]
- Low-Pressure Region - [Pressure - 101325 Pa]
Events:-
5. Boundary Conditions:-
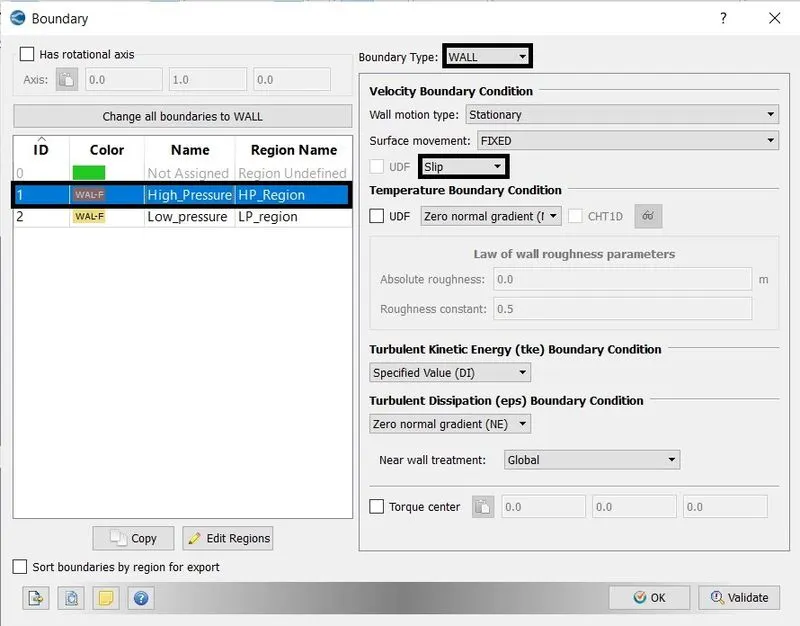
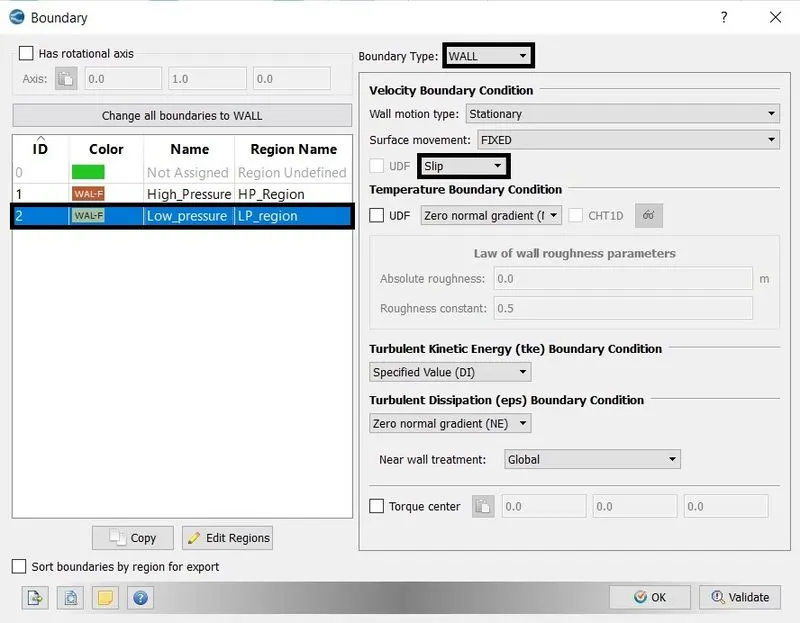
- High Pressure - Wall with slip condition
- Low Pressure - Wall with slip condition
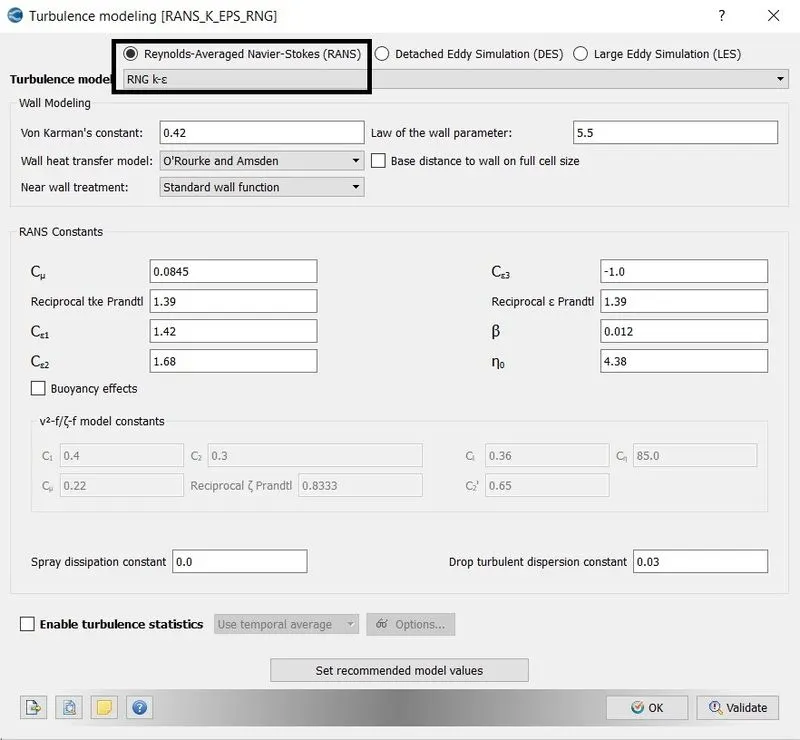
6. Physicals Models
7. Grid Controls:-
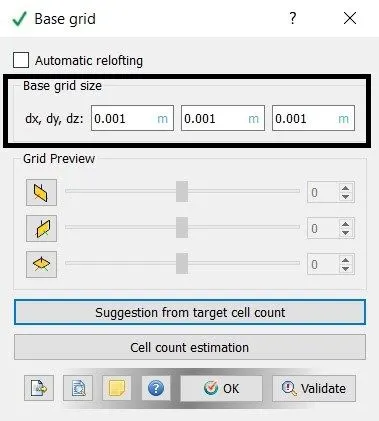
- Base Grid
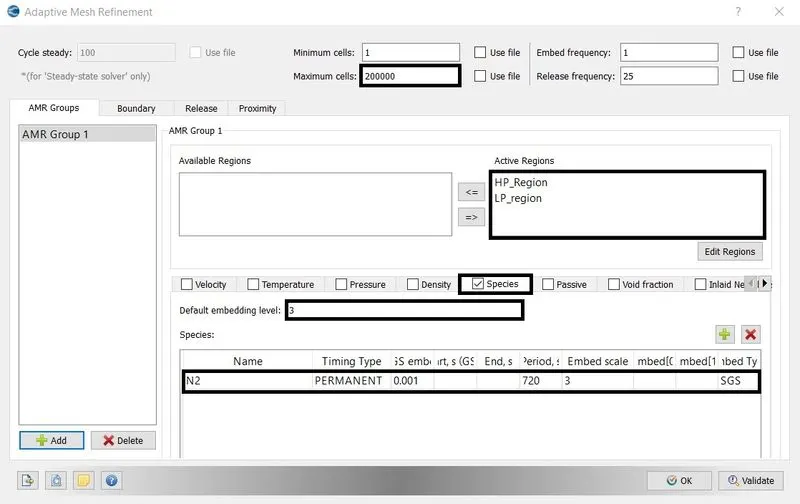
- Adaptive Mesh Refinement
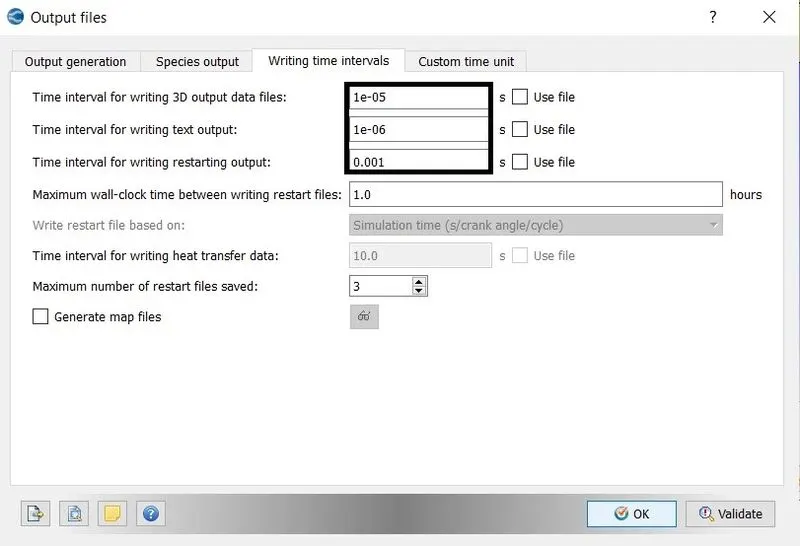
8. Output/Post-Processing:-
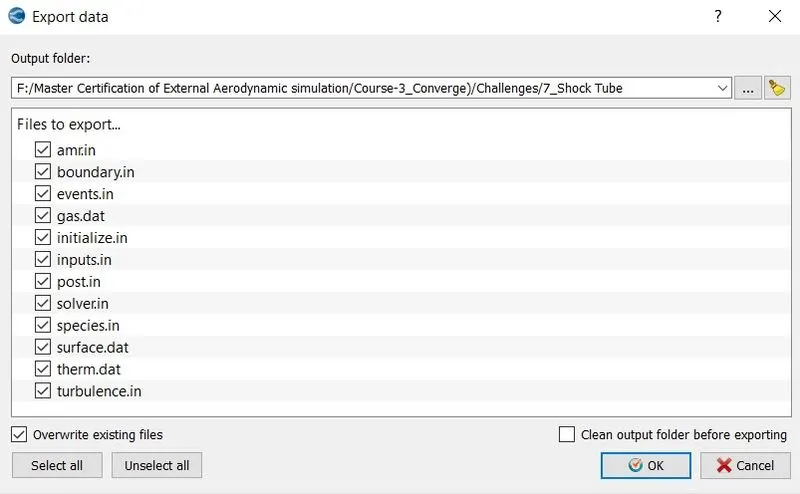
9. Export Data:-
C. Executing the Simulation:-
- The Executable file "mpiexec.exe" and "converge.exe" is pasted in the input files.
- To run the simulation in Cygwin by using the command
mpiexec.exe -n 2 converge.exe restricted </dev/null> logfile &
- After the simulation is complete, the output files can be converted into Paraview VTK in-line binary format to post-process the result in ParaView.
mpiexec.exe -n 2 post_convert_30_msmpi.exe
D. Post-Processing:-
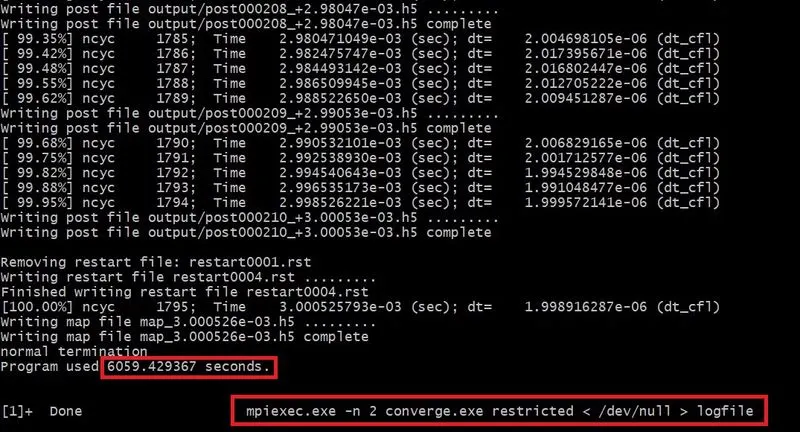
1. Simulation Time:-
2. Meshing:-

3. Contours:-
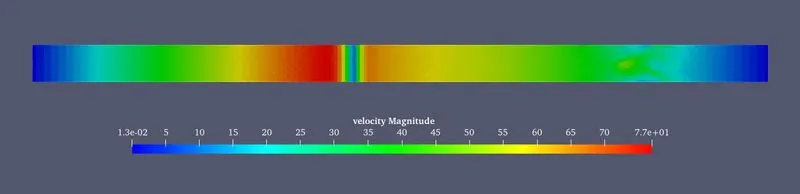
Fig(a). Velocity Contour
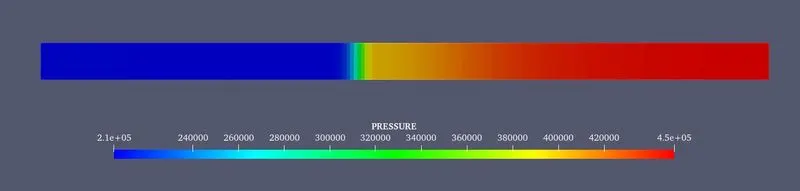
Fig(a). Pressure Contour
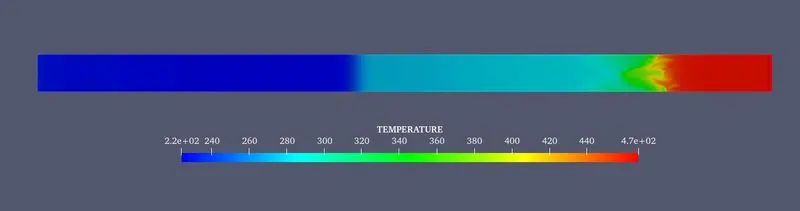
Fig(a). Temperature Contour
4. Line Plots:-
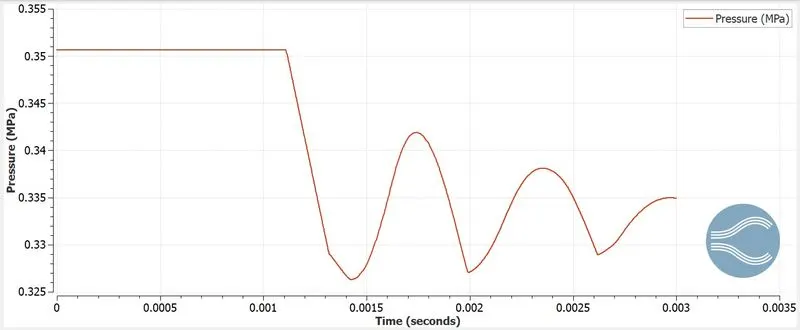
Fig(a). Line Plot of Pressure.
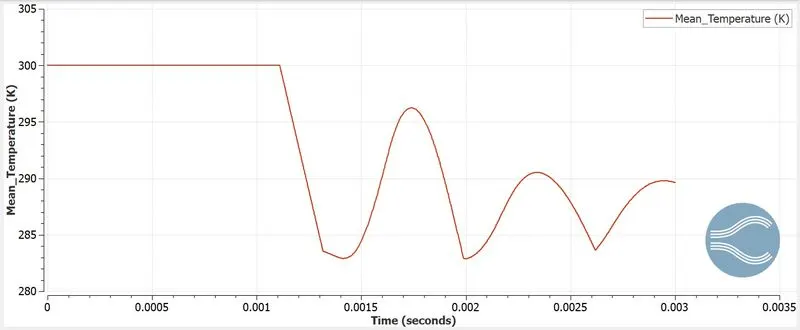
Fig(a). Line Plot of Temperature.
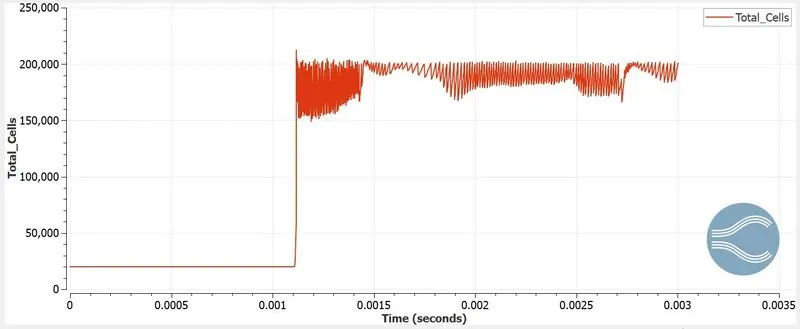
Fig(a). Line Plot of Total Cells.
5. Animation:-
Conclusion:-
- In the Shock tube, the Properties of fluid is observed how the high-pressure region and low-pressure region reacts.
- The grid size of the shock tube is set up to 1 mm and the total simulation time is 6059 seconds.
- The high-pressure region is filled with nitrogen(N2) and the low-pressure is filled with oxygen (O2).
- The diaphragm is removed after 0.001 seconds and the high pressure region and low pressure region are mixed together.
- when the two regions are mixed the shock wave is created. Because the nitrogen gas has a pressure of 6 bar.
- From the Pressure and temperature plot, the flow pattern looks like a shock wave after 0.001 seconds.
- The cell count at the initial stage is 20,000 and after 0.001 seconds it goes up to 200,000 cells and fluctuates till the end of the simulation.
So the Shock tube is used to measure dissociation energies and molecular relaxation rates they have been used in aerodynamics tests. The fluid flow in the driven gas (high-pressure region) can be used much as a wind tunnel, allowing higher temperature and pressure therein replicating conditions in the turbine sections of jet engines. However, test times are limited to a few milliseconds, either by the arrival of the contact surface or the reflected shock wave.