Week 7: Shock tube simulation project
SHOCK TUBE SIMULATION PROJECT
- Setup a transient shock tube simulation
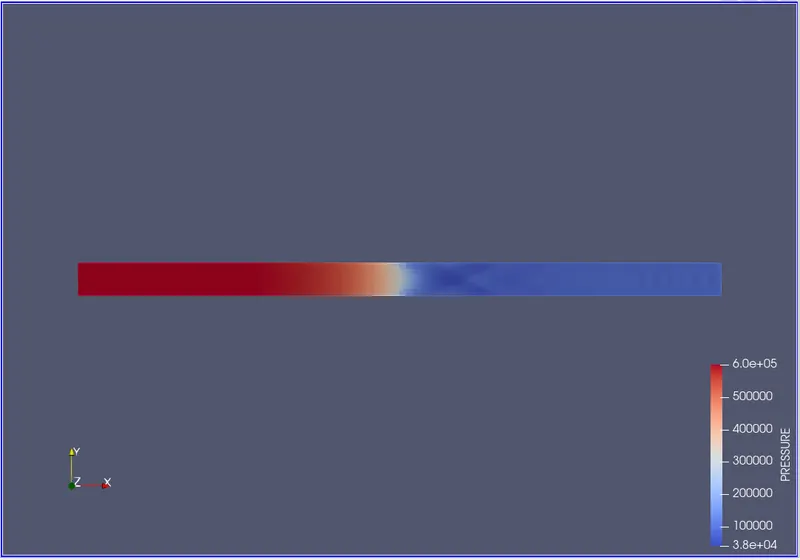
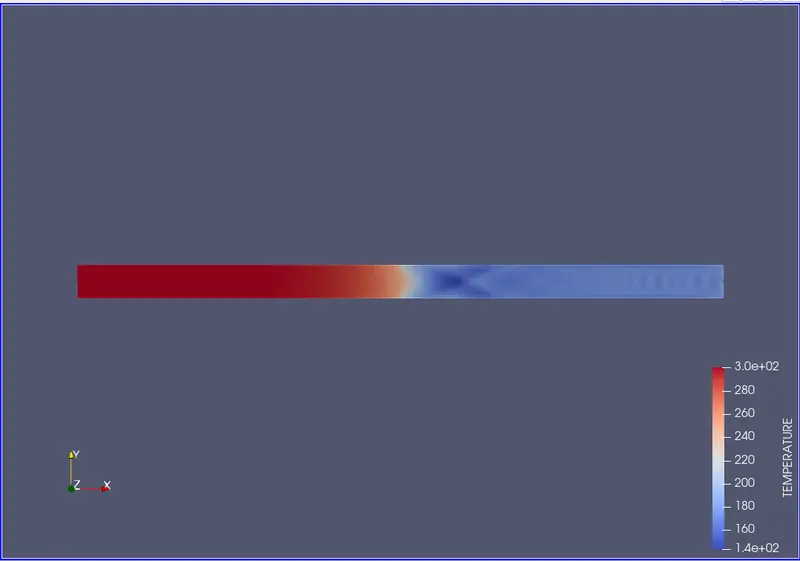
- Plot the pressure and temperature history in the entire domain - Explain the result
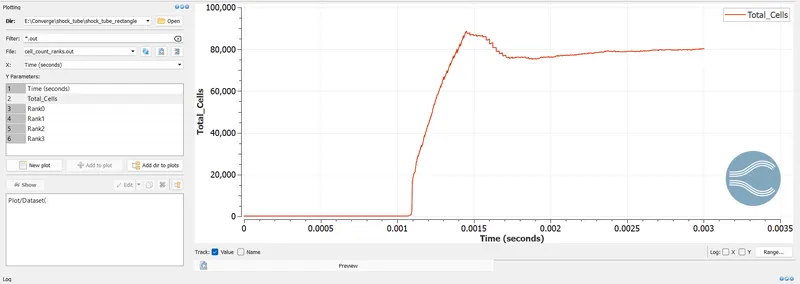
- Plot the cell count as a function of time - Explain the result
Here we are going to deal with a simulation project of a simple Shock Tube Problem.
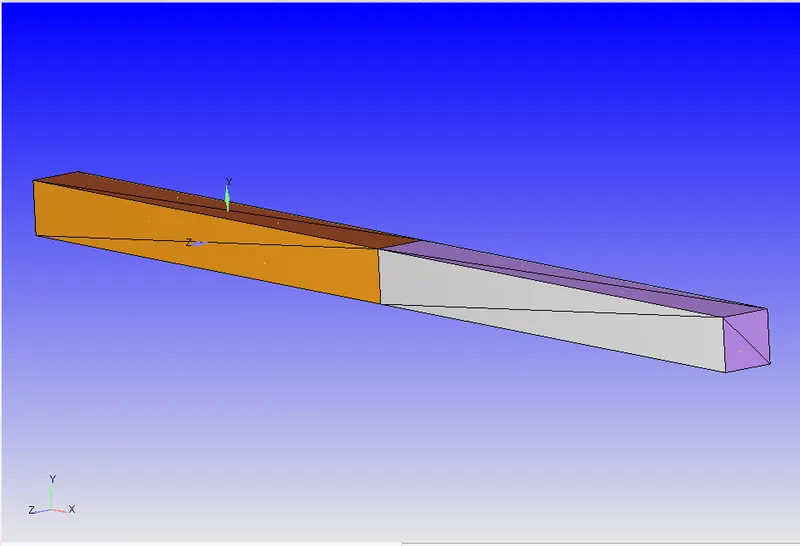
This is the geometry for which we are going to run the shock simulation
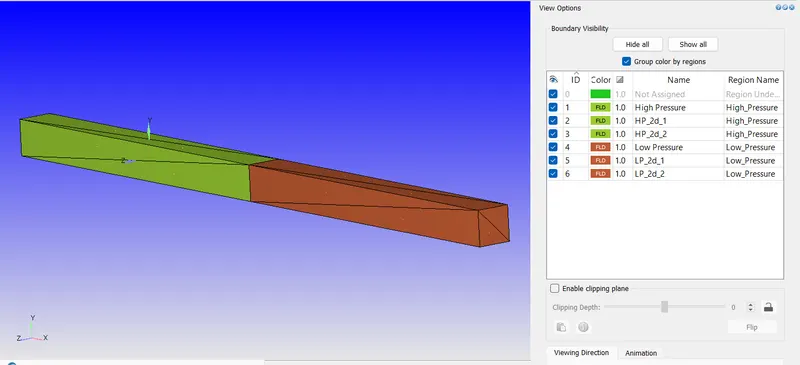
For the first, we need to assign the boundaries as follows.
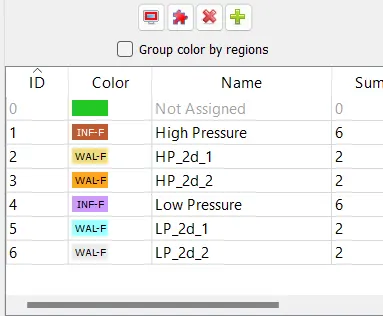
Starting the case setup
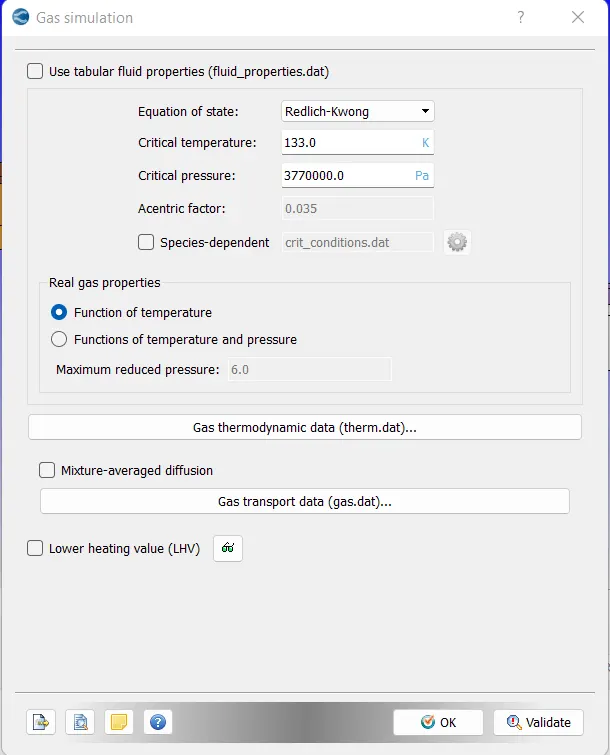
Set the Gas Simulation as default
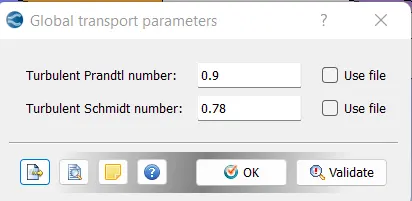
Global Transport Parameters as default
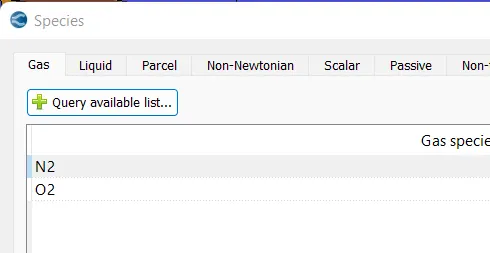
Species as follows
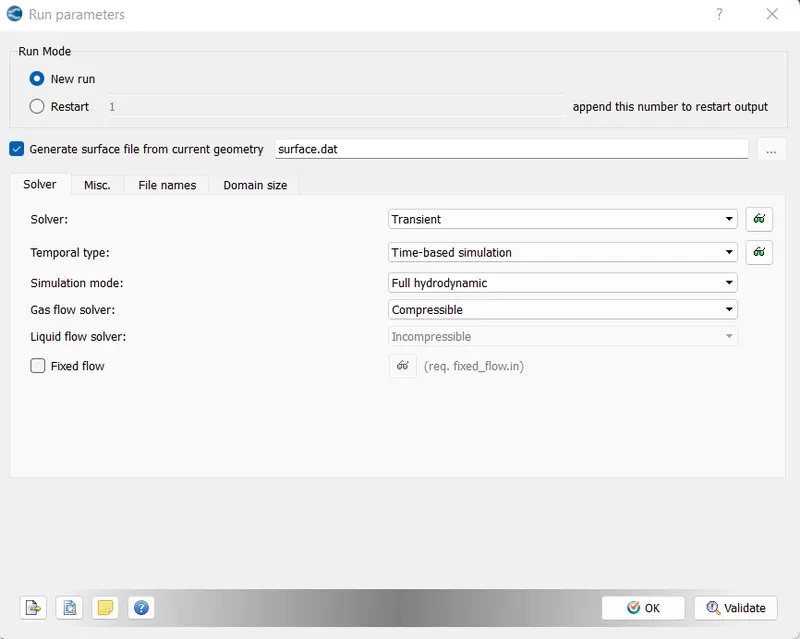
Run Parameters as default
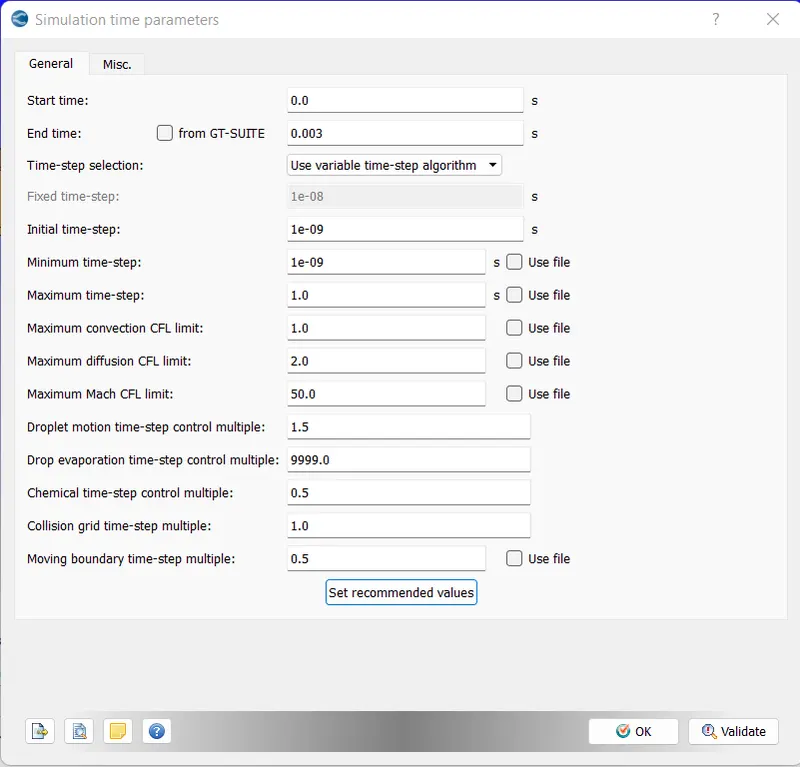
Simulation time parameters as follows
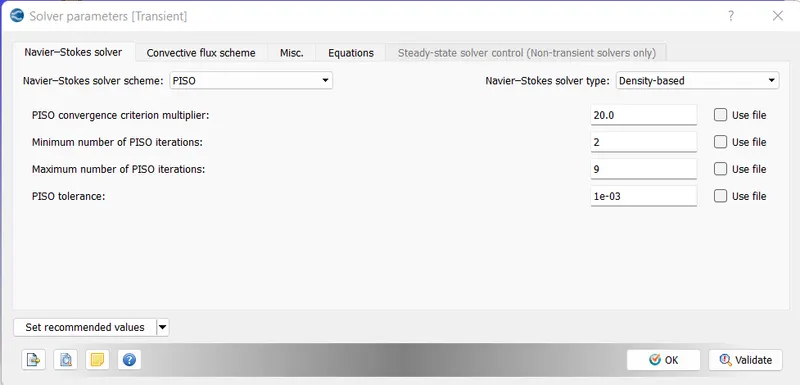
Solver Parameters as default
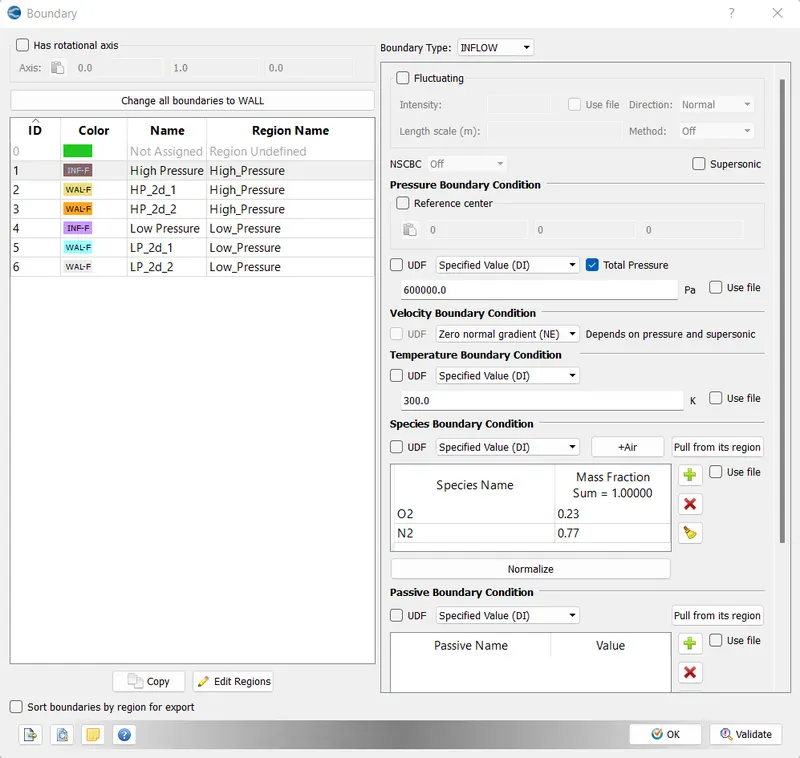
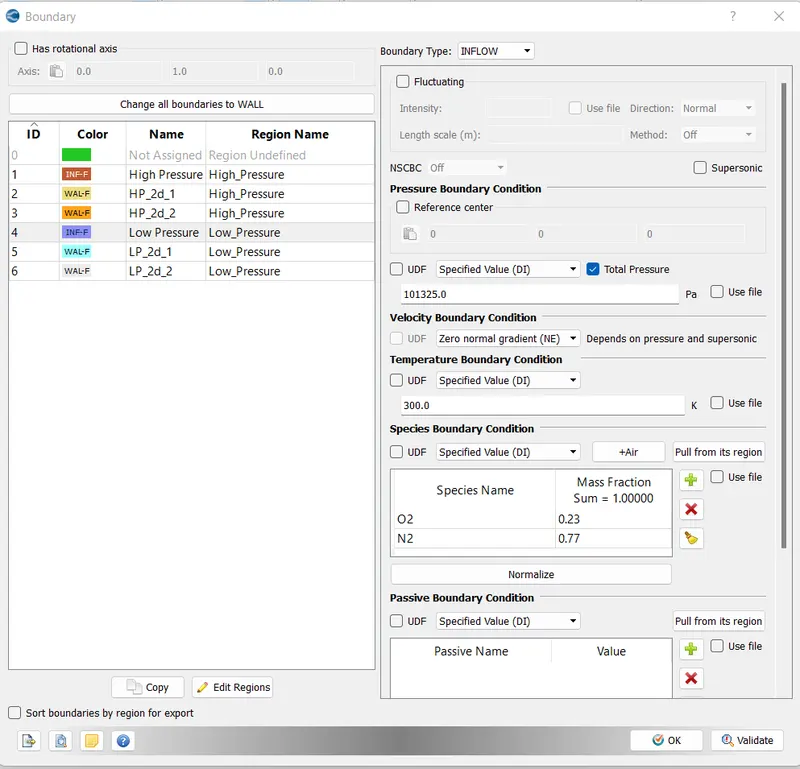
Boundary Conditions,
High Pressure Region is set as follows
Low pressure region as follows
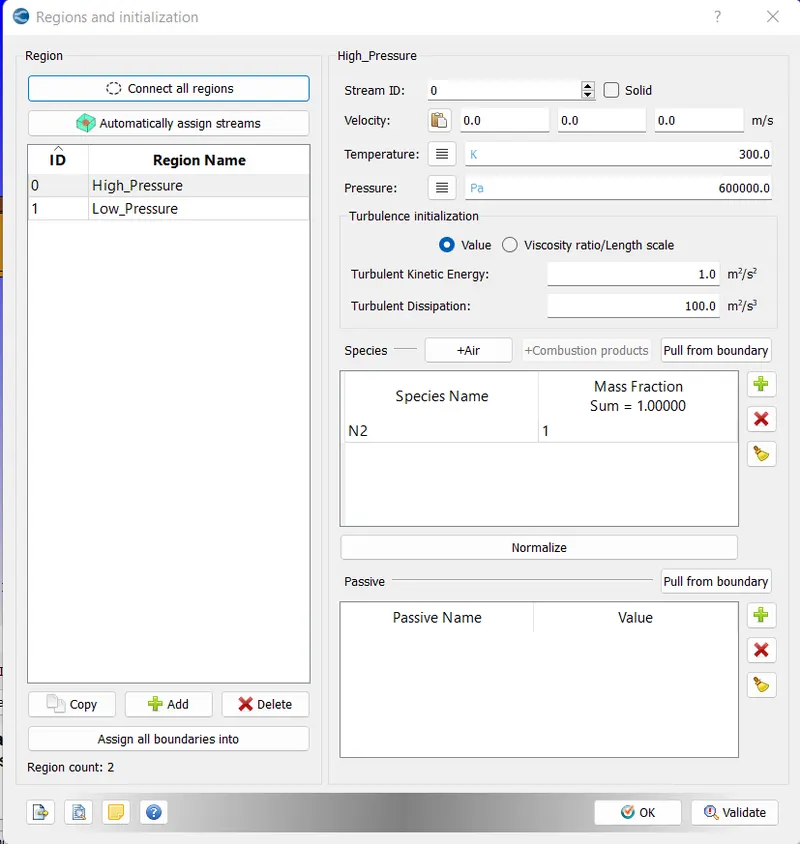
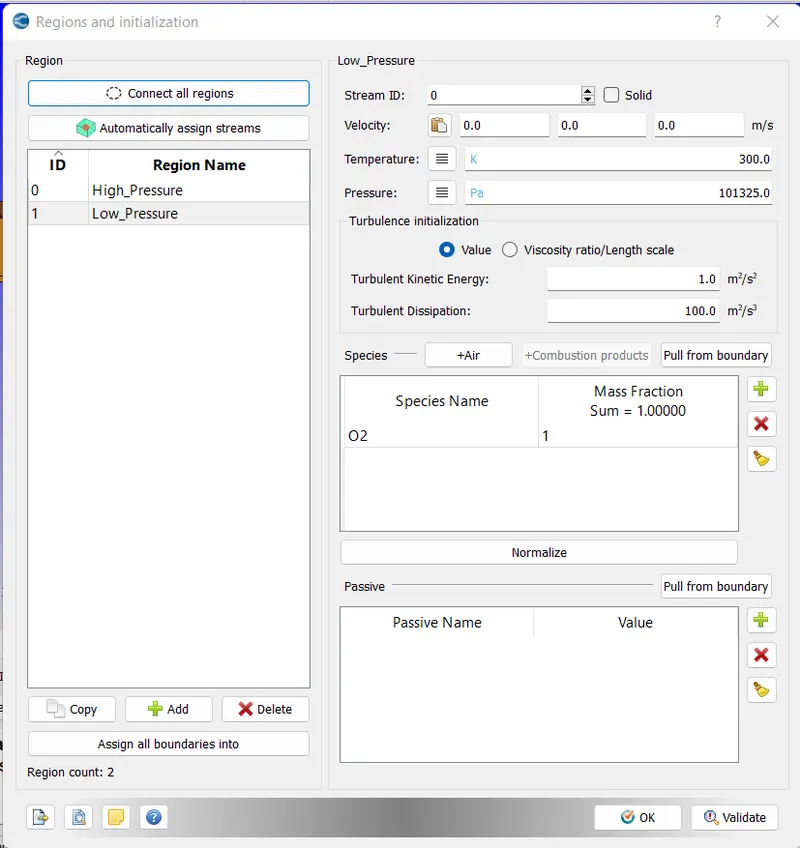
Regions and Initialization
High-Pressure Region
Low Pressure region
Group color by region
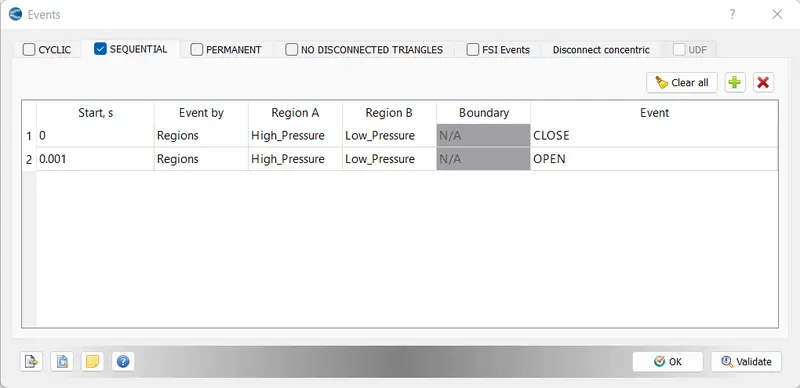
Events
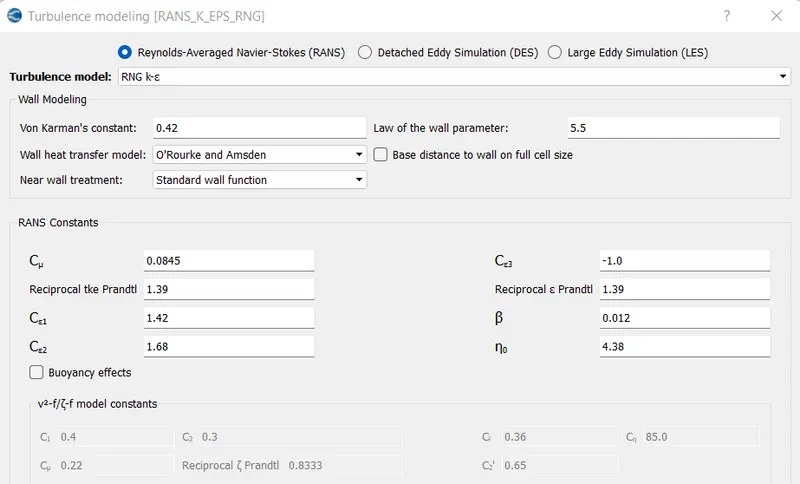
Turbulence Modeling as default
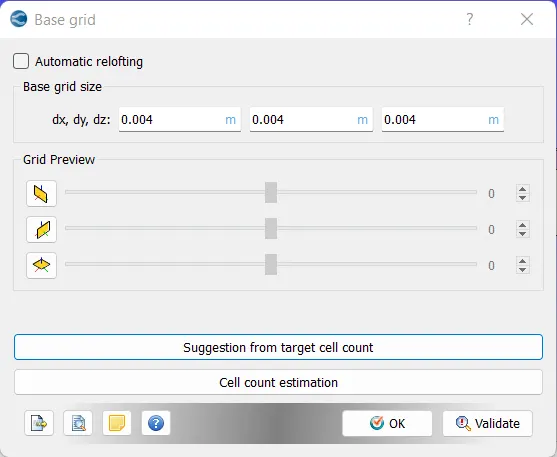
Mesh size
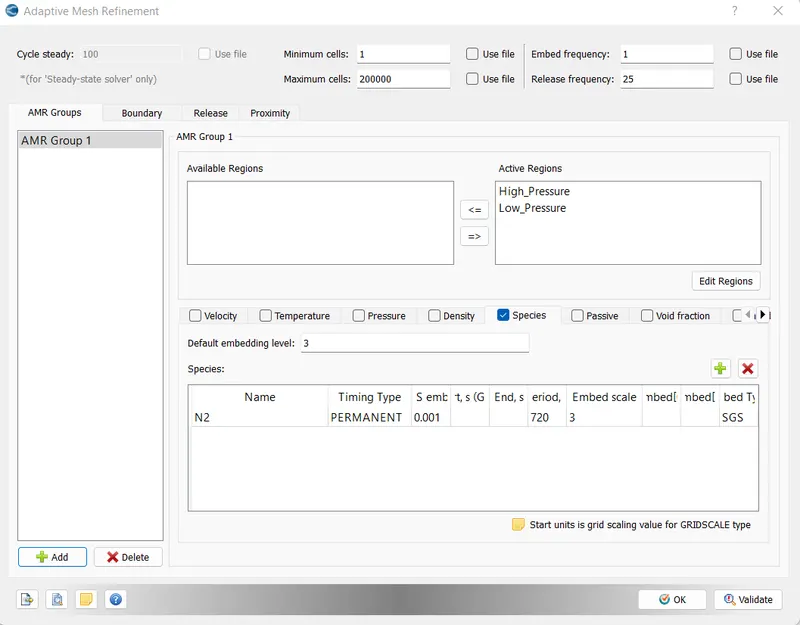
Adaptive Mesh Refinement is as follows
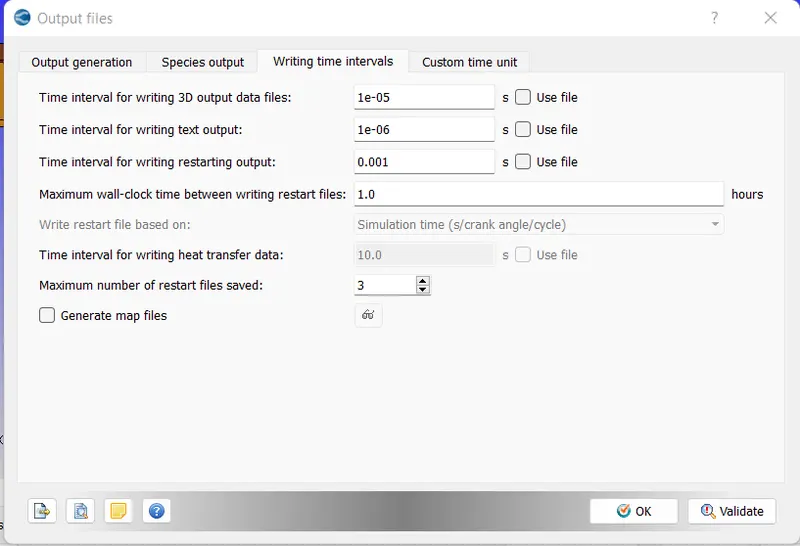
Output files is as set as follows
Now we have completed setting up the case tree. Now we need to run the simulation on Cygwin on the exported files.
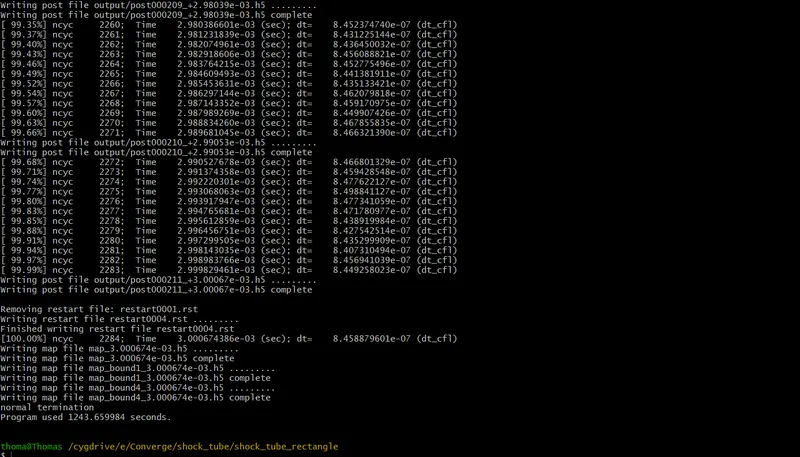
The simulation ran successfully
The RESULTS
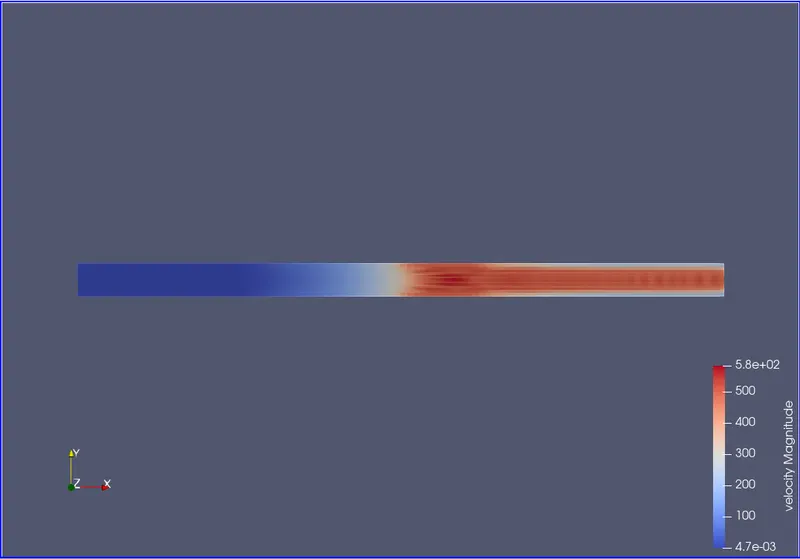
Velocity Magnitude Contour
Pressure Contour
Temperature Contour
Plot of Cell Count X Time
Youtube Videos
Velocity Contour
Pressure Contour
Thank You