Week 7 Challenge
Aim: To Calculate the water current forces for the bridge shown in above figure.
Given data:
HFL is 2.00m above the foundation level
Span of the bridge = 2 x 45.00 m
Mean velocity Vmean = 3.00 m/s
Assumption :
Assuming circular piers of 1.70 m diameter
Procedure:
Water current forces are the forces caused by the ocean currents. Deep ocean currents are driven by density and temperature gradients.
Major ocean currents are:
a) North Equatorial current
b) Equatorial counter current
c) Atlantic current
d) North pacific current
e) South pacific current
Different layers of water dont have same density. Water layer having higher density get settled down. Water having high temperature zone tends to move to a place of low temperature zone. Whenever there is temperature gradient between two definetly there will be movement of water to a place of low temperature zone. This generates huge force. This is called water current force. This force will increase from time to time due to change in global warming.
Calculation:
Whenever bridge piers are subjected to flowing water conditions or running water in the river, they aresubjected to a force called water current force.
1. Maximum velocity Vmax = sqrt(2) x V mean
where, Vmax = Maximum velocity of current at the point where the pressure intensity is being calculated in m/s
Vmean = Mean velocity in m/s
Vmax = sqrt(2) x 3 = 4.242m/s
2. Water current P = 52 K Vmax^2
where, P = Intensity of pressure due to water current in kN/m2
Vmax = Maximum velocity of current at the point where the pressure intensity is being calculated in m/s
K = Shape factor based on the shape of pier
| Sl.No. | Pier Shape | Shape facor K |
| 1. | Square ended peirs | 1.50 |
| 2. | Circular piers | 0.66 |
| 3. | Piers with semi circular ends | 0.66 |
| 4. | Piers with triangular ends (0 to 30 deg) | 0.50 |
| 5. | Piers with triangular ends ( 30 to 90 deg) | 0.5 to 0.9 |
P = 52 x 0.66 x 4.242 = 617.57 kN/m2
Since P is area load, 617.57 x 1.7 m pier = 1049.869 kN/m
This has to be applied in STAAD.Pro
3. Structure is modelled in STAAD.Pro with 2 x 45.0m span having 8.0m pier height and abutment of 7.0m height.
Two inner main girders are provided at spacing of 5.0m and five inner cross beams are provided at 7.50m
0.5 x 0.5 m mesh is modelled for deck slab
- StaadPro PROCEDURE:-
1. Firstly a node is created. The height of pier is taken as 10 m.
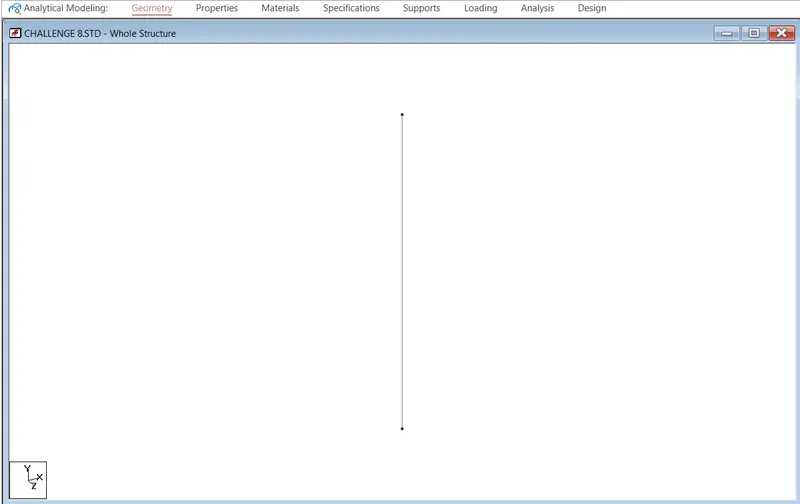
Figure Pier is created using node
2. After that with the help of translational repeat the frame of bridge is created.
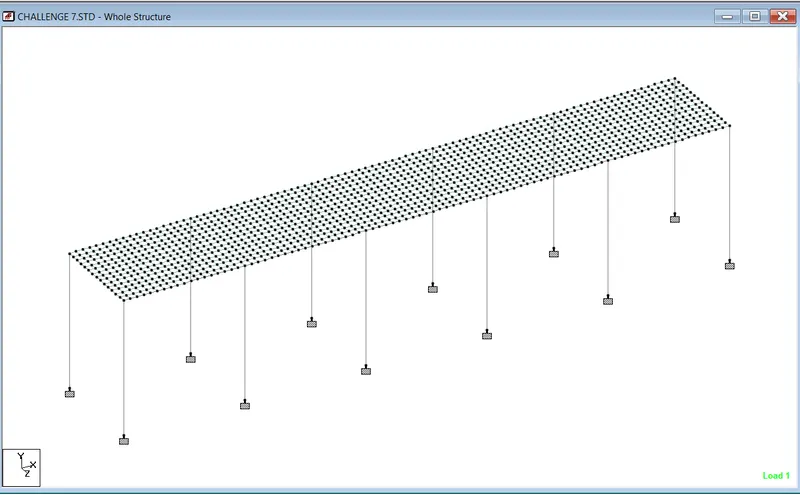
Figure Bridge frame is created with the help of node using translational repeat option
3. The bridge deck is created by using the mesh size of 0.5*0.5 m. The thickness of deck slab is 250 mm
4. A circular pier of diameter 2.5 m is created. The centre to centre distance between the pier is 9 m.
5. A fixed support is created at the base of the pier.
6. Tappered I section girder is created using define option.
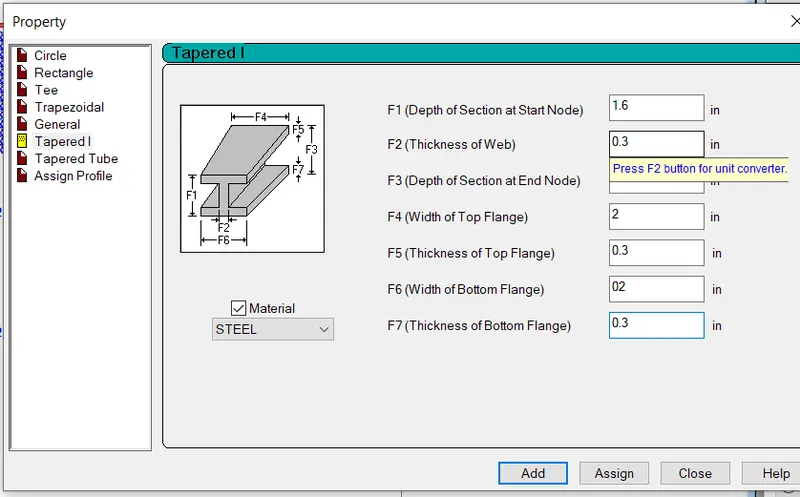
Figure Property of I Section
7. Cross beam of size 0.5 m * 1 m is created.
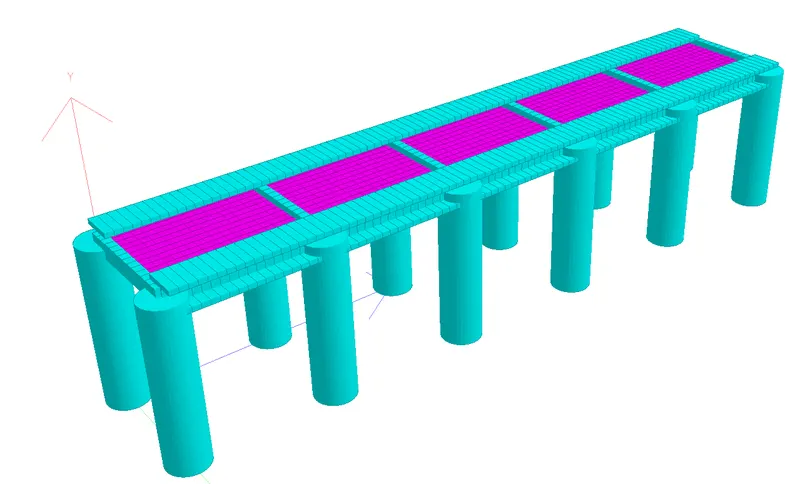
Figure 3D view of bridge
- LOADING
Loading >load case details > ADD > WATER CURRENT FORCES > ADD > MEMBER LOAD > LINEARLY VARYING
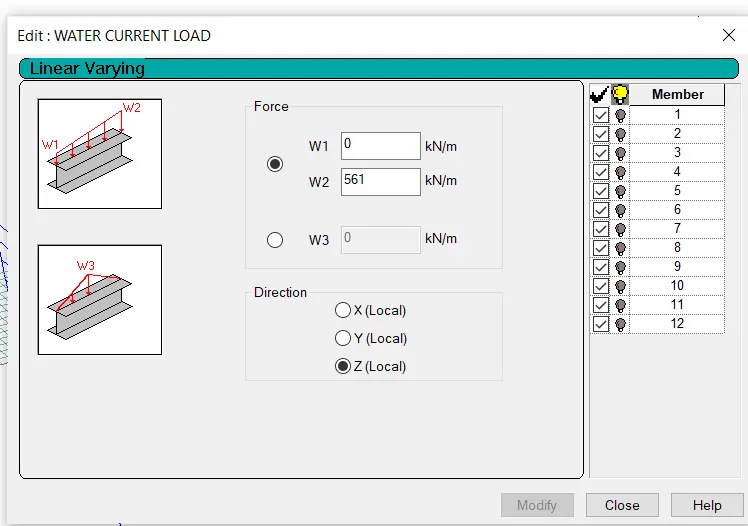
Figure Defined loading condition
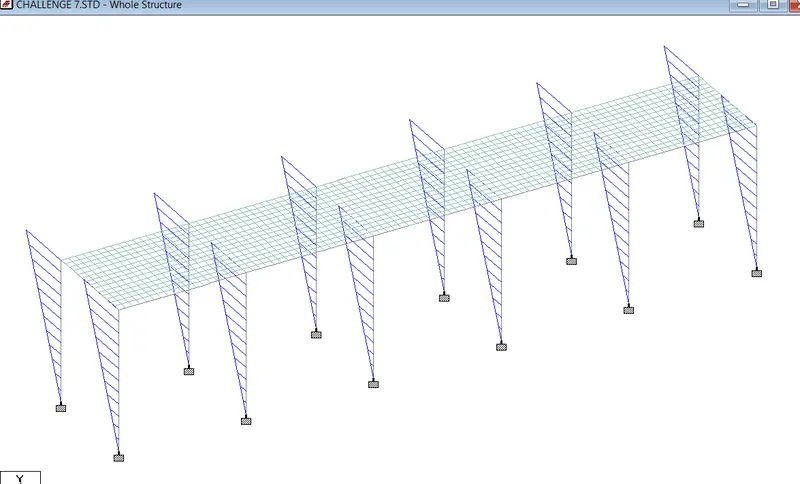
Figure Loading diagram of water current forces in -Z direction
- RESULT ANALYSIS:-
1. STATIC CHECK:- Static check is ok as the difference between load and reaction is zero.
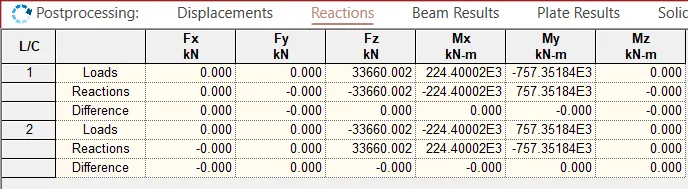
Figure Static check
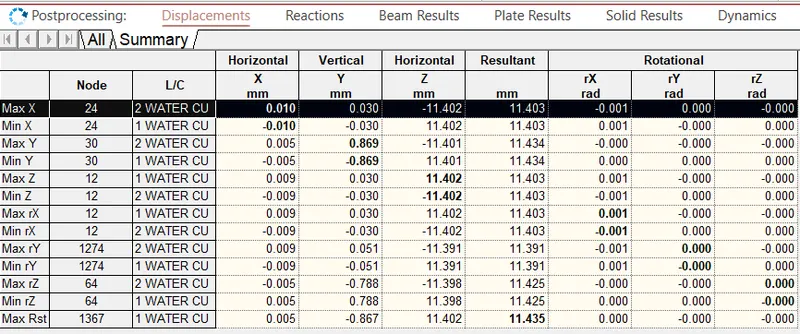
2. DEFLECTION:- Maximum deflection of the structure is 11.435 mm in Z direction at node 12
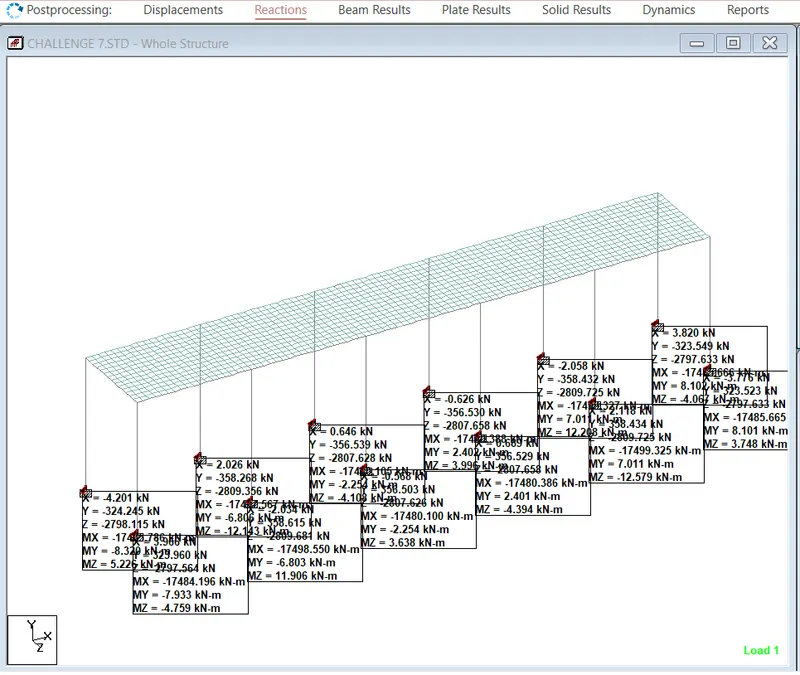
3. REACTION:-
| Horizontal | Vertical | Horizontal |
| Fx (KN) | Fy (KN) | Fz (KN) |
| 4.201 | 358.615 | 2809.725 |
| Moment | Moment | Moment |
| Mx (KN-m) | My (KN-m) | Mz (KN-m) |
| 17499.327 | 8.320 | 12.579 |
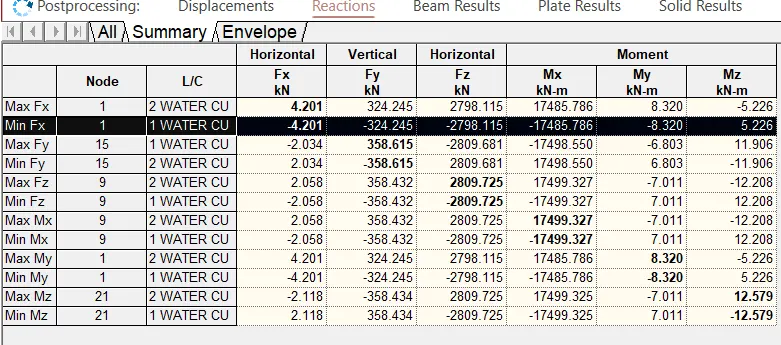
Figure Maximum reaction coming out of all the load cases
4. BEAM RESULTS:- GIRDER
|
Mz (KN-m) (At middle) |
Mz (KN-m) (At support) |
My (KN-m) | Shear y (KN) | Shear Z (KN) |
| 38.511 | 7.691 | 21.039 | 4.193 |
- CROSS BEAM
|
Mz (KN-m) |
My (KN-m) | Shear y (KN) | Shear Z (KN) |
| 1029.566 | 0.360 | 291.468 | 0.568 |
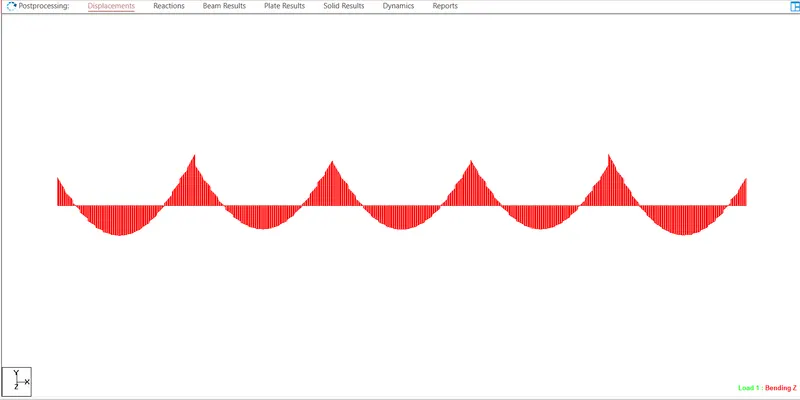
Figure Bending moment diagram of girder
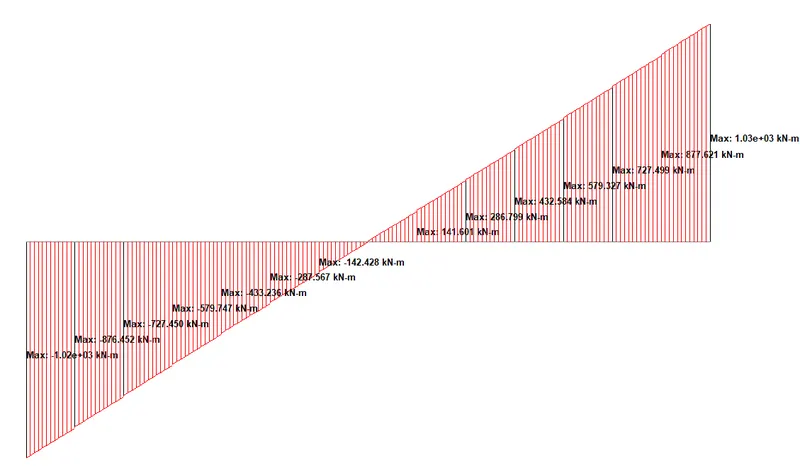
Figure Bending moment diagram of cross beam
5. PLATE STRESSES
|
Mx (KN-m/m) |
My (KN-m/m) | Mxy (KN-m/m) | Shear y (N/mm2) | Shear Z (N/mm2) |
|
7.9847 |
32.147 | 3.73 | 0.053 | 0.184 |
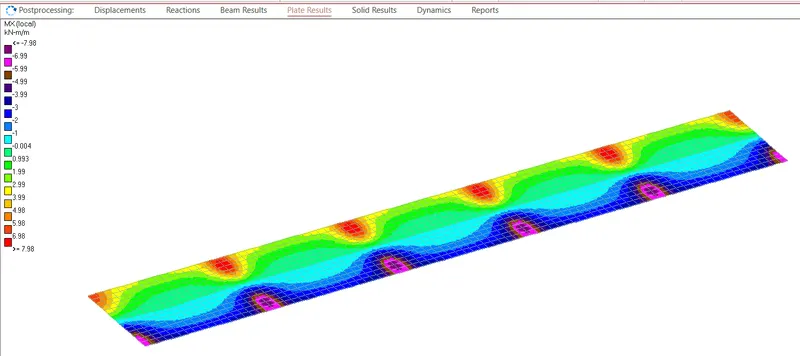
Figure plate stresses (maximum moment in x direction)
6. PIER RESULT
|
Mz (KN-m) (At middle) |
My (KN-m) | Shear y (KN) | Shear Z (KN) |
| 36.789 | 17499 | 4.201 | 2809.725 |
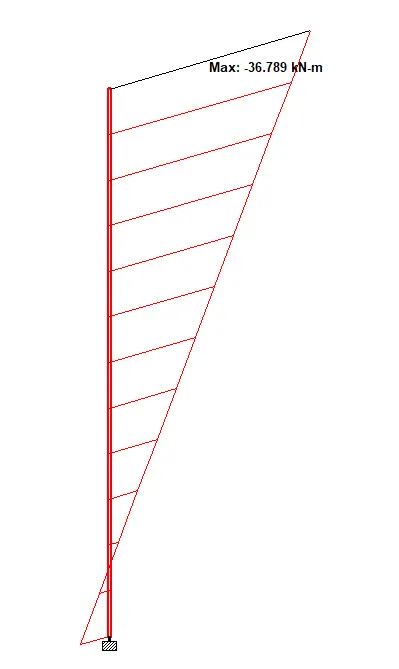
Figure Pier bending moment
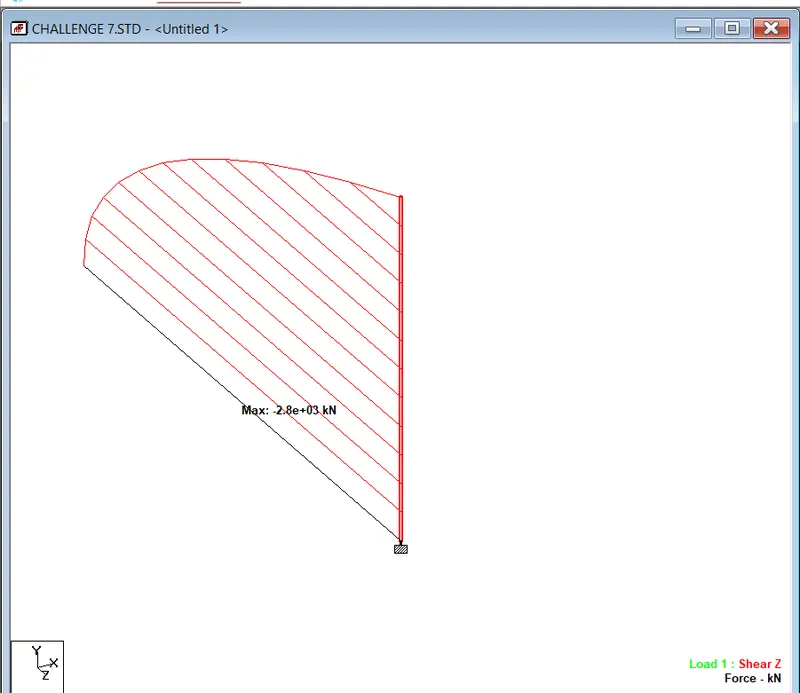
Figure Pier shear force